Theoretical study of magnetic properties and hyperfine interactions in -FeV alloys
Abstract
Electronic structure Korringa-Kohn-Rostoker calculations for the -phase in Fe100-xVx were performed in compositional range of its occurance (). Fe and V magnetic moments and hyperfine fields were determined for five inequivalent lattice sites in two models of magnetic structure, namely ferromagnetic FM and so-called anti-parallel one, APM, dominated by antiferromagnetic coupling. The average magnetic moments calculated for FM state overestimate the experimental data, whereas the corresponding quantities computed for APM state, underestimate them. Such a behavior remains in line with total energy values being similar for both models. The calculations showed that both average magnetic moments and hyperfine fields (on Fe and V atoms) vary with a number of Fe atoms in the nearest neighbor shell, , starting from critical values of , characteristic of each site.
The calculated hyperfine fields for Fe and V showed an important role of valence contributions, being strongly dependent on local magnetic moments arrangements. In the case of Fe, the computed hyperfine fields are overestimated with respect to the Mossbauer data, while the corresponding values for V are underestimated with respect to the NMR results. However, the linear correlation between average magnetic moment and hyperfine fields, observed experimentally in FeV -phase, can be well reproduced when combining theoretical results for the two above-mentioned magnetic structure models.
pacs:
71.15.Mb, 71.20.-b, 71.20.Be, 75.20.Hr, 75.50.Bb, 75.50.EeI Introduction
Among the so-called Frank-Kasper phases that can be geometrically described in terms of the basic coordination polyhedron with coordination number equal to 12, 14, 15 and 16 Frank58 , the -phase that can occur in transition-metal alloy systems, is known as the one without definite stoichiometric composition. Consequently, it can exist in different composition ranges and, therefore, its physical properties can be tailored by changing its constitutional elements, and within a given constitution, by changing chemical composition. Among about 50 examples of binary -phases that have been reported so far in the literature, only two viz. -FeCr and -FeV are known to have well evidenced magnetic properties Parsons60 ; Hall66 ; Read66 ; Read68 ; Cieslak04 ; Cieslak08a ; Cieslak09 , though a knowledge of the -phase magnetism remains not complete. In particular, neither values of the magnetic moments, , on particular lattice sites nor a coupling between them is known. A lack of stoichiometry, leading to a huge number of different atomic configurations, combined with a weak magnetism i.e. small values of makes it very difficult for microscopic methods like Mössbauer spectroscopy or nuclear magnetic resonance to uniquely determine spin-densities at the level of the sublattices. Non-availability of big enough single-crystals of the -phase prevents the neutron diffraction techniques to be used for that purpose. In these circumstances, performing theoretical calculations aimed at determining electronic and magnetic structures of the phase is highly needed and helpful.
The present paper reports such calculations for the Fe100-xVx system where the -phase exists in a wide range of composition (), and its magnetic properties show a strong -dependence. For example, the Curie temperature may vary between 0 K, for , and 320 K, for Cieslak09 . This gives a unique chance for testing the calculations which were already successfully applied for similar purpose in the -FeCr alloy system Cieslak10b where the phase exists in a much narrower compositional and temperature ranges.
II Computational Details
Electronic structure calculations for FeV compounds have been performed using the charge and spin self-consistent Korringa-Kohn-Rostoker (KKR) method. The muffin-tin crystal potential has been employed within the local density approximation (LDA) framework, where the von Barth-Hedin formula Barth72 for the exchange-correlation part was used. The self-consistent crystal potentials were converged below 0.1 mRy and charges below . The spin-polarized densities of states were computed employing the tetrahedron k-space integration technique. The local magnetic moments (of Fe and V) inside each muffin-tin spheres were determined. Accordingly, the Fermi contact hyperfine fields () resulted from the spin densities extrapolated to , , with the use of the well-known non-relativistic formula in kOe Blugel87 . The KKR calculations allowed to determine core () and valence () terms, neglecting however dipolar and orbital contributions to the total hyperfine field. It is worth noting that electronic structure calculations have been done for ordered approximants of the disordered FeV alloys, and for that purpose the symmetry of the unit cell was lowered to a simple tetragonal one. In practice, the tetragonal unit cell (space group P/mnm) and atomic positions were unchanged but variable occupancy made all 30 atomic positions crystallographically nonequivalent (space group P) being next occupied exclusively either by Fe or V atom. Calculations have been performed for two -FeV alloys with different compositions, namely Fe20V10 and Fe12V18. They are equivalent to the formula Fe100-xVx with and , respectively. The chosen compositions correspond fairly well to border concentrations of the -phase existance in the Fe-V alloy system Kubaschewski82 . Fe and V atoms were distributed over five inequivalent sublattices of the tetragonal unit cell in close agreement with experimentally determined occupancies Cieslak08c . Actually, the used here atomic configurations in the unit cell remained strictly the same as those considered previously in electronic structure calculations of the -FeV phase in a paramagnetic state Cieslak10a .
III Results and Discussion
III.1 Magnetic Moments
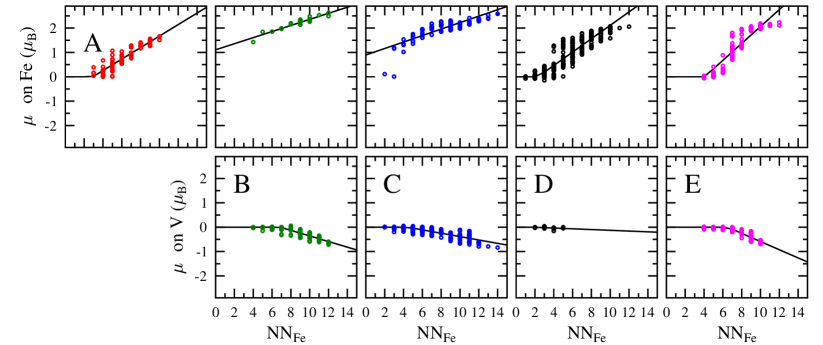
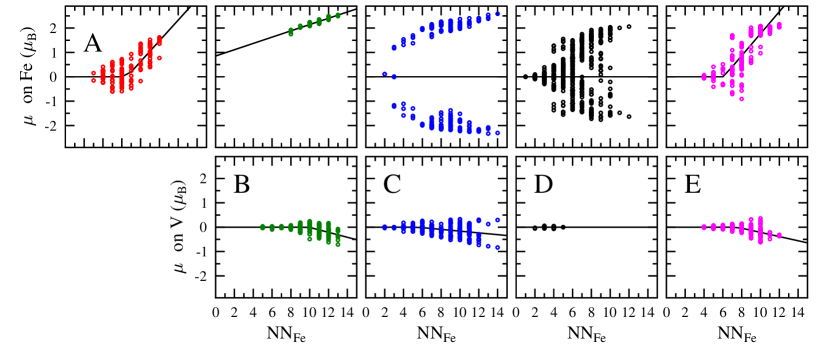
In order to study magnetic properties from first principles calculations, two collinear models of a possible magnetic ordering were taken into account: (i) parallel alignment of local magnetic moments, called here ferromagnetic, FM, as derived directly from spin-polarized calculations, and (ii) antiparallel alignment, called here APM. In the latter, Fe/V atoms in selected sublattices were initially coupled antiferromagnetically according to predictions of a symmetry analysis as given in details elsewhere Cieslak10b . The magnetic moments and hyperfine fields, , corresponding to both Fe and V atoms distributed over the five sublattices were a subject of a further analysis. Their non-zero values were found for both Fe and V atoms. As a rule, the magnetic moments (and the hyperfine fields) on V atoms were found to be much smaller, and, generally, polarized opposite, to those on Fe ones.
The calculated values of and for each sublattice were analyzed versus a number of Fe atoms in the nearest neighborhood, . Such approach combining the results obtained for the two border concentrations, shows that the two sets of the computed data are complementary, and they cover the expected range of for all sublattices.
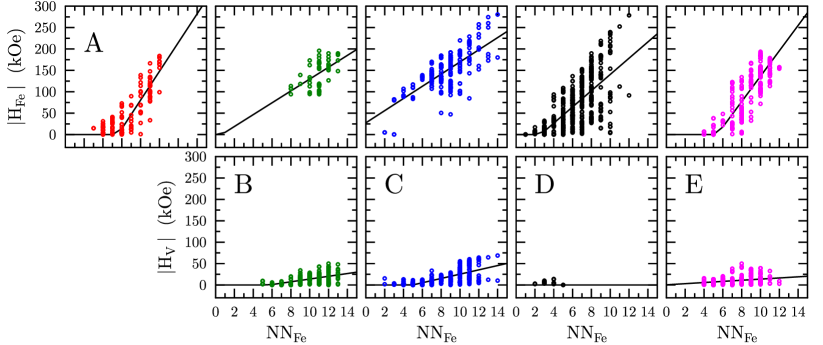
A detailed analysis of the -dependence of the magnetic quantities for each of the sublattices shows that this relationship can be split, in most cases, into two regions showing a linear character. In the investigated -FeV system, an average magnetic moment per an atom, , on a given sublattice remains zero up to a critical value of , and for it varies linearly in accord with the equation
| (1) |
A similiar dependence on was also obtained for the average , , for all sublattices, and both considered models of the magnetic ordering (FM and APM).
Noteworthy, a similar discontinous -dependence was already reported in the analysis of the atomic moment in bcc Fe-V alloys Shiga78 , and also used in calculations of the hyperfine field distribution curves for nanocrystalline bcc Fe-V alloys Ziller01 . The critical value of as found by these authors was rather small, , when accounting for the magnetic moments localized on Fe-atoms. In the present case of the -phase, values and slopes of the lines were found by a fitting the data calculated for Fe and V atoms located on five various sublattices, separatelly. The obtained -values in that way do not exceed 6, as can be clearly seen in Figs. 1 and 2. It is worth noting that negative values of , as found in several cases, mean that the magnetic moments do not vanish for all -values, as derived from Eq. 1.
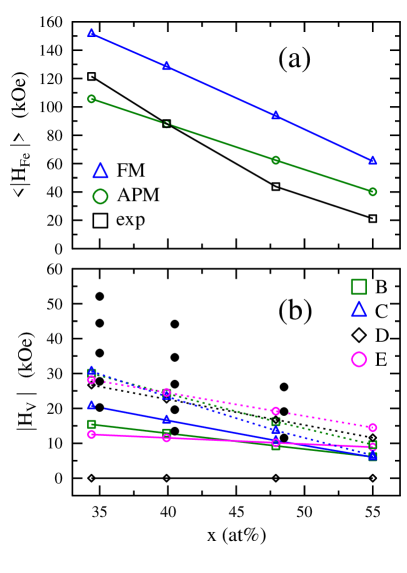
The calculated magnetic moments for both types of atoms located on all crystallographic positions combined with calculated probabilities of these position occupancies allowed to determine the average values of the magnetic moments, , for each sublattice and for any concentration of vanadium. In the same way, one could compute the average magnetic moment per atom (per unit cell). In practice, such calculations were performed for four selected concentrations that corresponded to the samples on which the magnetic measurements were performed. A comparison between the calculated and experimentally determined quantities is displayed in Fig. 3. It can be clearly seen that the values of calculated applying the FM model are systematically larger than those found experimentally, . The difference between the former and the latter changes from about per atom for to for . However, the overall dependence of on the vanadium content follows well that found experimentally. On the other hand, the -values derived from the APM model are underestimated in comparison to those of but the agreement bewteen theoretical and experimental values markedly improves with increasing V content. For the vanadium richest sample, Fe45V55, the measured value of is practically the same as the one calculated with the APM model, .
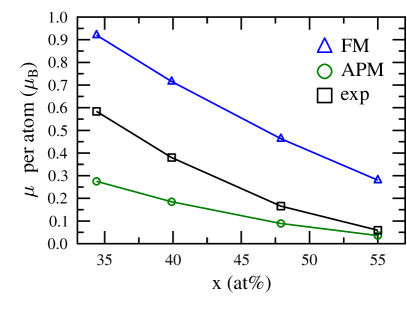
The relationship between the measured and calculated values of can be explained in terms of a total energy of the -phase, , calculated for the two models of magnetic of ordering ( and ). The energy difference , was determined using the electronic structure calculations for the two border concentrations of the -phase within both FM and APM models. In the case of the -Fe20V10 alloy -value ranges from to mRy per atom, that would favour the FM model. For the -Fe12V18 alloy the -value almost vanishes (less than 0.05 mRy). The total energy difference of the -phase can be compared to KKR results obtained for FM and (hypothetical) AFM ordering in a simple -phase with the same Fe-V composition. It yields the value of mRy per atom (also favoring FM ordering), being thus an order of magnitude larger than in the former case.
Hence, the small difference between total energies computed for the FM and APM structures may suggest that some regions of the sample have the antiparallel magnetic order (APM), whereas in others the magnetic moments arrange mostly ferromagnetically (FM). In other words, the magnetic properties of the -FeV can be thought of as a coexistence of two types of the ordering. The relative contribution of them should depend on the alloy composition. In view of the total energy analysis, the contribution of the APM-like regions should be increasing with the vanadium concentration, , since the value decreases with . The latter effect is also observed experimentally in the dependence - Fig. 3.
On the other hand, it should be remembered that both FM and APM models do not strictly refer to the ferromagnetic and antiferromagnetic ordering of Fe/V magnetic moments in the -phase. They should be rather treated as starting configurations, and finally converged magnetic moment values and their orderings may differ from the initial alignments. In consequence, magnetic moments on Fe/V atoms may vary both in magnitude and in a mutual coupling, also due to the fact that the -FeV phase is a chemically highly disordered system. In particular, it is possible that the real magnetic ordering is not collinear. A necessary condition for the occurence of spin-canting i.e. competition of ferromagnetic and antiferromagnetic interactions, has been here, and also in the case of the Cieslak10b theoretically suggested to exist.
III.2 Fe and V hyperfine fields
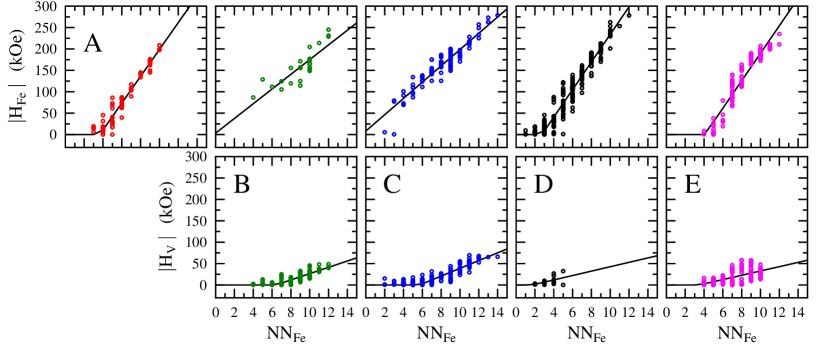
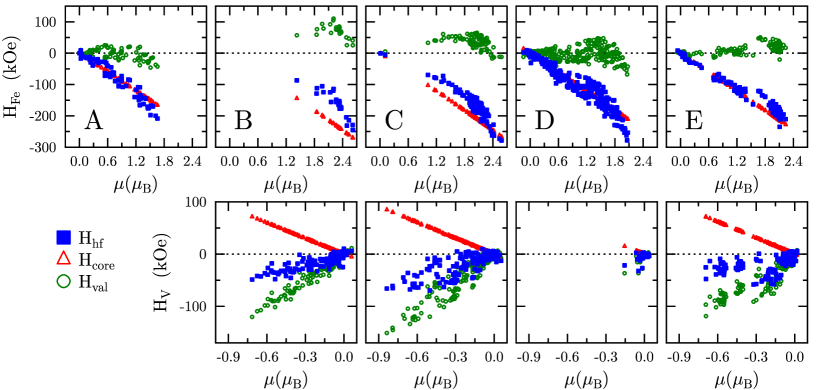
Another quantity pertinent to magnetic materials that has been calculated is a hyperfine field, . Although its correlation with the magnetic moment is usually non-linear and, in some instances, even non-monotonous Dubiel09 , in the case of the -FeV alloys and exhibit a perfect linear correlation Cieslak09 . In addition, for the -FeV compounds the hyperfine fields had been measured both on 57Fe and 51V Cieslak09 ; Dubiel10 , so they can be used as a proper data set for testing pertinent theoretical calculations. Those obtained presently by means of the KKR calculations for the FM and APM models are shown in Fig. 4 and 5, respectively. As can be clearly seen one can distinguish two rangies for all sublattices and occupations, namely zero-field range () for small values of , and proportionality range () for higher -values. In order to compare the calculated -values with the experimental ones (Mössbauer and NMR data) we consider only the absolute values, .
Concerning the Fe-site hyperfine fields, we can make a comparison - see Fig. 6a - only between their average values, , due to the fact that experimentally only such quantity is available from the 57Fe-site Mössbauer spectroscopic measurements Cieslak09 . As it follows from Fig. 6a, the average hyperfine field on Fe atoms as calculated in the frame of the FM model decreases linearly with from kOe for to kOe for . The corresponding -values obtained by means of the APM model also decrease linearly with from kOe to kOe, but at a slightly lower rate. The measured values of show a non-linear behavior. For the lowest V concentrated sample () its value lies between those found for the FM and APM models. For it is equal to the value calculated with the APM approach, while for higher -values it is smaller than the calculated values. The observed quantitative agreement between the measured and the calculated values of the hyperfine fields is not fully satisfying what can have different reasons. First of all, we should bear in mind that in our present calculation only the Fermi contact term was taken into account, while other possible contributions like dipolar and orbital ones, were neglected. But we do expect that the most important influence on the computed -values could have a local ordering of magnetic moments which mostly modify its valence terms. It is well seen on the dependencies of and contributions vs. magnetic moments for FM model (Fig. 7). As expected, is perfectly linear vs. with the expected slope of about (both for Fe and V atoms whatever the sublattice), while for there is no apparent correlation with the magnetic moment, since it strongly depends on atomic and magnetic surroundings. In a real magnetic structure, valence contributions to may vary both in magnitude and in direction. The latter is not provided by the present calculations when using simplified FM and APM models. It is worth noting that for Fe atoms the calculated are dominated by (best seen on A, D and E sites in Fig. 7), which are fully correlated with local magnetic moments. Since the calculated hyperfine fields overestimate the experimental data, one should expect that the valence contributions, which are opposite in sign to the core contributions, may diminish this disagreement. Hence, accounting for a more complex magnetic structure (with different local magnetic moments directions that mostly affect ) could improve experiment versus theory agreement for the results on Fe atoms.
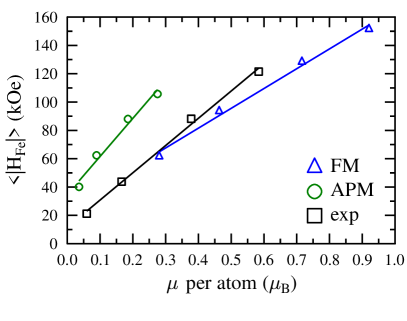
On the other hand the correlation between the calculated average Fe-site hyperfine field and the corresponding magnetic moment (per atom) - see Fig. 8 - agrees quite well with the measured one: the slope of the experimentally found line has the average value of 19 T/ if the magnetic moment is calculated per an atom in the unit cell (or 14.3 T/ when the magnetic moment is determined per one Fe-atom in the unit cell Cieslak09 ), while that of the theoretically determined lines amounts to 14 T/ for the FM ordering and to 27 T/ for the APM one. In other words, the experimentally found line lies between the two theoretically calculated ones. This can be taken as a further support for our approach that the magnetic ordering in the studied system can be treated as a combination of FM- and APM-ordered regions.
Concerning the 51V fields, we have calculated the fields for four sublattices (B, C, D, and E) as we can compare these quantities with experimentally determined ones for each of the five sublattices Dubiel10 . In addition, the average values of the V-site field, , were evaluated, too. A comparison between the theoretical and experimental data, displayed in Fig. 6b, gives an evidence that the fields calculated for particular sites are underestimated by a factor of . In consequence, the average field, namely the calculated decreases with at a lower rate than the measured one. Using the same arguments as for the Fe-site hyperfine fields, we expect that are not sufficiently well evaluated within the FM and the APM models. Fig. 7 shows that absolute values of are slightly larger than the corresponding ones of , resulting in relatively small total hyperfine fields on V. Consequently, the calculated hyperfine fields became underetimated with respect to the experimental ones.
III.3 Mössbauer Spectra
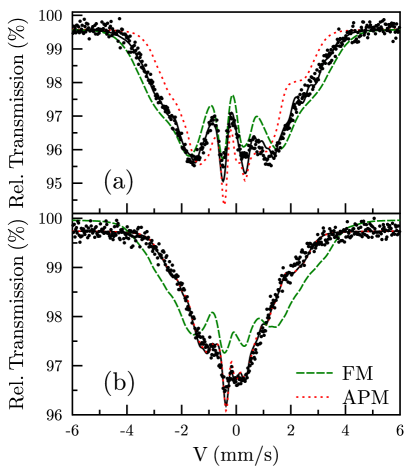
The calculations reported in this paper can be also used in the analysis of Mössbauer spectra. Towards this end we assumed the Mössbauer spectrum to be composed of five subspectra correspondig to the 57Fe atoms located on the five inequivalent lattice sites. The relative area of each subspectrum should be proportional to the number of Fe atoms occupying a given site and it was assumed to be equal to that known from neutron diffraction experiments Cieslak08c . Each subspectrum represents a distribution of the hyperfine fields (hfd) with quadrupole splittings, , and relative isomer shift-values, , identical to those determined from room temperature measurements and presented in Ref. Cieslak10a, . The hyperfine field distributions for each concentration were computed on the basis of probability distributions and calculated dependences obtained from FM and APM models. As can be clearly seen in Fig. 9, the Mössbauer spectrum recorded on the sample with could be cuccessfuly fitted assuming the hfd to be weighted average of hfd obtained from the FM model (weigt 58%) and the APM one (42%). For the sample with it was enough to take into accout the hfd calculated for the APM model, only. For more concentrated samples it was not possible to get any reasonably good fit on the basis of the calculated values.
IV Conclusions
The electronic structure calculations of ordered approximants of the -FeV phase were done for border compositions of this phase, namely Fe20V10 and Fe12V18. The magnetic properties, i.e. total and atomic magnetic moments, as well as Fe and V hyperfine fields were calculated using two models for the magnetic moments alignment and compared to experimental values. It was found that both and are zero below , characteristic of each lattice site, and increase more or less linearly for higher -values. The calculated -values overestimate the experimental data when using the FM model, and underestimate them in the case of the APM one. This discrepancy was discussed in terms of the total energy difference as calculated for the FM and the APM models. The analysis of the calculated Fermi contact terms of Fe and V hyperfine fields showed a crucial role of valence contributions, being strongly dependent on local magnetic moments arrangements. The fact that only simple magnetic structures were accounted for the KKR calculations, did not allow to expect fully realistic determination of . The enhancement of the contribution which either lowers on Fe atoms and increases this quantity on V atoms, would eventually lead to a better agreement with the experimental data. In spite of the aforementioned discrepancies between experimental and calculated values, the almost linear dependences of , determined in -FeV phase for the FM and the APM models, remains in satisfying agreement with measured one.
Acknowledgements.
The results reported in this study were partly obtained within the project supported by the Ministry of Science and Higher Education, Warsaw (grant No. N N202 228837), by the European Communities under the contract of Association between EURATOM and IPPLM within the framework of the European Fusion Development Agreement as well as by the FP7-NMP-2010-LARGE-4 Collaborative Project ”AccMet” (No. 263206).References
- (1)
- (2) C. Frank and J. S. Kasper, Acta Cryst. 11, 184 (1958); ibid Acta Cryst. 12, 4831 (1959).
- (3) D. Parsons, Nature 185, 840 (1960).
- (4) E. D. Hall and S. H. Algie, Metall. Rev. 11, 61 (1966).
- (5) D. A. Read and E H. Thomas, IEEE Trans. Magn. MAG-2, 415 (1966).
- (6) D. A. Read, E H. Thomas and J. B. Forsyth, J. Phys. Chem. Solids 29, 1569 (1968).
- (7) J. Cieslak, M. Reissner, W. Steiner and S. M. Dubiel, J. Magn Magn. Mater. 272-276, 534 (2004).
- (8) J. Cieslak, M. Reissner, W. Steiner and S. M. Dubiel, Phys. Stat. Sol. 205, 1794 (2008).
- (9) J. Cieslak, B. F. O. Costa, S. M. Dubiel, M. Reissner and W. Steiner, J. Magn. Magn. Matter. 321, 2160 (2009).
- (10) J. Cieslak, J. Tobola, S. M. Dubiel and W. Sikora, Phys. Rev. B 82, 224407 (2010).
- (11) U. von Barth and L. Hedin, J. Phys. C: Solid State Phys. 5, 1629 (1972).
- (12) S. Blügel, H. Akai and R. Zeller, Phys. Rev. B 35, 3271 (1987).
- (13) O. Kubaschewski, Iron Binary Phase Diagrams by Springer, (Berlin 1982).
- (14) J. Cieslak, M. Reissner, S. M. Dubiel, J. Wernisch and W. Steiner, J. Alloys Comp. 460, 20 (2008).
- (15) J. Cieslak, J. Tobola, and S. M. Dubiel, Phys. Rev. B 81, 174203 (2010).
- (16) M. Shiga and Y. Nakamura, J. Phys. F: Metal Phys. 8, 177 (1978).
- (17) T. Ziller, G. Le Caër, O. Isnard, P. Cénéd ese and B. Fultz, Phys. Rev. B 65, 024204 (2001).
- (18) S. M. Dubiel, J. R. Tozoni, J. Cieslak, C. D. Braz, E. L. G. Vidoto and T. J. Bonagamba, Phys. Rev. B 81, 184407 (2010).
- (19) S. M. Dubiel, J. Alloys Comp. 488, 18 (2009).