Mapping the X-Shaped Milky Way Bulge
Abstract
We analyzed the distribution of the RC stars throughout Galactic bulge using 2MASS data. We mapped the position of the red clump in 1 sq. deg. size fields within the area and , for a total of 170 sq. deg. The red clump seen single in the central area splits into two components at high Galactic longitudes in both hemispheres, produced by two structures at different distances along the same line of sight. The X-shape is clearly visible in the – plane for longitudes close to axis. Crude measurements of the space densities of RC stars in the bright and faint RC populations are consistent with the adopted RC distances, providing further supporting evidence that the X-structure is real, and that there is approximate front-back symmetry in our bulge fields. We conclude that the Milky Way bulge has an X-shaped structure within , seen almost edge on with respect to the line of sight. Additional deep NIR photometry extending into the innermost bulge regions combined with spectroscopic data is needed in order to discriminate among the different possibilities that can cause the observed X-shaped structure.
1 Introduction
In the last decade consensus has been reached that the Galactic bulge has a boxy shape in the COBE/DIRBE near infrared map (Dwek et al., 1995) because it contains a bar. This bar is tilted by degrees from the Sun-Galactic center direction, with axis ratios 1 : 0.33 : 0.23, and a scale length of kpc (e.g., Stanek et al., 1994, 1997; Babusiaux & Gilmore, 2005; Rattenbury et al., 2007, and references therein). Most of these studies make use of horizontal branch red clump (RC) stars as tracers of the bulge 3D structure, due to their narrow range in color, brightness, and well calibrated absolute magnitude.
However, recent analysis of the RC stars across the bulge area suggested a more complex X-shaped structure (McWilliam et al., 2010; Zoccali, 2010; Nataf et al., 2010; McWilliam & Zoccali, 2010). Along to axis, both above and below the plane, the RC appears to split in two components. Both components become closer and finally merge at the latitude of Baade’s Window () and below, while they open up and diverge at higher latitudes both above and below the plane. The analysis by Nataf et al. (2011) is based on the RC distribution from the OGLE-II photometry, while McWilliam & Zoccali (2010) analyzed the color magnitude diagrams (CMDs) from 2MASS on a roughly symmetric field grid across the bulge. For the field at , in particular, McWilliam & Zoccali (2010) had deeper SOFI@NTT infrared photometry ( mag, in comparison to mag from 2MASS) as well as deep optical data from WFI@ESO/MPG telescope ( mag, mag).
Here we complete the analysis of the RC distribution across a much wider bulge area using 2MASS data. The RC was mapped at positive and negative latitudes in 170 fields of 1 sq. deg. size, within and . Our results are in agreement with previous studies, and extend their findings, showing the presence of an X-shaped structure across the whole Galactic bulge.
2 Observational Data
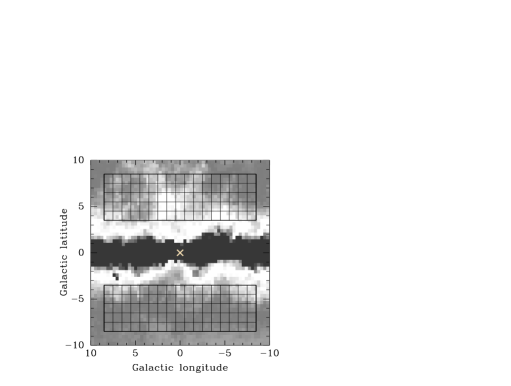
This analysis makes use of data from the Two Micron All Sky Survey (2MASS) point source catalog (Skrutskie et al., 2006) for the Galactic bulge region within coordinates and . In order to map the RC position across the bulge, the whole area was divided in square fields of size, centered on each integer Galactic coordinate, for a total of fields (see Fig. 1). Unfortunately, the incompleteness of 2MASS in the region close to the Galactic plane () becomes rather severe at the RC magnitude, so this region has been excluded from the present analysis.
As discussed by McWilliam & Zoccali (2010), the most plausible explanation for the double RC is the presence of two structures along the line of sight. We therefore mapped the position of the RC(s) across a large area, in order to deproject the bulge 3D structure. The procedure was the following:
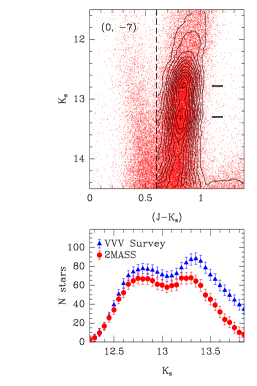
i ) A CMD was constructed for each of the 170 fields (Fig. 2) and a color cut applied, fine tuned for each CMD in order to separate the bulge red giants (RGB) from the main sequence of disk foreground stars. The luminosity function of bulge RGB stars was constructed in order to identify the RC(s).
ii ) Using the RC(s) as distance indicator, we assume that the two peaks seen at the bottom of Fig. 2 are due to the presence of two overdensities along the line of sight. In order to map the overdensities in 3D space, we associate a distance to each of the two peaks, and further assume that the width of each peak is entirely due to distance spread. This latter assumption lead us to overestimate the distance spread, because other effects can contribute to the RC width. The photometric errors at the magnitude of the RCs ( mag) produce uncertainties of kpc in the RC width, while the differential reddening should account for kpc. In addition, the RC has an intrinsic width due to the broad metallicity distribution, and a possible spread in age and helium content, both hard to quantify. The assumption of the width of the RC peaks being due only to distance allows us to directly convert the luminosity function into a density map along the line of sight, by assigning a distance to the magnitude of each star close to the RC. In this way, the position of the main structures in the map will be correct111The intrinsic width of the RC, combined with the fact that we did not subtract the underlying RGB luminosity function, could actually displace slightly the estimated position of the RC peak. However, this would be negligible compared to the effect of a small difference in age or helium content, and in any case none of these effects would change our conclusion about the global bulge shape., but their width along the line of sight will be overestimated. The distance associated to each RC star was calculated as:
| (1) |
where the absolute magnitude was taken from the horizontal branch in the isochrones of Pietrinferni et al. (2004) for solar metallicity, and taken from the maps of Schlegel et al. (1998). This makes the reasonable assumption that all the extinction happens between us and the bulge, with no dust being present between the two bulge RCs.
iii ) Distance histograms, corresponding to density maps along the line of sight, were constructed for RC stars in each of the 170 fields, using an averaged shifted histogram, for a bin width of kpc.
Figure 2 also shows the luminosity function of RC stars, in the same bulge field, from the Vista Variables in the Vía Láctea ESO Public Survey (VVV; Minniti et al. 2010). For this figure, the CASU v1.1 version of the catalog has been used222This is the catalog, produced by the Cambridge Astronomical Survey Unit (http://casu.ast.cam.ac.uk/), corresponding to the VVV data release, on June 2011.. In this field, the VVV survey reaches down to mag and the photometric error at the level of the RC is much smaller than in 2MASS. The presence of a double RC is fully confirmed by VVV data. The faint RC is stronger in the VVV data, due to incompleteness of 2MASS. In fact, the discrepancy between the two surveys increases at fainter magnitudes, due to confusion becoming stronger and stronger in 2MASS. The VVV survey data will allow us to map the bulge 3D structure down to the Galactic plane. Extensive analysis of the upper RGB and RC morphology across the bulge area covered by VVV is ongoing and will be the subject of a dedicated paper (Gonzalez et al. 2011, in preparation).
3 The X-Shaped Structure
In what follows we will discuss different sections of the bulge density maps constructed above.
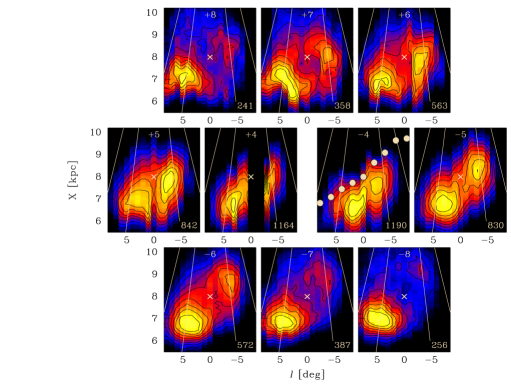
The panels in Figure 3 show sections of the density map roughly parallel to the Galactic plane, seen from above, each at a given Galactic latitude. The region within is excluded from the analysis, so the innermost sections are at and , in the middle row panels. A cross marks the Galactic Center, assuming a distance of 8 kpc (e.g., kpc; Ghez et al., 2008). The Sun would be at , below and outside the limits of the plots. The map in each panel is constructed merging 17 vertical color strips for the fully sampled sub-panels, each showing the RC star density along a given line of sight, at a given longitude (x-axis). Contour lines mark equal density levels, in steps of 5 from the peak intensity. The section at has a vertical, black strip due to a dust lane that prevents us to reach the RC in 2MASS, in this part. Due to the opening of the cone of view, we see nearby things more expanded in the sky, than far away ones. In order to show the distortion introduced by this effect, we also show diagonal thin white lines at constant linear coordinate.
The color scale has been normalized in each panel so that the peak density of that section is yellow. This stretching of the scale allows us to trace the shape of the bulge even far away from the plane, where stellar densities are much lower, but might give the wrong impression that the total number of bulge stars at is the same as it is at , which is clearly not the case. To clarify this, the peak value of the density histogram (corresponding to the lightest yellow) is listed at the bottom of each panel.
Two overdensities can be seen in each panel: one closer to the Sun, at positive Galactic longitudes, and a more distant one, at negative longitudes. Moving away from to larger longitudes, one of the two structures gradually disappear, leaving just the bright one at positive longitudes, and the faint one at negative longitudes. The two overdensities get closer to each other for sections closer to the Galactic plane, and they almost completely merge already at (Baade’s Window). This is the section that has been studied extensively in the past, and the structure that one sees here is consistent with a single, elongated overdensity, i.e., the bar. Clearly, only for lines of sight along to axis, i.e, in the central, vertical strip of each section, and only for we intercept both overdensities, resulting in a double RC.
Interestingly, in this map the far side of the X fades faster than the near side, when moving away from the Galactic plane. In the next section we will investigate whether this is a real feature or an artifact of our data analysis. Let us concentrate, here, on the 3D shape of the Galactic bulge in a qualitative way.
The panel at also shows the Galactic bar, as traced by Rattenbury et al. (2007) using OGLE II data for stars at a similar latitude. In the work of Rattenbury et al. the derived bar was arbitrarily shifted in distance so that its center would be at 8 kpc. The angle between the structure we find and the line of sight is clearly the same as that of the Rattebury’s bar. The center of structure, at , is kpc away from the Sun (see below).
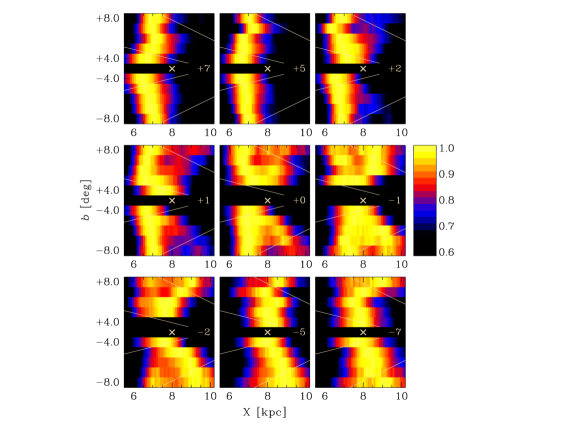
In Fig. 4, each panel shows a vertical section of the density map, parallel to axis, at a given longitude. The plane passing from is in the central, middle panel. The Sun would be at , outside each panel, on the left. Lines of sight at different latitudes are shown as horizontal color strips, in each panel. Again, the line of sight at is missing due to high extinction. Thin white lines in each panel are lines of constant height above/below the plane ( linear coordinate).
The color map has been normalized so that the peak density along each line of sight gets the maximum yellow intensity. Again, this allows us to trace the bulge shape even far away from the plane, but of course the density of bulge stars at and is not the same. Looking at , the bulge splits in two components both above and below the plane. However, when moving to sections at positive longitudes (top panels) only the one closer to the Sun is visible, while at negative longitudes (bottom panels) only the far one remains.
Although we do not have data in the region close to the plane, it is reasonable to assume that the elongated structures seen at would merge in the center, completing an X-shaped structure. If we make the exercise of joining the arms of the X above and below the plane, we find that the whole structure is approximately centered at a distance of kpc from the Sun, which is consistent with the most recent determination of the distance to the Galactic center. The latter was found to be kpc by Nishiyama et al. (2005), kpc by Ghez et al. (2008), and kpc by Gillessen et al. (2009). The accuracy of the distance from the Sun to the center of the X-shaped structure found here depends on how appropriate is the adopted value for the absolute magnitude of the bulge RC. Uncertainties on this parameter may come from the broad bulge metallicity distribution function, and the unknown precise age and helium content of the bulge. However, this is beyond the purpose of the present paper, which addresses the shape of the outer () Galactic bulge.
In closing this section let us comment on the effect of incompleteness. Incompleteness affects the present analysis in two ways. First, it artificially reduces the star density, especially in the faint RC (Fig. 2). For a qualitative analysis of the bulge shape such as the present one, this might not be a serious bias. Second, severe incompleteness produces a cutoff in the middle of the RC, so that the peak in the RC luminosity function looks brighter than it really is. Indeed, when fields at were tentatively included in the analysis, the map would show the bulk of bulge stars getting closer and closer to the Sun, for lower and lower . This effect was not trusted as real, and this is where our decision to exclude fields at comes from. Even for high , however, the extinction is highly variable on a field to field basis, and so it is the 2MASS degree of incompleteness. The wiggles of the arms of the in Fig. 4 (see, e.g., the map at positive latitudes, for ) might in fact be due to differential extinction and thus incompleteness.
4 Relative density of the bright and faint RC populations
Here we investigate the density of RC stars in the faint and bright RCs. The RC densities not only reveal the structure and symmetry of the X-shaped bulge, but also provide a consistency check to address any lingering doubts that the brightness difference between the two RCs might be due to something other than distance.
We measured the density of RC stars as a function of vertical height below the Galactic plane, at longitude for the bright red clump, and at for the faint red clump; at these latitudes the bright and faint RCs, respectively, are maximum (see McWilliam & Zoccali, 2010). The RC densities were measured from 30 arc-minute radius circular 2MASS fields, in frequency histograms similar to McWilliam & Zoccali (2010) and included a linear interpolation to remove the background counts. Background subtraction would be significantly improved with the use of isochrone fitting techniques, but this is beyond the scope of the current paper. To compute the space densities of the RC stars from the number counts it was necessary to assume distances for the bright and faint RC populations; we adopted 6.4 and 9.0 kpc distances for these populations, respectively (see McWilliam & Zoccali 2010).
The vertical extent of our density fields ranges from to in latitude, and generally corresponds to vertical distances, , from 1.0 to 1.4 kpc. All projection effect have been taking into account when computing the stellar surface densities for the bright and faint RC populations.
Our results for the two regions are plotted in Fig. 5, which shows that the faint and bright RCs possess similar declining trends in space density with distance below the Galactic plane. However, if one considers only the angular extent below the plane (i.e., latitude), it is clear that the faint RC density declines much more rapidly with angle than the bright RC. For example, Fig. 5 shows that at the faint RC has almost vanished, but there are large numbers of RC stars in the bright RC at this latitude.
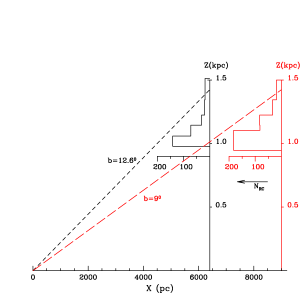
Put in another way: with the assumption of approximate foreground-background symmetry of the bulge, the trend of RC density with latitude is consistent with a distance interpretation for the bright and faint red clump populations. Given the extensive discussion of distance interpretation in McWilliam & Zoccali (2010), and the consistency check discussed here, we conclude that the RC brightness differences must, indeed, be due to distance. Therefore, the foreground and background bulge RC densities possess approximate symmetry. In detail, however, our measured densities are slightly higher for the faint RC field. We believe that this difference is probably real, but could be due to errors in our analysis, such as poor background subtraction, or in the precise distances adopted for the two RCs. Clearly, this small density asymmetry should be investigated further.
5 Discussion and Conclusions
The position of the RC(s) was mapped across a large bulge area, using 2MASS photometry. By using the RC(s) magnitude as distance indicator, density maps were constructed along the line of sight, for the region and .
The main conclusion of the present paper is that in the Milky Way bulge has an X-shape, seen almost edge on, with an inclination of with respect to the line of sight. The X is clearly seen within , with the closer arm remaining at positive latitudes while at negative latitudes only the farther arm is present. The arms of the X merge together both above and below the plane, for latitudes . Therefore, in Baade’s Window at one would just see an elongated structure, corresponding to the two lower arms being almost completely merged. This feature has been classically interpreted as the Galactic bar.
Our crude measurement of the space densities of RC stars as a function of vertical height below the Galactic plane is consistent with the adopted RC star distances, if the bulge structures studied here are roughly symmetric from front to back. This removes any lingering doubt about the interpretation of the RC -band magnitudes as due to distance, and strengthens the conclusion that the bulge contains an X-shape structure. Our densities are slightly higher for the background structure; this possibility should be investigated with more sophisticated techniques.
Several galaxies are known to host X-shaped bulges (e.g., NGC 128, NGC 3625, NGC 4469), and some numerical simulations predict their formation, with a particularly strong buckling of a bar (Patsis et al., 2002; Athanassoula, 2005; Mihos et al., 1995). McWilliam & Zoccali (2010) review some of the proposed mechanisms to form such structures.
The X-shape structure seems to be relatively concentrated, with respect to other galaxies (e.g., NGC 4710) and probably is the dominant component in the inner 2 kpc. It remains to be understood how the bulge 3D structure can be reconciled with the other features, such as the presence of a radial metallicity gradient (Zoccali et al., 2008; Brown et al., 2010), the kinematic difference between the metal poor and metal rich component in Baade’s Window (Babusiaux et al., 2010) and the behavior of the alpha element ratios, which seems to be constant in different fields (Gonzalez et al. 2011). It should be kept in mind, however, that all the properties listed above have been derived from observations on only. Just as the shape turned out to be much more complex as soon as we analyzed a larger area, the other properties might turn out to be a partial view of the global picture.
Radial velocities of stars in the two RCs, at revealed no differences (De Propris et al., 2011). However a similar analysis at reveals the presence of two peaks at km s-1 in the faint/bright RC, respectively (Vasquez et al. 2011, in preparation). Proper motions also do not seem to differ between stars in the two clumps (Vieira et al., 2007).
Further investigations are clearly necessary to completely understand our bulge structure, kinematics, chemistry and, ultimately, origin. The present mapping traces the X-shaped structure across the whole bulge area and may help to guide further analysis, as well as to design future observations of the Milky Way bulge.
References
- Athanassoula (2005) Athanassoula, E. 2005, MNRAS, 358, 1477
- Babusiaux & Gilmore (2005) Babusiaux, C., & Gilmore, G. 2005, MNRAS, 358, 1309
- Babusiaux et al. (2010) Babusiaux, C., et al. 2010, A&A, 519, A77
- Brown et al. (2010) Brown, T. M., et al. 2010, ApJ, 725, L19
- De Propris et al. (2011) De Propris, R., et al. 2011, arXiv:1104.0223
- Dwek et al. (1995) Dwek, E., et al. 1995, ApJ, 445, 716
- Ghez et al. (2008) Ghez, A. M., et al. 2008, ApJ, 689, 1044
- Gillessen et al. (2009) Gillessen, S., Eisenhauer, F., Trippe, S., Alexander, T., Genzel, R., Martins, F., & Ott, T. 2009, ApJ, 692, 1075
- McWilliam et al. (2010) McWilliam, A., Fulbright, J., Rich, R.M. 2010, IAU Symposium, 265, 279
- McWilliam & Zoccali (2010) McWilliam, A., & Zoccali, M. 2010, ApJ, 724, 1491
- Mihos et al. (1995) Mihos, J. C., Walker, I. R., Hernquist, L., Mendes de Oliveira, C., & Bolte, M. 1995, ApJ, 447, L87
- Minniti et al. (2010) Minniti, D., et al. 2010, New A, 15, 433
- Nataf et al. (2010) Nataf, D. M., Udalski, A., Gould, A., Fouqué, P., & Stanek, K. Z. 2010, ApJ, 721, L28
- Nataf et al. (2011) Nataf, D. M., Udalski, A., Gould, A., & Pinsonneault, M. H. 2011, ApJ, 730, 118
- Nishiyama et al. (2005) Nishiyama, S., et al. 2005, ApJ, 621, L105
- Patsis et al. (2002) Patsis, P. A., Skokos, C., & Athanassoula, E. 2002, MNRAS, 337, 578
- Pietrinferni et al. (2004) Pietrinferni, A., Cassisi, S., Salaris, M., & Castelli, F. 2004, ApJ, 612, 168
- Rattenbury et al. (2007) Rattenbury, N. J., Mao, S., Sumi, T., & Smith, M. C. 2007, MNRAS, 378, 1064
- Schlegel et al. (1998) Schlegel, D. J., Finkbeiner, D. P., & Davis, M. 1998, ApJ, 500, 525
- Skrutskie et al. (2006) Skrutskie, M. F., et al. 2006, AJ, 131, 1163
- Stanek et al. (1994) Stanek, K. Z., Mateo, M., Udalski, A., Szymanski, M., Kaluzny, J., & Kubiak, M. 1994, ApJ, 429, L73
- Stanek et al. (1997) Stanek, K. Z., Udalski, A., Szymanski, M., Kaluzny, J., Kubiak, M., Mateo, M., & Krzeminski, W. 1997, ApJ, 477, 163
- Vieira et al. (2007) Vieira, K., Casetti-Dinescu, D.I., Ménendez, R.A., Rich, R.M., Girard, R.M. et al. 2007, AJ, 134, 1432
- Zoccali et al. (2008) Zoccali, M., Hill, V., Lecureur, A., Barbuy, B., Renzini, A., Minniti, D., Gómez, A., & Ortolani, S. 2008, A&A, 486, 177
- Zoccali (2010) Zoccali, M. 2010, IAU Symposium, 265, 271