Ordering in bidirectional pedestrian flows and its influence on the fundamental diagram
Abstract
Experiments under laboratory conditions were carried out to study the ordering in bidirectional pedestrian streams and its influence on the fundamental diagram (density-speed-flow relation). The Voronoi method is used to resolve the fine structure of the resulting velocity-density relations and spatial dependence of the measurements. The data show that the specific flow concept is applicable also for bidirectional streams. For various forms of ordering in bidirectional streams, no large differences among density-flow relationships are found in the observed density range. The fundamental diagrams of bidirectional streams with different forms of ordering are compared with that of unidirectional streams. The result shows differences in the shape of the relation for m-2. The maximum of the specific flow in unidirectional streams is significantly larger than that in all bidirectional streams examined.
1 Introduction
In the last few decades, problems related to bidirectional flow and its effects on pedestrian dynamics have gained increasing attention. A large number of models [1, 2, 3, 4, 5, 6] have been developed to understand the basic characteristics related to bidirectional flow including lane formation [5, 7, Hoogendoorn2004], jamming transition [2, 6, 9, 10] and fundamental diagram [11]. Computer simulations of various models have found a jamming transition from a free flow state to a jammed state. However, this phenomenon has never been observed in experimental as well as field studies.
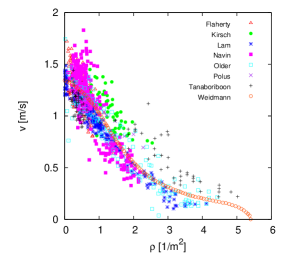
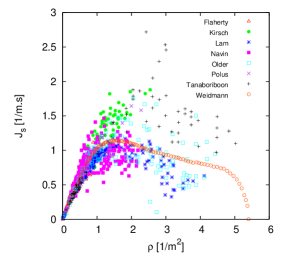
Furthermore, a large number of empirical studies have been conducted to investigate the characteristics of bidirectional flow. Pedestrian flow characteristics at crosswalks [12, 13, 14, 15, 16] and shopping streets [17] were studied in different countries. Some of the studies compare mean walking speed and maximum flow rate among different regions. The influence of facility width on the pedestrian characteristics is studied in [15, 17]. FIG. 1 assembles the fundamental diagrams of bidirectional flow from these empirical studies. From the density-velocity relationship in FIG. 1(a) it can be seen that they follow nearly the same trend. Further, we compare the relationship between density and specific flow , as shown in FIG. 1(b), using the hydrodynamic relation . In this graph, differences can be observed especially for densities m-2. The density values where the specific flow reach the maximum range from about m-2 to m-2. Also the maximum specific flows from different studies range from about ms to ms. But from these studies no conclusion could be drawn at which density the flow reaches zero due to congestion.
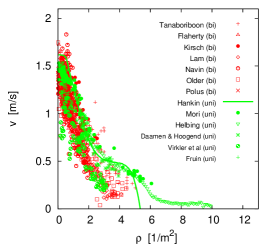
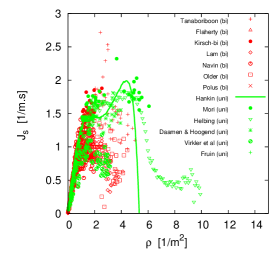
On the other hand, there is still no consensus whether the fundamental diagrams of uni- and multi-directional flows are different or not. Predtechenskii and Milinksii [19] and Weidmann [18] neglected the differences in accordance with Fruin, who states that the fundamental diagrams of multi- and uni-directional flow differ only slightly [20]. This disagrees with results of Navin and Wheeler [16] who found a reduction of the flow in dependence of directional imbalances. Further, Pushkarev et al. [21] and Lam et al. [12, 22] assume that bidirectional flow is not substantially different from unidirectional flow as long as the densities of the opposite streams are not too different. However, Older et al. state that different ratios of flow in bidirectional stream do not show any consistent effect on the walking speed [17]. Besides, Helbing et al. [23] concluded that counterflows are significantly more efficient than unidirectional flows. However, they compare average flow values without considering the influence of the density. Kretz et al. [7] have reported similar findings, but the influence of density and variations in time on the flow are not considered in this study. Facing these disagreements, we collect the fundamental diagrams of unidirectional [24, 25, 26, 27] and bidirectional flow in FIG. 2. It seems that the fundamental diagrams of unidirectional flow lie above those of bidirectional flow, especially for m-2. Since the data compared are obtained under different experimental situations and different measurement methods, thus we could not conclude whether and how the type of flow (uni- or bidirectional) influences the fundamental diagram.
The above discussion shows that up to now there is no consensus about the origin of the discrepancies between different types of pedestrian flow. In our study, we carry out a series of laboratory experiments of bidirectional and unidirectional pedestrian streams. The formation of lanes in bidirectional streams depend on time as well as space and could be stable or unstable. Moreover the opposing flows in bidirectional streams could be balanced or unbalanced. To categorize these types, we classify the bidirectional streams into Stable Separated Lanes (SSL) and Dynamical Multi-Lanes (DML) flow. According to the typical densities in the opposing streams we introduce the types Balanced Flow Ratio (BFR) and Unbalanced Flow Ratio (UFR). The aim of our study is to obtain the fundamental diagrams and calibrate the previous research results. We will study the effects of different corridor widths and different flow types on the fundamental diagrams of bidirectional streams. We also compare the fundamental diagram of unidirectional and bidirectional streams.
The structure of the paper is as follows. In Section 2 we describe the setup of experiment. The identification of lanes is studied by means of the Voronoi diagram in Section 3. Section 4 compares the fundamental diagrams for different stream types. Finally, the conclusions from our investigations will be discussed.
2 Experiment Setup
The experiments were performed in hall 2 of the fairground Düsseldorf (Germany) in May 2009. Up to 350 participants, mostly students, participated in the experiments. Each of them was paid 50 € per day. The mean age and height of the participants was years and m respectively. The average free velocity m/s was obtained by measuring the free movement of 42 participants.
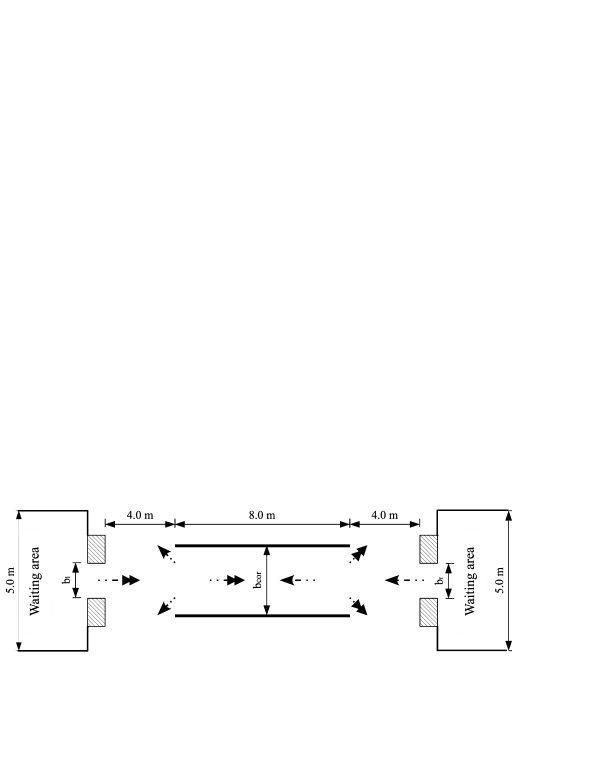
FIG. 3 shows a sketch of the experimental setup. 22 runs of bidirectional pedestrian streams (see TABLE. 1–3) were performed in straight corridors with widths of 3.0 m and 3.6 m, respectively. To control the density inside the corridor and the ratio of the opposing streams, the width of the left entrance and of the right entrance were changed in each run (for details, see FIG. 3 and TABLE. 1–3). Before the start of an experiment, the participants were arranged within the waiting area at the left and right side of the corridor. At the beginning of each run, the pedestrian pass through a 4 m passage into the corridor. The passage was used as a buffer to minimize the effect of the entrance. In this way, the flow in the corridor was nearly homogeneous over the entire width of the corridor. When a pedestrian arrived at the other side of the corridor, he or she left the corridor from the passage and returned to the waiting area for the next run. To vary the form of the ordering the test persons get different instructions and the width of entrances is changed. These variations result in different types of bidirectional flow:
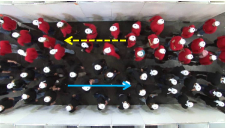
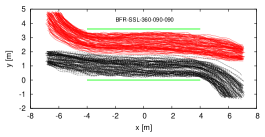
BFR-SSL flow (FIG. 4(a)): This type of flow was realized in our experiments by using the same entrance width for both directions ( = ) and giving no instruction to the test persons about which exit they have to choose. The opposing flows segregate and occupy proportional shares of the corridor. Stable lanes formed autonomously and immediately after the run starts.
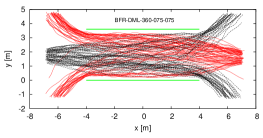
BFR-DML flow (FIG. 4(b)): Again identical widths and are chosen in the experiments, but the instruction to the test person at the beginning of the experiments changed. The participants were asked to choose an exit at the end of the corridor according to a number given to them in advance (odd numbers exit to the left, even numbers to the right). With this initial condition again lane formation is observable, but the lanes are unstable and vary in time and space. This type of flow is comparable with two stream crossing at a small angle.
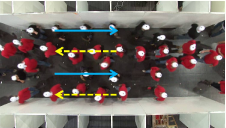
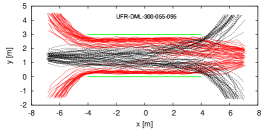
UFR-DML flow (FIG. 4(c)): In this case the widths of entrances and are different and the participants are instructed to choose an exit at the end of the corridor according to a number given at the beginning of the day (odd numbers left, even numbers to the right). Again lanes are unstable and vary in time and space. The cumulated trajectories indicate that the flow ratio of the opposing streams is unbalanced.
The experiments were recorded by two cameras mounted on a rack at the ceiling of the hall. To cover the complete region, the left and the right part of the corridor were recorded separately. The trajectories were automatically extracted from video recordings using the software PeTrack [28]. Finally, the trajectories from the two cameras were corrected and combined. All the analysis and the pedestrian characteristics below including flow, density and velocity are obtained from these trajectories.

3 Lane formation
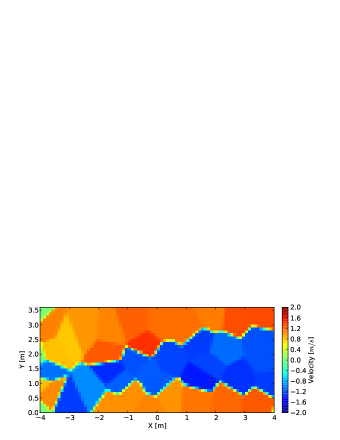
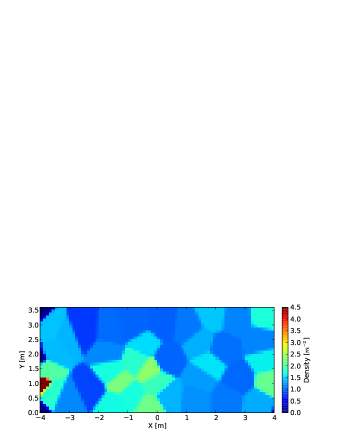
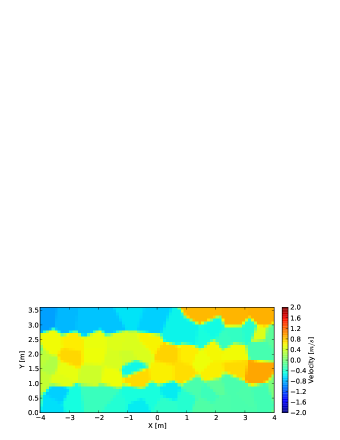
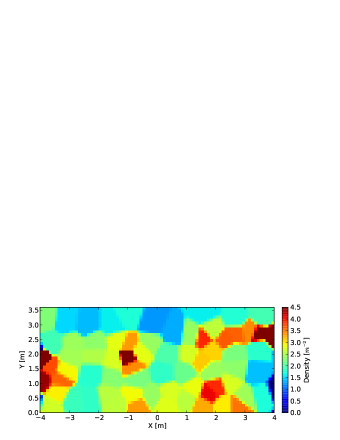
Lane formation, as an important phenomenon in bidirectional flow, occurs because pedestrians follow closely behind some other person who moves in the same direction to minimize conflicts with persons moving in the opposite direction. Lanes that emerge in this way could be stable (SSL) and unstable (DML). The recognition and representation of the lanes has been investigated in different ways, e.g. the cluster analysis method introduced by Hoogendoorn [Hoogendoorn2004], the bond index method of Yamori [29] et al. as well as the laning order parameter used to detect lanes in driven colloidal systems [30]. In this study, using the Voronoi method introduced in [31, 32], we are able to calculate the integrated velocity over small (cm) measurement regions. In this way, the velocity distribution over the whole space can be easily obtained. FIG. 5 shows the velocity and density profiles of BFR-DML-360-160-160 for two different times. We use different colors to present the value of the velocity and density. Then the number of lanes in the corridor can be easily determined from the velocity profiles. The velocity profiles seem to be a good way to display the lane formation in bidirectional streams. In comparison, density profiles don’t have such ability to show the lanes clearly. However, it is possible for density profiles to show some other information such as crowded and dangerous spots.
4 Fundamental diagram
In this study we use the Voronoi method [31, 32] to analyze the flows quantitatively. We have verified that alternative methods (see the discussion in [31]) do not lead to large changes in the fundamental diagrams. The advantage of the Voronoi method lies in its small scatter and high resolution in time and space.
For the analysis a rectangle with a length of m from m to m and the width of the corridor is chosen as the measurement area. We calculate the densities and velocities every frame (corresponding to s) with a frame rate of 16 fps. To determine the fundamental diagram only data from stationary flows are used which are selected manually by analyzing the time series of density and velocity. Finally, we use one frame per second to limit the number of data points. The influences of corridor width and the type of flow on the fundamental diagram are studied and compared with the diagram of unidirectional flow.
4.1 Influence of corridor width
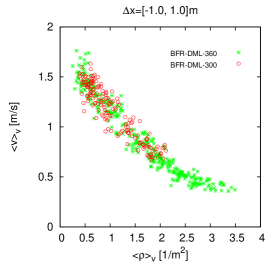
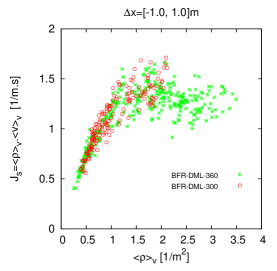
Firstly, we study the influence of the corridor width on the fundamental diagram. For BFR-DML flow, two widths m and m are chosen in the experiments and the fundamental diagrams are compared. Due to the limitation of the time resources for the experiment only densities m-2 are realized for m. As shown in FIG. 6, the fundamental diagrams are in good agreement for different widths. FIG. 6(b) shows the relationship between the Voronoi density and specific flow for these two widths. The specific flow reaches its maximum of (ms)-1 at a density of m-2.
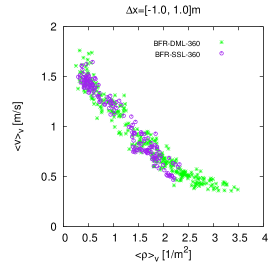
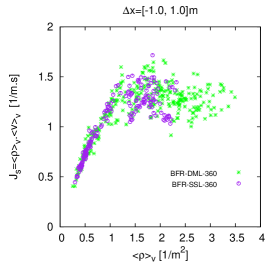
4.2 Comparison of SSL and DML flow
In bidirectional pedestrian flow, especially for DML type, head-on conflicts and cross-directional conflicts occur. To investigate their influence on the flow we compare in FIG. 7 the fundamental diagram of SSL and DML flow for m. It can be seen that the fundamental diagrams of these two types of bidirectional flow are consistent at least for the density m-2. The lower degree of ordering in dynamical multi-lanes (DML) has no effect on the fundamental diagram which agrees with the findings of Older [17]. This might be taken as an indication that head-on conflicts in multi-lanes have the same influence as the conflicts at the borders in stable separated lane flow on the fundamental diagram. On the other hand, the self-organized lanes increase the order and make pedestrian movement smoother. Whether the degree of ordering has an influence on the fundamental diagram at higher densities can not be decided from our data. In particular it would be interesting to find out whether the density where the velocity and specific flow becomes zero depends on the degree of order.
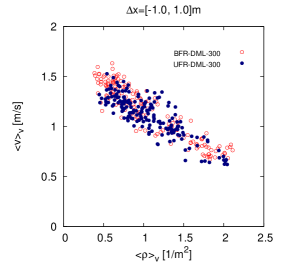
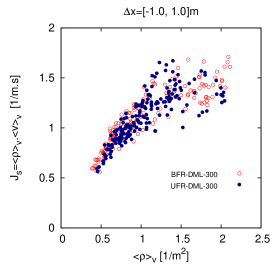
4.3 Comparison of BFR and UFR flow
The flow ratio of the opposing pedestrian streams is another important factor that is worth studying. Under unbalanced conditions, pedestrians from the direction with high flow ratio may dominate and restrain the movement of pedestrians from the opposing direction. We compare the fundamental diagrams of BFR and UFR flow to study the influence of the ratio of opposing flows, as shown in FIG. 8. This comparison is performed for m of DML flow. Due to the limitation of the number of runs, only data for m-2 have been obtained. It can be seen that the asymmetry in the flows does not affect the fundamental diagrams, at least for DML flows and densities m-2.
4.4 Comparison between uni- and bidirectional flows
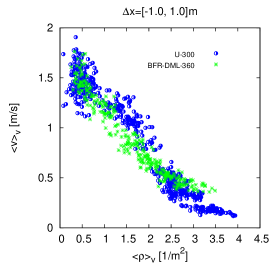
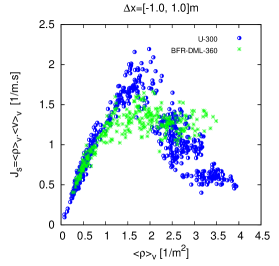
In this section we compare the fundamental diagram of uni- and bidirectional flows, see FIG. 9. Since both the width of corridor and the forms of bidirectional flow have small influence on the fundamental diagram, the data for unidirectional flow (U-300) in [31] at m are used to compare with the fundamental diagram of BFR-DML flow at m. These experiments were carried out at the same day with the same participants. It is worth noting that the data of the unidirectional flow for m-2 are obtained by slide change of the experiment setup. To reach densities m-2 for unidirectional experiment, a bottleneck at the end of the corridor is introduced. We discussed in [31] that the decrease of the flow is induced by changing the boundary conditions. This limits the comparability of fundamental diagrams for m-2.
FIG. 9(a) shows the relationship between density and velocity for these two kinds of flow. For the free flow state at densities m-2 no significant difference exists. For m-2, however, the velocities for unidirectional flow are larger than that of bidirectional streams. The difference between the two cases becomes more pronounced in the flow-density diagram where a qualitative difference can be observed. In the bidirectional case a plateau is formed starting at a density m-2 where the flow becomes almost independent of the density. Such plateaus are typical for systems which contain ’defects’ which limit the flow [33] and have been observed e.g. on bidirectional ant trails [34] where they are a consequence of the interaction of the ants. In our experiments the defects are persons moving in the opposite direction which leads to conflicts and a reduction of the velocity.
The observed difference in the fundamental diagrams implies that SSL flow should not be interpreted as two unidirectional flows. Although the self-organized lanes can decrease the head-on conflicts, interactions between the opposing streams are still relevant.
5 Conclusion
Series of well-controlled laboratory pedestrian experiments of bidirectional flow were performed in straight corridors. Up to 350 persons participated and the whole processes of the experiment were recorded using two video cameras. The trajectories of each pedestrian are extracted with high accuracy from the video recordings automatically using PeTrack. After comparing the fundamental diagrams from the four measurement methods introduced in [31], we don’t find large difference among these results and adopt the Voronoi method in this study for its small fluctuation and high resolution in time and space. For different degree of ordering in bidirectional pedestrian streams (DML, SSL, BFR and UFR), no significant differences are found in the fundamental diagrams for densities below m-2. Due to the limitation of the number of runs, the fundamental diagrams for different types of bidirectional flow are mainly compared for densities m-2. Whether a jamming transition, which is due to overcrowding and lead to a total breakdown of flow, occurs in case the degree of ordering is lower. This needs to be studied by further experiments. The fundamental diagrams of bidirectional flow and unidirectional flow shows clear differences. The maximum flow value is about (ms)-1 for unidirectional flow while (ms)-1 for bidirectional flow. The self-organized lanes can help to relief the head-on conflicts effectively and increase the ordering of the stream. However, these conflicts do have influence on the fundamental diagram of bidirectional flow. It is also demonstrated that the lanes could be determined easily by measuring the velocity profile of bidirectional stream using the Voronoi method.
| Index | Name | bcor [] | bl [] | br [] | Nl | Nr |
|---|---|---|---|---|---|---|
| 1 | BFR-SSL-360-050-050 | 3.60 | 0.50 | 0.50 | 57 | 61 |
| 2 | BFR-SSL-360-075-075 | 3.60 | 0.75 | 0.75 | 56 | 80 |
| 3 | BFR-SSL-360-090-090 | 3.60 | 0.90 | 0.90 | 109 | 105 |
| 4 | BFR-SSL-360-120-120 | 3.60 | 1.20 | 1.20 | 143 | 164 |
| 5 | BFR-SSL-360-160-160 | 3.60 | 1.60 | 1.60 | 143 | 166 |
| Index | Name | bcor [] | bl [] | br [] | Nl | Nr |
|---|---|---|---|---|---|---|
| 1 | BFR-DML-300-050-050 | 3.00 | 0.50 | 0.50 | 54 | 71 |
| 2 | BFR-DML-300-065-065 | 3.00 | 0.65 | 0.65 | 64 | 83 |
| 3 | BFR-DML-300-075-075 | 3.00 | 0.75 | 0.75 | 61 | 86 |
| 4 | BFR-DML-300-085-085 | 3.00 | 0.85 | 0.85 | 119 | 97 |
| 5 | BFR-DML-300-100-100 | 3.00 | 1.00 | 1.00 | 125 | 105 |
| 6 | BFR-DML-360-050-050 | 3.60 | 0.50 | 0.50 | 56 | 74 |
| 7 | BFR-DML-360-075-075 | 3.60 | 0.75 | 0.75 | 62 | 65 |
| 8 | BFR-DML-360-090-090 | 3.60 | 0.90 | 0.90 | 110 | 102 |
| 9 | BFR-DML-360-120-120 | 3.60 | 1.20 | 1.20 | 115 | 106 |
| 10 | BFR-DML-360-160-160 | 3.60 | 1.60 | 1.60 | 140 | 166 |
| 11 | BFR-DML-360-200-200 | 3.60 | 2.00 | 2.00 | 143 | 166 |
| 12 | BFR-DML-360-250-250 | 3.60 | 2.50 | 2.50 | 141 | 163 |
| Index | Name | bcor [] | bl [] | br [] | Nl | Nr |
|---|---|---|---|---|---|---|
| 1 | UFR-DML-300-050-070 | 3.00 | 0.50 | 0.70 | 72 | 63 |
| 2 | UFR-DML-300-050-085 | 3.00 | 0.50 | 0.85 | 61 | 64 |
| 3 | UFR-DML-300-055-095 | 3.00 | 0.55 | 0.95 | 58 | 70 |
| 4 | UFR-DML-300-065-105 | 3.00 | 0.65 | 1.05 | 117 | 112 |
| 5 | UFR-DML-300-080-120 | 3.00 | 0.80 | 1.20 | 116 | 103 |
References
- [1] Y. Jiang, T. Xiong, S. C. Wong, C.-W. Shu, M. Zhang, P. Zhang, and W. H. K. Lam, “A reactive dynamic continuum user equilibrium model for bi-directional pedestrian flows,” Acta Mathematica Scientia (Series B), vol. 29, no. 6, pp. 1541–1555, 2009
- [2] T. Nagatani, “Freezing transition in bi-directional CA model for facing pedestrian traffic,” Physics Letters A, vol. 373, no. 33, pp. 2917–2921, 2009
- [3] C. Burstedde, K. Klauck, A. Schadschneider, and J. Zittartz, “Simulation of pedestrian dynamics using a two-dimensional cellular automaton,” Physica A, vol. 295, pp. 507–525, 2001
- [4] H. Kuang, X. Li, T. Song, and S. Dai, “Analysis of pedestrian dynamics in counter flow via an extended lattice gas model,” Physical Review E, vol. 78, p. 066117, 2008
- [5] M. Jian, S. Weiguo, Z. Jun, L. Siuming, and L. Guangxuan, “k-Nearest-Neighbor interaction induced self-organized pedestrian counter flow,” Physica A: Statistical Mechanics and its Applications, vol. 389, no. 10, pp. 2101–2117, 2010
- [6] K. Takimoto, Y. Tajima, and T. Nagatani, “Effect of partition line on jamming transition in pedestrian counter flow,” Physica A, vol. 308, pp. 460–470, 2002
- [7] T. Kretz, A. Grünebohm, M. Kaufman, F. Mazur, and M. Schreckenberg, “Experimental study of pedestrian counterflow in a corridor,” J. Stat. Mech., vol. 10, p. P10001, 2006
- [8] S. P. Hoogendoorn and W. Daamen, ”Self-organization in pedestrian flow”, Traffic and Granular Flow ’03 (Berlin: Springer) pp 373-382, , 2005
- [9] K. Hua, S. Tao, L. Xing-Li, and D. Shi-Qiang, “Subconscious Effect on Pedestrian Counter Flow,” Chinese Physics Letter, vol. 25, no. 4, pp. 1498–1501, 2008
- [10] Y. Tajima, K. Takimoto, and T. Nagatani, “Pattern formation and jamming transition in pedestrian counter flow,” Physica A, vol. 313, pp. 709–723, 2002
- [11] V. J. Blue and J. L. Adler, “Cellular automata microsimulation for modeling bidirectional pedestrian walkways,” Transportation Research Part B, vol. 35, pp. 293–312, 2001
- [12] W. H. K. Lam, J. Y. S. Lee, and C. Y. Cheung, “A study of the bi-directional pedestrian flow characteristics at Hong Kong signalized crosswalk facilities,” Transportation, vol. 29, pp. 169–192, 2002
- [13] A. Polus, J. L. Schofer, and A. Ushpiz, “Pedestrian Flow and Level of Service,” Journal of Transportation Engineering, vol. 109 1, pp. 46–56, 1983
- [14] C. A. O’Flaherty and M. H. Parkinson, “Movement on a city centre footway,” Traffic Engineering and Control, vol. 13, pp. 434–438, 1972
- [15] Y. Tanaboriboon, S. S. Hwa, and C. H. Chor, “Pedestrian Characteristics Study in Singapore,” Journal of Transportation Engineering, vol. 112, pp. 229–235, 1986
- [16] F. D. Navin and R. J. Wheeler, “Pedestrian flow characteristics,” Traffic Engineering, vol. 39, pp. 31–36, 1969
- [17] S. Older, “Movement of Pedestrians on Footways in Shopping Streets,” Traffic Engineering and Control, vol. 10, pp. 160–163, 1968
- [18] U. Weidmann, “Transporttechnik der Fussgänger, ETH-Z rich, Schriftenreihe des Institut f r Verkehrsplanung 90,Transporttechnik, Strassen-und Eisenbahnbau, Zürich (In German), 1993
- [19] V. M. Predtechenskii and A. I. Milinskii, Planning for Foot Traffic Flow in Buildings. Amerind Publishing, New Dehli, 1978, translation of: Proekttirovanie Zhdanii s Uchetom Organizatsii Dvizheniya Lyuddskikh Potokov, Stroiizdat Publishers, Moscow, 1969
- [20] J. J. Fruin, Pedestrian Planning and Design. Elevator World, New York, 1971
- [21] B. Pushkarev and J. M. Zupan, “Capacity of Walkways,” Transportation Research Record, vol. 538, pp. 1–15, 1975
- [22] W. H. K. Lam, J. Y. S. Lee, K. S. Chan, and P. K. Goh, “A generalised function for modeling bi-directional flow effects on indoor walkways in Hong Kong,” Transportation Research Part A: Policy and Practice, vol. 37, pp. 789–810, 2003
- [23] D. Helbing, L. Buzna, A. Johansson, and T. Werner, “Self-Organized Pedestrian Crowd Dynamics: Experiments, Simulations, and Design Solutions,” Transportation Science, vol. 39, pp. 1–24, 2005
- [24] B. D. Hankin and R. A. Wright, “Passenger Flow in Subways,” Operational Research Quarterly, vol. 9, pp. 81–88, 1958
- [25] M. Mori and H. Tsukaguchi, “A new method for evaluation of level of service in pedestrian facilities,” Transp. Res., vol. 21A, no. 3, pp. 223–234, 1987
- [26] M. R. Virkler and S. Elayadath, “Pedestrian Speed-Flow-Density Relationships,” Transportation Research Record, vol. 1438, pp. 51–58, 1994
- [27] D. Helbing, A. Johansson, and H. Z. Al-Abideen, “Dynamics of Crowd Disasters: An Empirical Study,” Physical Review E, vol. 75, p. 046109, 2007
- [28] M. Boltes, A. Seyfried, B. Steffen, and A. Schadschneider, “Automatic Extraction of Pedestrian Trajectories from Video Recordings,” in Pedestrian and Evacuation Dynamics 2008, W. W. F. Klingsch, C. Rogsch, A. Schadschneider, and M. Schreckenberg, Eds. Springer-Verlag Berlin Heidelberg, 2010, pp. 43–54
- [29] K. Yamori, “Going with the Flow: Micro-Macro Dynamics in the Macrobehavioral Patterns of Pedestrian Crowds,” Psychological Review, vol. 105, no. 3, pp. 530–557, 1998
- [30] M. Rex and H. Löwen, “Lane formation in oppositely charged colloids driven by an electric field: Chaining and two-dimensional crystallization,” Phys. Rev. E, vol. 75, p. 051402, 2007
- [31] J. Zhang, W. Klingsch, A. Schadschneider, and A. Seyfried, “Transitions in pedestrian fundamental diagrams of straight corridors and T-junctions,” Journal of Statistical Mechanics: Theory and Experiment, vol. P06004, 2011
- [32] B. Steffen and A. Seyfried, “Methods for measuring pedestrian density, flow, speed and direction with minimal scatter,” Physica A, vol. 389, no. 9, pp. 1902–1910, 2010
- [33] S.A. Janowsky and J.L. Lebowitz, “Finite-size effects and shock fluctuations in the asymmetric simple-exclusion process,” Phys.Rev. A, vol. 45, pp. 618–625, 1992
- [34] A. John, A. Schadschneider, D. Chowdhury, and K. Nishinari, “Collective effects in traffic on bi-directional ant trails,” J. Theor. Biol., vol. 231, pp. 279, 2004