Fast and Scalable Analysis of Massive Social Graphs
Abstract
Graph analysis is a critical component of applications such as online social networks, protein interactions in biological networks, and Internet traffic analysis. The arrival of massive graphs with hundreds of millions of nodes, e.g. social graphs, presents a unique challenge to graph analysis applications. Most of these applications rely on computing distances between node pairs, which for large graphs can take minutes to compute using traditional algorithms such as breadth-first-search (BFS).
In this paper, we study ways to enable scalable graph processing on today’s massive graphs. We explore the design space of graph coordinate systems, a new approach that accurately approximates node distances in constant time by embedding graphs into coordinate spaces. We show that a hyperbolic embedding produces relatively low distortion error, and propose Rigel, a hyperbolic graph coordinate system that lends itself to efficient parallelization across a compute cluster. Rigel produces significantly more accurate results than prior systems, and is naturally parallelizable across compute clusters, allowing it to provide accurate results for graphs up to 43 million nodes. Finally, we show that Rigel’s functionality can be easily extended to locate (near-) shortest paths between node pairs. After a one-time preprocessing cost, Rigel answers node-distance queries in 10’s of microseconds, and also produces shortest path results up to 18 times faster than prior shortest-path systems with similar levels of accuracy.
I Introduction
Fast and scalable analysis of massive graphs is a significant challenge facing a number of application areas, including online social networks, biological protein interaction networks, and analysis of the Internet router backbone. For example, a social game network might search for “central” users to help deploy new games, while a social auction site [1] wants to tell a buyer if a specific item is being auctioned by someone in her social circles. Ideally, such queries should be answered quickly, regardless of the size of the graph, or even if graphs themselves are changing over time.
Unfortunately, these goals are simply unattainable for today’s massive graphs. This is because numerous graph analysis problems such as centrality computation, node separation, and community detection all rely on the simple node distance (length of shortest path) primitive, which scales badly with graph size. For graphs generated from social networks such as Facebook (500 million nodes), LinkedIn (80 million) and Twitter (100 million), computing the shortest path distance between a single pair of nodes can take a minute or more using traditional algorithms such as breadth-first-search (BFS) [2]. Similarly, variants such as Dijkstra and Floyd-Warshall also fail to scale to these graph sizes.
Without an efficient alternative for node distance computation, recent work has focused on exploring efficient approximation algorithms [2, 3, 4]. Our prior work [4], described the idea of graph coordinate systems, which embeds graph nodes into points on a coordinate system. The resulting coordinates can be used to quickly approximate node distance queries on the original graph. Our initial system, which we refer here to as Orion, was a centralized system that approximated node distances by mapping nodes to the Euclidean coordinate system. It has several limitations in practice. First, Orion’s initial graph embedding process is centralized and computationally expensive, which presents a significant performance bottleneck for larger graphs. Second, Orion’s results produce error rates between 15% and 20%, which limits the types of applications it can serve. Finally, it is unable to produce actual paths connecting node pairs, which is often necessary for a number of graph applications.
In this work, we seek to extend work on graph coordinate systems by developing a practical system that provides significant improvement in accuracy, scalability, and extended functionality. We systematically explore decisions in the design of a graph coordinate system, and make two key observations. First, we propose to extend our work on graph coordinate systems, by embedding large graphs in a hyperbolic space for lower distance distortion errors. Our embedding algorithm naturally parallelizes the costly embedding process across multiple servers, allowing our system to quickly embed multi-million node graphs. Second, we propose a novel way to use graph coordinates to efficiently locate shortest paths between node pairs. The result of our work is Rigel, a hyperbolic graph coordinate system that supports queries for both node distance and shortest paths on today’s large social graphs. After a one-time, easily parallelizable, preprocessing phase, Rigel can resolve queries in tens of microseconds, even for massive social graphs up to 43 million nodes.
Our paper describes four key contributions.
- •
-
•
We evaluate a distributed prototype of Rigel using social graphs of different sizes from several OSNs, including Facebook, Flickr, Orkut, LiveJournal, and Renren. Our results show that Rigel achieves consistently improved accuracy compared to Orion, and scales to large graphs of up to 43 million nodes.
-
•
In Section V, we implement three different social graph analysis applications on top of the Rigel system. Our results illustrate both the accuracy and scalability of the Rigel system for use in real graph analysis applications.
-
•
Finally, we propose an approach to approximate shortest paths for any node pair using graph coordinates. We compare Rigel’s shortest path results to those from recently proposed techniques. Rigel paths provide accuracy similar to the most accurate of prior schemes, while resolving queries up to 18 times faster.
| Graphs | Nodes | Edges | Avg. Path Len. |
|---|---|---|---|
| Egypt | 246K | 1,618K | 5.0 |
| Norway | 293K | 5,589K | 4.2 |
| L.A. | 275K | 2,115K | 5.2 |
| Flickr | 1,715K | 15,555K | 5.1 |
| Orkut | 3,072K | 117,185K | 4.1 |
| Livejournal | 5,189K | 48,942K | 5.4 |
| Renren | 43,197K | 1,040,429K | 5.0 |
I-A Social Network Graph Datasets
Throughout our paper, we use a number of anonymized social graph datasets gathered from measurements of online social networks to guide and evaluate our system design. We utilize a total of 7 social graphs, ranging in size from 246,000 nodes and 1.6 million edges, to 43.2 million nodes and 1 billion edges. We list their key characteristics in Table I.
Three of these graphs, Egypt, Los Angeles (LA) and Norway, are Facebook regional networks shared by the authors of [5]. The remaining four graphs are significantly larger graphs crawled from the Flickr, Orkut, LiveJournal, and Renren social networks, each with millions of nodes and edges. We use them to test the efficiency and scalability of our system. The Livejournal, Flickr and Orkut are datasets shared by the authors of [6]. With 43 million nodes and more than 1 billion edges, our largest dataset is a snapshot of Renren, the largest online social network in China. We obtained this graph after seeking permission from Renren and the authors of [7]. While these graphs are still significantly smaller than the current user populations of Facebook (600 million) and LinkedIn (80 million), we believe our graphs are large enough to demonstrate the scalability of our mechanisms.
II Background and Related Work
Our goal is to develop a practical system that quickly answers node distance queries for today’s massive social graphs. To do so, we will use our proposed concept of graph coordinate systems (GCS), an approach that tolerates an initial computational overhead in order to provide node-distances approximations that take constant time regardless of graph size. In this section, we introduce the concept of graph coordinate systems, and related work on graph embedding and social networks.
II-A Background
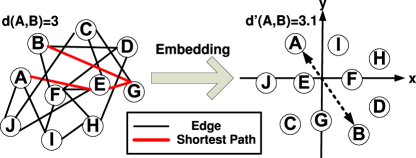
Graph coordinate systems, a concept first proposed in Orion [4], seek to provide accurate estimates of distances between any pair of graph nodes. At a high level, this approach captures the complex structure of a high dimensional graph, and computes a lossy representation for it in the form of a fixed position for each graph node in a coordinate space. Each node’s coordinate position is chosen such that its distance to another node in the coordinate space matches its real shortest path distance to that node in the actual graph. In Figure 1 for example, the shortest path distance between nodes and is 3 in the graph, and the Euclidean distance between their coordinate positions is 3.1.
Pros and Cons. The advantage of using a GCS is that, once a graph is embedded, the system can answer each node distance query using a small amount of time independent of the graph size, i.e. time. In practice, each query takes only a few microseconds () to compute. This is very attractive for applications that require large numbers of node distance computations, such as computing graph-wide metrics like graph diameter and average path length. To process queries on a given graph , however, a GCS must first compute a one-time embedding of into the coordinate space, i.e. compute the coordinate positions of each graph node. This initial step can be computationally expensive, and scales roughly linearly with graph size, i.e. for a graph with nodes. Finally, a graph coordinate system provides good approximations to graph queries, but does not provide perfect results.
Goals. We focus on two goals in our exploration of the GCS design space. First, we seek to optimize the graph embedding to maximize accuracy. Second, since graph embedding is by far the biggest source of computational cost in a GCS system, our goal is to ensure that we can take advantage of distributed computing resources, e.g. server clusters, to ensure scalability as graphs continue to grow.
II-B Work on Embedding in Geometric Spaces
Embedding techniques have been used in a variety of application contexts. The most recent and well-known use of embedding techniques was in the context of network coordinate systems used to estimate Internet latencies without performing exhaustive end-to-end measurements [8, 9, 10]. In contrast, we are interested in finding an efficient embedding metric that preserves shortest paths on large complex graphs, such as those derived from social networks.
We highlight three popular geometric spaces: Euclidean, Spherical and Hyperbolic, and summarize prior experiences with these spaces from both measurement and theoretical studies.
Euclidean. Euclidean embedding was first used on simple graphs such as planar graphs and trees [11]. It was widely used to predict “distances” such as routing latency between Internet hosts [8, 10]. For example, GNP [8] is a centralized system that uses a small number of public landmarks to embed all Internet hosts in the space. Similar systems proposed later include those using Lipschitz embedding [12], a spring force model [10] and most recently a system using Euclidean Big-Bang Simulation [13]. These systems calibrate nodes’ geometric positions based on distances, e.g. Internet round-trip time (RTT), which are measured in a distributed manner. Still later work proposed bounds on the distortion of Euclidean embedding. To the best of our knowledge, J. R. Lee’s recent result [14] proves the tightest upper bound, for an -point Euclidean embedding.
Spherical. Vivaldi [15] was the first to investigate the accuracy of embedding a network into a spherical coordinate space. While morphing on spherical spaces is widely used in computer vision [16], there is little theoretical work investigating spherical embedding.
Hyperbolic. A hyperbolic space can be thought of a space with a tightly connected core, where all paths between nodes pass through. Intuitively, both social graphs and the Internet topology should fit this model well, since they both feature highly connected graph cores. Experimental systems for embedding Internet distances [17, 18, 15] generally showed improved accuracy over analogous systems that used Euclidean spaces.
There is limited work on theoretical characteristics of Hyperbolic spaces embedding. In the context of ad hoc wireless networks, Kleinberg proved that a greedy hyperbolic embedding yields routes with low stretch [19], where greedy embedding is a graph embedding with the following property: for any pair of nodes , there is at least one neighbor of node closer to node than node itself. A recent work [20] improves the greedy embedding algorithm for dynamic graphs, and proposes a modified greedy routing algorithm for message routing.
While these projects are about Hyperbolic embedding algorithms, they either focus on graphs in the context of routing in wireless networks or on small synthetic graphs (50 nodes as in [20]). A later project [21] proposes a graph model using Hyperbolic spaces that is capable of producing synthetic graphs with scale-free structural properties. Unlike our work, this project aims to generate synthetic graphs instead of embedding real graphs.
II-C Social Network Applications and Studies
Here we briefly summarize other related projects on social applications and social network measurements.
Shortest-path based Applications. Recently, social networks have inspired a numerous security protocols and social applications in a number of fields. In Section V, we will evaluate our proposed system using three of the most common social analysis applications: graph separation metrics, graph centrality, and distance-ranked social search [2, 22].
There are many other social applications relying on shortest path computations. For instance, information dissemination [23] can leverage distances between nodes to find the most influential nodes. Community detection algorithms on social graphs (see a taxonomy from [24]) can benefit from shortest path distances between nodes to classify them in different clusters. Furthermore, algorithms for detecting Sybil attacks are similar to community detection strategies [25], which make them suitable candidates to leverage our system. Neighborhood function [26] uses node distance distributions to predict whether two graphs are similar or not. Mutual friends detection computes the mutual friends between social users. Users in the Overstock social auction site query the social graph to see how they are connected to sellers of a given product [1]. All these applications rely heavily on shortest path computations, and therefore can benefit significantly from our system.
Studies of Online Social Networks. Recently, a number of large measurement studies have studied the structure of online social networks through graph measurement and analysis. For example, Mislove et al. published a comprehensive paper to analyze data crawled from Flickr, Livejournal, Orkut and Youtube [6]. Wilson et al. generated large social graphs and interaction graphs by crawling the Facebook network [5]. Jiang et al. [7] used the same methodology to generate a large social graph of 43 million users on Renren, the Chinese Facebook clone. Finally, Twitter was analyzed in [27], and other studies modeled behavior of social network users using network level data measurements [28, 29].
III A Hyperbolic Graph Coordinate System
A number of recent projects have shown that hyperbolic spaces can more accurately capture distances on a network graph [18, 20, 21]. We also empirically compute distortion metrics [30] on our social graphs for different coordinate systems in Table II, and find that the hyperbolic space is in fact significantly more accurate than Euclidean and spherical alternatives
| Metrics | Euclidean | Hyperbolic | Spherical | Ideal |
| Value | ||||
| ARE | 0.16 | 0.10 | 0.36 | 0 |
| AAE | 0.78 | 0.50 | 1.83 | |
| AER | 0.97 | 1.00 | 0.91 | 1 |
| ACR | 1.07 | 1.02 | 1.72 | |
| ASPD | 1.19 | 1.11 | 1.96 | |
| SD | 58.46 | 30.63 | 134173.04 |
In this section, we describe Rigel, a hyperbolic graph coordinate system (GCS) for estimating node distance queries. Before answering queries on a particular graph, the graph must first be embedded into a hyperbolic coordinate space, a process that involves computing ideal coordinate values for each node in the graph. We describe hyperbolic coordinate computation in Rigel, present details of Rigel’s graph embedding process, and explore the impact of system parameters on embedding accuracy. Wherever possible, we compare Rigel’s results directly to comparable results obtained from running Orion [4], our prototype GCS based on Euclidean coordinates.
III-A Distance Computation in the Hyperboloid
There are five known “Hyperbolic models” that have been proposed for different purposes and graph structures, including the Half-plane, the Poincaré disk model, the Jemisphere model, the Klein model and the Hyperboloid model [18]. Each model is a different method of assigning coordinates and computing distances over the same hyperbolic structure. Since choosing a model fundamentally changes how graphs can be embedded, it is currently unknown how the choice of models affects embedding distortion.
In designing Rigel, we chose the Hyperboloid model for two practical reasons. First, computing distances between two points in this model is computationally much simpler than alternative models. Second, the computational complexity of calculating distances is independent of the space curvature. This gives us additional flexibility in tuning the structure of the hyperbolic space for improved embedding accuracy.
The curvature parameter ( in our model) is another important parameter in the definition of the Hyperbolic space [18]. When , the Hyperbolic space reduces to the Euclidean space. The choice of also has significant impact on the level of distortion between the real node distances and their images on the Hyperbolic space. For a Hyperboloid model with curvature , the distance between two -dimension points and is defined as follows:
| (1) |
As we will empirically show in Section III-C1, smaller absolute values of (when ) produce lower distortion.
III-B Computing a Hyperbolic Embedding
We now describe a basic (centralized) algorithm for embedding a graph into our Hyperbolic space. At a high level, we follow the “landmarks” approach proposed in [4], where we first choose a small number of nodes as landmarks, where and is the number of nodes in . We first use a global optimization algorithm to fix the coordinates of these landmarks, such that their distances to each other in the coordinate space are as close as possible to their matching path distances in the graph. We refer to this step as “bootstrapping.” Once the landmarks are set, we compute the positions of all remaining nodes, such that each node’s distances to all landmarks in the coordinate space closely match its actual node distances to those landmarks in the graph.
The rationale behind this approach is that computing “ground truth,” i.e. the shortest path length between any two nodes, is an expensive task. This is unlike other embedding applications, e.g. Internet latencies, where a single “Ping” would get the true distance between 2 nodes. Thus “calibrating” node positions in a pairwise fashion would generate a large number () of breadth-first-search (BFS) computations. By choosing a small, constant number of landmarks, we only need to compute a BFS tree for each landmark. The resulting values represent shortest path lengths from all remaining nodes to these landmarks, and are sufficient to calibrate their coordinate values. As in [4], we choose the landmarks as nodes with highest degree, as a way to efficiently approximate nodes with high centrality.
Next, to compute the coordinate position for a graph node, we randomly select out of the () landmarks. Recall that we computed a global BFS from each landmark to all nodes in the graph during the bootstrapping step. Thus we know the actual node distances in the graph between the new node and each of its selected landmarks. We apply the Simplex method [31] to compute an optimal coordinate such that distances between the node and its landmarks in the coordinate space match the known node distances.
Optimizing Local Paths. It has been shown in Internet embedding systems [17] that the largest errors are introduced when estimating paths or node distances for nearby nodes, i.e. nodes separated only by 1 or 2 hops. In the context of graphs, this is an easy limitation to overcome, since 1-hop neighbors are easily accessible via graph representations such as edge lists or adjacency matrices. Rigel uses local neighbor information to augment the node knowledge about its close-by topology. Before answering a query for a pair of nodes, Rigel first checks their adjacency lists to detect if they are direct neighbors or 2 hop neighbors (share a node in their adjacency list).
This additional memory access increases Rigel’s per-query latency, but is still a worthwhile tradeoff for two reasons. First, accuracy in resolving local graph queries is critical to many graph operations. Second, we will show later that even after the optimization, overall latency for each query is still limited to tens of microseconds for our graphs.
III-C Embedding Accuracy on Real Graphs
We now investigate the impact on embedding accuracy by two parameters, curvature of the space and number of dimensions of the space . We report experimental results using three Facebook datasets presented in Table I. The results on the remaining graphs are consistent with these results, and are omitted for brevity. Next, we take a closer look at the magnitude of approximation errors as a function of the actual path lengths, and find that as expected, relative errors are highest for node pairs already close by in the graph.
III-C1 Impact of Curvature and Dimension
In order to derive the parameters that maximize the accuracy of our system, we evaluate the impact of two important parameters of Hyperbolic space: curvature and number of dimensions.
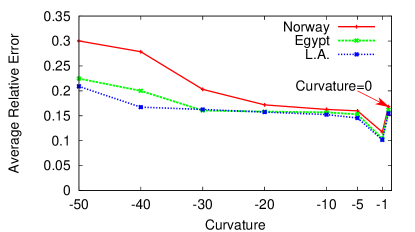
Impact of Curvature. The curvature of a Hyperbolic space is an important parameter that determines the structure of the space. We build different Hyperbolic spaces using curvature values that range from to , and investigate the effect on the accuracy of the distance estimation using our three Facebook social graphs.
Figure 2 plots the average relative error when the curvature varies between and . When the curvature is , the Hyperbolic space is equivalent to an Euclidean space. We include this value as the rightmost point in our plot. From our results, we see that the average error decreases significantly as the curvature approaches . We performed further fine grain tests with curvature values around , and find that the accuracy of our system reaches a plateau near . Results at curvature of -1 are % more accurate than results from an Euclidean system, shown in the plot as curvature of . Thus we use the curvature value at in the rest of this paper.
The impact of Dimensions. The number of dimensions of a geometric space plays an important role in determining the accuracy level in the estimate of distances between nodes. Therefore, we vary the number of dimensions from to and evaluate the resulting accuracy. Increasing dimensions reduces the error from more than to about , with most of the significant improvement occurring between and dimensions. Since the results are not new, we omit the figure for brevity. Since the number of dimensions is a linear factor in the computational complexity of the Simplex method used in our embedding, we need to balance prediction accuracy against computational complexity. We find a sweet spot close to dimensions, where the accuracy has essentially reached a plateau. Thus we also use -dimension for our Hyperbolic system. This has the added benefit of providing a fair and direct comparison with our instance of Orion, which uses a 10-dimension Euclidean space.
| Graphs | Orion | Rigel-S | Rigel | BFS |
|---|---|---|---|---|
| Egypt | 0.2s | 0.33s | 6.8s | 0.75s |
| L.A. | 0.18s | 0.33s | 8.5s | 1.027s |
| Norway | 0.19s | 0.33s | 17.8s | 1.44s |
III-C2 Accuracy and Per-query Latency
In this section, we examine accuracy as a function of path length, and also compare per-query latency across a number of systems. In all cases, we use a 10-dimensional Hyperbolic space with curvature of .
Accuracy vs Path Length. We explore the accuracy of predictions for paths of different lengths. Our accuracy breakdown tells us how our node distance approximations perform, as a function of how far away the two nodes are apart in the actual graph.
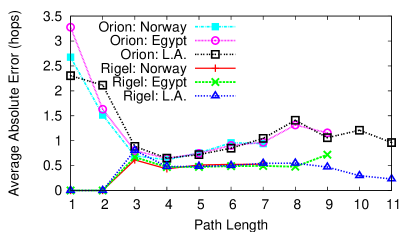
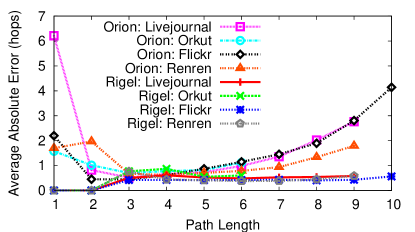
Figure 3 shows the average absolute errors per path length on three Facebook graphs by leveraging two embedding systems: Orion (using an Euclidean space) and Rigel. The bottom three lines are the results of Rigel where the average absolute error per path length ranges between and . Comparing Rigel to Orion (the top three lines in Figure 3), we confirm a noticeable improvement. Indeed, Orion presents an average absolute error per path length between and which is significantly higher than Rigel. This shows that using hyperbolic spaces clearly has a significant impact on accuracy. Also note that Orion produces extremely large errors for close node pairs. These errors are completely eliminated by Rigel’s local path optimization.
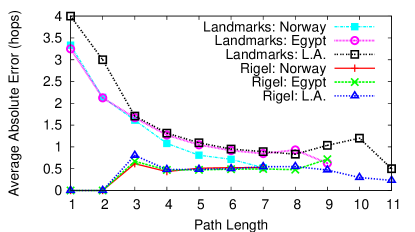
We also compare Rigel’s accuracy against the “Landmark” scheme proposed in [2]. Our results in Figure 4 show that Rigel significantly outperforms [2] regardless of the real node distance between the nodes. A comparison with Figure 3 shows that Orion also provides slightly better accuracy than [2].
Query Latency. Table III shows the average per-query response time required to compute the distance of two randomly selected nodes using Orion, Rigel, and BFS. We also plot the query time of Rigel without the local path optimization, and label it as “Rigel-S.” Rigel-S requires slightly longer time than Orion, because of the increased complexity of the hyperboloid coordinate computation. Memory access in Rigel’s local path optimization adds several microseconds to each query. But overall, Rigel’s per-query time is still orders of magnitude faster than BFS.
IV Embedding Massive Graphs
While we have described basic techniques to embed large graphs to a hyperbolic space, preliminary evaluation of our system revealed a significant challenge. Because the complexity of initial embedding scales linearly with the number of nodes in the graph, embedding a graph with multi-million (e.g. 43M) nodes can take up to a week to complete. This processing overhead presents a significant performance bottleneck, and the final limitation that prevents the practical application of Rigel on today’s massive social graphs.
In this section, we describe a natural way to address this limitation by leveraging the availability of distributed server clusters. Rigel’s embedding process is easily parallelizable across multiple servers, allowing us to reduce embedding time from a few days to a few hours using a cluster of 50 commodity servers. We refer to this optimization as “parallel Rigel.” Here, we describe mechanisms involved in parallelizing Rigel’s embedding process, and then evaluate its impact using four large social graphs.
| Graphs | Bootstrap (hours) | Graph Partitioning (hours) | Embedding (hours) | Response | |||
|---|---|---|---|---|---|---|---|
| Rigel | P-Rigel | P-Rigel | Rigel | P-Rigel | BFS | Rigel | |
| Flickr | 1.4 | 0.028 | 0.003 | 9.7 | 0.24 | 24.5s | 12.9s |
| Orkut | 7.5 | 0.15 | 0.005 | 19.4 | 0.42 | 56.2s | 36.6s |
| Livejournal | 4.8 | 0.096 | 0.008 | 32.2 | 0.66 | 65.2s | 8.4s |
| Renren | 136.2 | 2.7 | 0.07 | 250 | 6.4 | 1598.5s | 28.9s |
IV-A Parallelizing Graph Embedding
Parallelizing Rigel is feasible because of two reasons. First, landmark bootstrapping requires computing BFS trees rooted from each landmark, which can be run independently and in parallel on different servers. Second, after bootstrapping, each graph node can also be embedded independently and in parallel based on the coordinates of the global landmarks. Because the number of nodes is large, we just need to distribute nodes across servers to ensure load balancing.
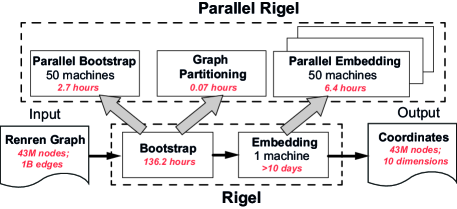
Parallel Rigel. We integrate the above mechanisms with the original Rigel design. The result is Parallel Rigel, an optimized version of Rigel that scales to massive social graphs. Figure 5 demonstrates the Parallel Rigel system on top of and contrasts it to the original Rigel design. It consists of three components: parallel bootstrapping, graph partitioning and parallel embedding. The parallel bootstrapping module distributes BFS tree computation related to each landmark across servers, one or more landmarks per server. The graph partitioning module provides a balanced distribution of nodes across servers. The cost of this operation is negligible since simple partitioning schemes are sufficient. Finally, the parallel embedding module embeds all graph nodes in parallel across the servers, allowing Parallel Rigel to achieve significant speedup.
We have implemented a fully-functional prototype of parallel Rigel, and used it to embed the largest graph we have, the 43 million node graph from the Renren online social network. As seen in Figure 5, running the centralized version of Rigel on a single large memory server (Dell PowerEdge server with 32GB of RAM) required 136 hours to perform initial bootstrapping (computing BFS trees), and more than 10 days to do the actual node embedding of all graph nodes. Applying parallel Rigel to the same graph over a cluster of 50 servers (Dell Xeon, 2GB) reduces the parallel bootstrap process to 2.7 hours, and embedding to only 6.4 hours.
IV-B Experimental Results
Using Parallel Rigel, we can now embed multi-million node graphs in a reasonable amount of time. In the following, we use four of today’s massive social graphs, Flickr, Orkut, Livejournal and Renren, to examine the accuracy and efficiency of Parallel Rigel. The characteristics of these four graphs are listed in Table I.
Accuracy. We first examine the accuracy of Parallel Rigel’s coordinate system by comparing it to Orion. In Figure 6 we plot the average absolute error for different path lengths using Parallel Rigel and Orion. Like our previous results on smaller Facebook graphs, Parallel Rigel not only significantly improves the accuracy of long distance prediction, but also reduces the error in short distance estimation. We have also verified that Parallel Rigel performs similar to the original Rigel on these graphs.
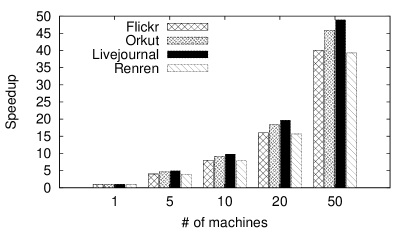
Computation Efficiency. We now evaluate the efficiency of Parallel Rigel by comparing its computation time against that of the original Rigel design. By utilizing a cluster of servers, Parallel Rigel can distribute the computation tasks of landmark bootstrapping and graph embedding into multiple parallel servers. While Parallel Rigel does require an extra step of graph partitioning by distributing nodes among machines, it only leads to a minor increase in time complexity, less than 0.1% of the original bootstrapping time. Table IV shows the comparison when Parallel Rigel runs on a cluster of 50 servers. We see that Parallel Rigel achieves close to linear speedup, even slightly better due to better memory isolation across multiple servers.
To examine the impact of the cluster size, we also compare the speedup achieved by Parallel Rigel using 5, 10, 20 and 50 servers, where speedup is the decrease in embedding time. Results in Figure 7 show that run time decreases almost linearly with cluster size.
V Applications
We demonstrate the effectiveness and efficiency of Rigel in social network analysis and applications by implementing several common graph applications. In each case, we compare the accuracy of Rigel against that of Orion [4].
V-A Computing Separation Metrics
Social network graphs are known for displaying the “Small World” behavior. Graph separation metrics such as diameter, radius and average path length, have been widely used to examine and quantify the Small World behavior. But since each of these metrics relies on large numbers of node distance computations, computing them for large graphs can become extremely costly or even intractable.
Using Rigel, we build an application to compute the graph separation metrics listed above, and examine their accuracy by comparing their results to ground truth. Since computing shortest path length between all node pairs takes several days even for our smallest graph (Facebook Egypt), we take a random sampling approach to compute the ground truth. We randomly sample 5000 nodes from the three Facebook graphs, 500 nodes from Flickr, Livejournal and Orkut, and nodes from Renren, and use shortest path lengths between these pairs to derive the separation metrics.
We report the results in Table V-A for Radius, Diameter and Average Path Length on seven different graphs, for Rigel, Orion and Ground Truth. In general, Rigel consistently provides more accurate results compared to Orion. More importantly, Rigel provides results across all three metrics that are extremely close to ground truth values.
| Metric | Method | Egypt | L. A. | Norway | Flickr | Orkut | Livejournal | Renren |
| Radius | Ground Truth | 9 | 11 | 8 | 13 | 6 | 13 | 12 |
| Rigel | 8.7 | 11.0 | 7.5 | 12.7 | 6.4 | 12.2 | 12.0 | |
| Orion | 9.2 | 10.7 | 7.8 | 12.6 | 6.3 | 12.0 | 12.1 | |
| Diameter | Ground Truth | 14 | 18 | 12 | 19 | 8 | 17 | 15 |
| Rigel | 14.8 | 17.9 | 11.7 | 18.6 | 10.2 | 17.7 | 14.9 | |
| Orion | 14.4 | 17.8 | 12.2 | 17.3 | 10.0 | 16.8 | 14.9 | |
| Average Path Length | Ground Truth | 5.0 | 5.2 | 4.2 | 5.1 | 4.1 | 5.4 | 5.0 |
| Rigel | 4.9 | 5.1 | 4.2 | 5.0 | 4.3 | 5.5 | 4.9 | |
| Orion | 4.7 | 5.0 | 4.1 | 4.3 | 3.9 | 4.8 | 4.6 |
V-B Computing Graph Centrality
Graph centrality is an extremely useful metric for social applications such as influence maximization [23] and social search. For example, application developers can use node centrality values to identify the most influential nodes for propagating information in an online social network. Formally, the most “central” node is defined as the node which has the lowest average node distance to all other nodes in the network.
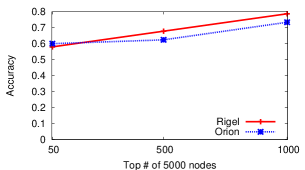
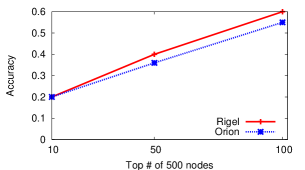
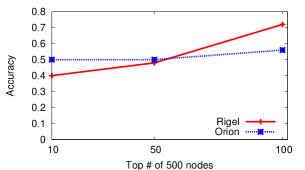
Using Rigel, we implement a simple application to compute node centrality directly from node distance values, where a node with a small average path length has a high centrality score. As before, we examine the accuracy of our Rigel-enabled application by computing the centrality of randomly chosen nodes on the three Facebook graphs, randomly chosen nodes each for Flickr, Livejournal Orkut, and nodes for Renren. For each graph, we sort these nodes by centrality, and select the top nodes. We compute the “accuracy” of Rigel’s centrality ordering by counting the number of overlapping nodes () in Rigel’s top nodes and actual top centrality nodes as computed by BFS on the original graph. We study the accuracy of our Rigel-based system as the ratio of to .
We perform our experiments on all seven of our social graphs, and find the results to be highly consistent. For the rest of this section, we will only report results for three of them: Facebook Los Angeles, Orkut and Livejournal. Figure 8 shows the centrality accuracy results for different values of . As expected, the accuracy of both Rigel and Orion increases with larger values. In general, Rigel consistently outperforms Orion for different graphs and different values of .
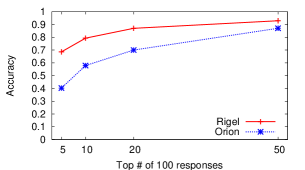
V-C Distance-Ranked Social Search
Social networks such as Facebook and LinkedIn can best serve their users by ranking search results by the proximity of each result to the user in the social graph [22]. This is because users are likely to care about its social proximity to the origin of the search result as much as the quality of the result itself, i.e. a user would pay more interest to results from her close friend rather than those from an unrelated stranger.
Despite its usefulness, including social distance in search results is highly costly due to the number of node distance computations necessary for each social search query. Instead, we can leverage Rigel’s constant time node-distance functionality to build powerful distance-based social search applications.
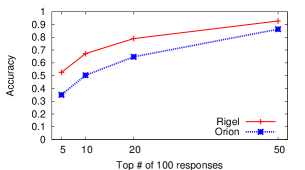
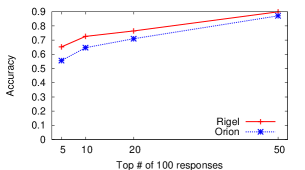
To verify the impact of Rigel on distance-ranked social search, we perform the following experiment. For each node which initiates a query, we randomly select nodes in the network to respond to the query. We sort the responses by their social distance to the query node, computed via both Rigel and Orion, and return the top nodes for the user. We then compute the same top results by computing social distance using BFS, and examine the percent of overlapping nodes between the result sets as a measure of accuracy. We repeat this experiment times on smaller graphs like Egypt, L.A. and Norway, and times on our largest graph, i.e. Renren. We vary the parameter from to , and show the results of L.A, Orkut and Livejournal in Figure 9. The results show that Rigel’s hyperbolic coordinates allow it to consistently and significantly outperform Orion’s Euclidean coordinates. On Livejournal, for example, when we rank the top search results, average accuracy of Rigel is while Orion only achieves .
VI Shortest Paths in Rigel
A number of critical graph-based applications require not only the length of the shortest path between two nodes, but also the actual shortest path connecting them. For example, users often need to know the exact social links that connect them to another user in LinkedIn. Similarly, users in the Overstock social auction system can perform a search to see how they are connected to the seller of a given object [1].
In this section, we describe a novel extension to Graph Coordinate Systems that produces accurate approximations of shortest paths by using node distance queries as a tool. We first describe how this extension to Rigel can compute short paths between any two nodes. Next, we describe the Sketch algorithm [32], an efficient algorithm for shortest path estimation, and its followup algorithms including SketchCE, SketchCESC, and TreeSketch [33]. Finally, we compare Rigel’s shortest path algorithm against all of these algorithms on a variety of social graphs in both accuracy and per-query runtime. We show that while Rigel requires similar preprocessing times to these algorithms, Rigel’s shortest paths return query results 3-18 times faster, while matching the best of these algorithms in accuracy.
VI-A Finding Shortest Paths using Rigel
We now describe a heuristic that uses our coordinate system to find a good approximation of the shortest path connecting any two nodes. Our algorithm, which we call Rigel Paths, uses techniques reminiscent of the routing algorithm in [21].
Given two nodes and , we start by computing the distance between them . If the distance is 1 or 2 hops, we can use simple lookup on their adjacency lists to determine the shortest path between them. If the predict distance between the nodes is greater than 2 hops, then we begin an iterative process where we attempt to explore potential paths between the nodes using the coordinate space as a directional guide.
Starting from , we use Rigel to estimate the distance of each of its neighbors to . The expected distance for a neighbor on the shortest path should be . If any neighbor’s estimated distance is within a factor of that prediction, it is considered a candidate node to explore. For each of ’s neighbors that qualify as a candidate node, we repeat the process to obtain candidates for hop 2. This process iterates until one of the candidate nodes is a direct neighbor of .
At each iteration of the algorithm, i.e. for the hop, we keep a maximum number of candidates to explore. Choosing this number manages the tradeoff between exploring too many paths (and extending processing latency) and exploring too few paths (and finding a dead end or inefficient paths). In practice we choose to be 30, and to be 0.3.
| Graphs | Preprocessing (Hours) | Per-Query Response Time (s) | ||||||
| Rigel | Sketch | Rigel | Sketch | SketchCE | Rigel Paths | SketchCESC | TreeSketch | |
| Egypt | 1.3 | 0.43 | 6.8 | 1781 | 1792 | 3667 | 38044 | 62407 |
| L.A. | 1.5 | 0.54 | 8.4 | 936 | 946 | 4008 | 20597 | 56828 |
| Norway | 1.4 | 0.67 | 17.8 | 1492 | 1501 | 4621 | 21472 | 59635 |
| Flickr | 9.7 | 3.3 | 12.9 | 17157 | 17178 | 41279 | 732332 | 630890 |
| Orkut | 19.4 | 13.1 | 36.6 | 21043 | 21054 | 49470 | 273586 | 730284 |
| Livejournal | 32.2 | 14.2 | 8.4 | 75101 | 75114 | 28355 | 253976 | 348464 |
| Renren | 250 | 348 | 28.9 | 124327 | 124334 | 181814 | 546925 | 2594756 |
VI-B Sketch-based Algorithms for Shortest Path
Here, we describe existing state-of-the-art algorithms in approximating shortest paths in graphs. Two recent projects explored four total algorithms for locating shortest paths, all based on variants of the Sketch algorithm [32, 33]. Here we describe these algorithms so that we can compare them against Rigel in both accuracy and query latency.
Sketch [32]. Sketch is a landmark-based solution where each node computes its shortest paths to the landmarks and then uses common landmarks between itself and another node in the graph to estimate their shortest paths. This method selects sets of landmark nodes, where is the number of nodes in the graph. For each node in the graph, Sketch computes its shortest paths to (=2) different landmarks in each set [32]. Those shortest paths are precomputed by leveraging the results of BFS trees rooted in each landmark. Therefore, for an undirected graph, each node is associated with shortest paths.
Cycle Elimination, Short Cutting and TreeSketch [33]. These three algorithms are variants of the basic Sketch approach for finding shortest paths, and all three are described in [33]. First, Cycle Elimination improves Sketch by simply removing cycles in the estimated path computed by Sketch. We refer to this algorithm as SketchCE. Second, Short Cutting improves Sketch by searching for bridging edges between two nodes and , where is on the path between the source and the landmark and is on the path between the landmark and the destination. As soon as such an edge is found, the edge between and replaces the sub-path through the landmark. This approach also includes the SketchCE optimization. It locates shorter paths, but dramatically increases computational time. We will refer to this algorithm as SketchCESC.
Finally, TreeSketch is a tree-based approach that improves Sketch by adding another optimization to those implemented in SketchCE and SketchCESC. At query time, TreeSketch builds two trees, one rooted at the source and one rooted in the destination. These trees are formed using precomputed paths to landmarks; therefore, the computational time is proportional to the complexity of building the trees and not to the BFS operations. Given the two trees, the path search starts from both root nodes, and iteratively explores more nodes from both trees. BFS computation starts from roots of both trees. For each visited node in a tree, its neighbors are computed and compared with any visited node in the other tree. As soon as a common node is found, the shortest path between source and destination is constructed with the following three sub-paths: the subpath from source to node , the edge , and the sub-path from to the destination. While TreeSketch produces very accurate paths, it is computationally slow due to the tree construction and extensive search process.
VI-C Comparing Shortest Path Algorithms
We compare our Rigel Paths algorithm to Sketch and its improved variants SketchCE, SketchCESC and TreeSketch. We compare both accuracy and per-query latency.
Experimental Settings. To compare Rigel Paths against prior work, we obtained the source code for the four sketch-base algorithms from their authors [33]. All of their code runs on RDF-3X [34], a specialized database system optimized for efficient storage and computation of large graphs. All graph experiments were performed on Dell quad-core Xeon servers with 24GB of RAM, except for Renren experiments, which were performed on similarly configured Dell servers with 32GB of RAM.
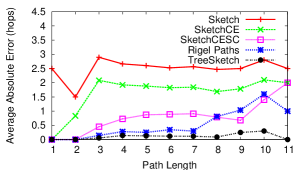
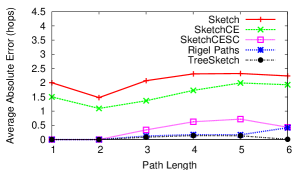
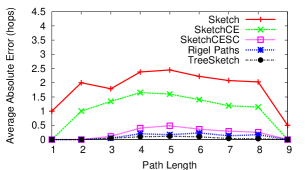
Accuracy. For each of the seven graphs in Table I, we randomly sample 5000 node pairs, and compare the shortest path results of Rigel Paths, Sketch, SketchCE, SKetchCESC, and TreeSketch algorithms against the actual shortest paths computed via BFS. We evaluate the accuracy of these algorithms in two ways. First, we break down the absolute errors by the length of the shortest path. Second, we compute the estimate shortest paths, of the 5000 pairs of nodes, hop by hop and observe the similarity compared with the ground truth.
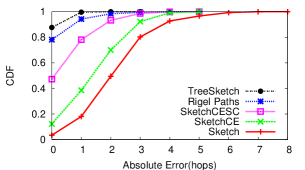
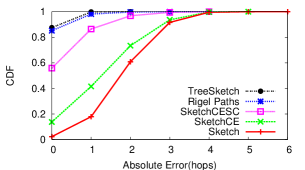
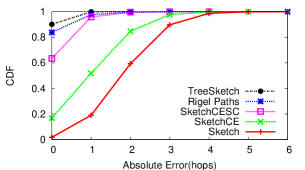
Figure 10 shows the average absolute error of the five different algorithms broken down by length of the actual shortest path. Here we define the absolute error as the additional number of hops in the estimated path when compared to the shortest path. As before, we only show the Los Angeles Facebook, Orkut and Livejournal graphs for brevity, because their results are representative of results on other graphs. The results show consistent trends across the graphs. The Sketch and SketchCE algorithms are highly inaccurate, and generally produce shortest paths that are roughly 2 hops longer than the shortest path. TreeSketch and Rigel are the most accurate algorithms. They produce extremely accurate results, and are often indistinguishable from each other. Both produce much more accurate results than SketchCESC.
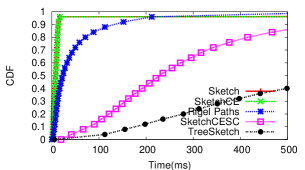
We show the CDF of absolute errors of the different algorithms in Figure 11. This shows a clearer picture of the distribution of errors. Again, Rigel paths and TreeSketch are by far the most accurate algorithms. Both produce exact shortest paths for a large majority of node pairs. Both are significantly better than SketchCESC. SketchCE and Sketch are fairly inaccurate, and provide paths with multiple hop errors for the overwhelming majority of node pairs. While Rigel Paths provides accuracy that matches or beats all of the Sketch based algorithms, we will show later that it is significantly faster than both SketchCESC and TreeSketch (ranging from a factor of 3 to a factor of 18 depending on the specific graph).
Finally, we also compared the length of the shortest paths found by our Rigel Paths algorithm to node distance values estimated by Rigel. Interestingly, Rigel Paths is more accurate, with absolute errors below 0.3, compared to errors between 0.5 and 1 hop111We can observe this result by comparing Figure 10 and Figure 6.. Rigel Paths achieves this higher level of accuracy because it leverages actual graph structure to compute its shortest paths.
Computational Costs. A scalable system for analyzing large graphs requires both accuracy and efficiency. We now compare Rigel Paths and the four Sketch algorithms on computational time complexity. We break down our analysis into two components. First, we measure each algorithm’s preprocessing time. For Rigel Paths (and Rigel), this represents the time required to embed the graph into the coordinate space, i.e. computing coordinates for all nodes. All Sketch algorithms share the same bootstrapping process, which includes computing shortest paths (using BFS) to all of their landmark nodes [33]. Our second component measures the computational latency required to resolve each query. All experiments are run on a single server. As before, Renren experiments were run on our 32GB RAM server, while all other experiments were run on identical 24GB RAM servers.
We summarize all of our timing results in Table VI. Looking at the bootstrap times, we see that Rigel takes roughly 2–3 times longer to preprocess. Note, however, that these measurements only capture bootstrap times for a single server. As shown in Figure 7, we can distribute Rigel’s preprocessing phase across multiple machines with close to linear speedup. Once we consider this factor, we see that we can reduce Rigel preprocessing to match Sketch just by spreading the load over 2 or 3 machines.
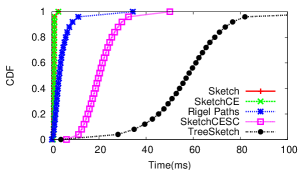
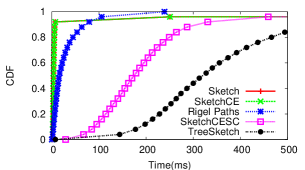
Per-query latency is likely to be a much more important measure of performance, since large social graphs are unlikely to change significantly over short time periods. Again, we choose 5000 node pairs at random from each of the graphs, and compare the average query response time for each of the algorithms. The shortest path algorithms, Sketch, SketchCE, Rigel Paths, SketchCESC and TreeSketch are ordered in Table VI from left to right from the fastest to the slowest. Recall from prior results that Sketch and SketchCE produce paths that are highly inaccurate, i.e. introduce an average of 2-3 additional hops in each path. Of the two best algorithms, Rigel Paths and TreeSketch, Rigel paths returns results in a fraction of the time required by TreeSketch and SketchCESC. The latency reduction ranges from 3 (against SketchCESC on Renren) to a factor of 18 (against SketchCESC on Flickr). We show a CDF of these results in Figure 12. Rigel Paths is clearly much faster than both TreeSketch and SketchCESC.
Finally, we also include the node-distance computation time from Rigel as a point of reference. Clearly, finding actual shortest paths is orders of magnitude more expensive than simply computing node distance. Luckily, the large majority of graph analysis tasks only require node-distance computation, and only user-interactive queries require the full shortest path between node pairs.
VII Conclusion
Traditional algorithms for performing graph analytics no longer scale to today’s massive graphs with millions of nodes and billions of edges. Computing distances and shortest paths between nodes lies at the heart of most graph analysis metrics and applications, and is often responsible for making them intractable on large graphs.
We propose Rigel, a hyperbolic graph coordinate system that approximates node distances by first embedding graphs into a hyperbolic space. Even for graphs with 43 million nodes and 1+ billion edges, Rigel not only produces significantly more accurate results than prior system, but also answers node distance queries in 10’s of microseconds using commodity computing servers. For the more challenging task of computing shortest paths, we propose Rigel Paths, a highly efficient algorithm that leverages Rigel’s node distance estimates to locate shortest paths. The results are impressive. Rigel Paths produces exact shortest paths for the large majority of node pairs, matching the most accurate of prior systems. And it does this quickly, returning results up to 18 times faster than state-of-the-art shortest-path systems with similar levels of accuracy.
References
- [1] G. Swamynathan et al., “Do social networks improve e-commerce: a study on social marketplaces,” in Proc. of SIGCOMM WOSN, 2008.
- [2] M. Potamias et al., “Fast shortest path distance estimation in large networks,” in Proc. of CIKM, Hong Kong, Nov. 2009.
- [3] M. J. Rattigan et al., “Using of structure indices for efficinet approximation of network properties,” in Proc. of KDD, 2006.
- [4] X. Zhao, A. Sala, C. Wilson, H. Zheng, and B. Y. Zhao, “Orion: Shortest path estimation for large social graphs,” in Proc. of WOSN, Boston, MA, June 2010.
- [5] C. Wilson et al., “User interactions in social networks and their implications,” in Proc. of EuroSys, April 2009.
- [6] A. Mislove et al., “Measurement and analysis of online social networks,” in Proc. of IMC, 2007.
- [7] J. Jiang et al., “Understanding latent interactions in online social networks,” in Proc. of IMC, 2010.
- [8] T. S. E. Ng and H. Zhang, “Predicting internet network distance with coordinates-based approaches,” in Proc. of INFOCOM, 2002.
- [9] P. Francis et al., “An architecture for a global internet host distance estimation service,” in Proc. of INFOCOM, Mar. 1999.
- [10] F. Dabek et al., “Vivaldi: A decentralized network coordinate system,” in Proc. of SIGCOMM, Aug. 2004.
- [11] S. Rao, “Small distortion and volume preserving embeddings for planar and euclidean metrics,” in Proc. of SCG, 1999, pp. 300–306.
- [12] L. Tang and M. Crovella, “Virtual landmarks for the Internet,” in Proc. of IMC, Oct. 2003, pp. 143–152.
- [13] Y. Shavitt and T. Tankel, “Big-bang simulation for embedding network distances in euclidean space,” IEEE/ACM ToN, vol. 12, no. 6, 2004.
- [14] J. R. Lee, “Volume distortion for subsets of euclidean spaces: extended abstract,” in Proc. of SCG, 2006.
- [15] C. Lumezanu and N. Spring, “Measurement manipulation and space selection in network coordinates,” in Proc. of ICDCS, 2008.
- [16] S. G. Kobourov and M. Landis, “Morphing planar graphs in spherical space,” in Proc. of GD, 2007.
- [17] E. K. Lua et al., “On the accuracy of embeddings for internet coordinate systems,” in Proc. of IMC, 2005.
- [18] Y. Shavitt and T. Tankel, “Hyperbolic embedding of internet graph for distance estimation and overlay construction,” IEEE/ACM Trans. Netw., vol. 16, no. 1, pp. 25–36, 2008.
- [19] R. Kleinberg, “Geographic routing using hyperbolic space,” in Proc. of INFOCOM, 2007, pp. 1902–1909.
- [20] A. Cvetkovski and M. Crovella, “Hyperbolic embedding and routing for dynamic graphs,” in Proc. of INFOCOM, 2009.
- [21] F. Papadopoulos, D. Krioukov, M. Boguñá, and A. Vahdat, “Greedy forwarding in dynamic scale-free networks embedded in hyperbolic metric spaces,” in Proc. of INFOCOM, 2010.
- [22] A. Mislove, K. P. Gummadi, and P. Druschel, “Exploiting social networks for internet search,” in Proc. of HotNets, Nov. 2006.
- [23] W. Chen, Y. Wang, and S. Yang, “Efficient influence maximization in social networks,” in Proc. of ACM KDD, 2009.
- [24] S. Fortunato, “Community detection in graphs,” Physics Reports, vol. 486, no. 3-5, pp. 75 – 174, 2010.
- [25] B. Viswanath and A. Post, “An Analysis of Social Network-Based Sybil Defenses,” in Proc. of SIGCOMM, 2010.
- [26] C. R. Palmer, C. Faloutsos, and P. B. Gibbons, “ANF: A Fast and Scalable Tool for Data Mining in Massive Graphs,” in Proc. of KDD, Jul. 2002.
- [27] H. Kwak et al., “What is twitter, a social network or a news media?” in Proc. of WWW, 2010.
- [28] F. Benevenuto et al., “Characterizing User Behavior in Online Social Networks,” in Proc. of IMC, Nov. 2009.
- [29] F. Schneider et al., “Understanding Online Social Network Usage from a Network Perspective,” in Proc. of IMC, Chicago, IL, Nov. 2009.
- [30] N. Linial, E. London, and Y. Rabinovich, “The geometry of graphs and some of its algorithmic applications,” Combinatorica, vol. 15, pp. 577–591, 1994.
- [31] J. A. Nelder and R. Mead, “A simplex method for function minimization,” The Computer Journal, vol. 7, no. 4, pp. 308–313, Jan. 1965.
- [32] A. D. Sarma et al., “A sketch-based distance oracle for web-scale graphs,” in Proc. of WSDM, 2010.
- [33] A. Gubichev et al., “Fast and accurate estimation of shortest paths in large graphs,” in Proc. of CIKM, 2010.
- [34] T. Neumann and G. Weikum, “The rdf-3x engine for scalable management of rdf data,” The VLDB Journal, vol. 19, pp. 91–113, Feb. 2010.