Velocity Dispersions and Stellar Populations
of the Most Compact and Massive Early-Type Galaxies at Redshift 1
Abstract
We present Gran-Telescopio-Canarias/OSIRIS optical spectra of 4 of the most compact and massive early-type galaxies in the Groth Strip Survey at redshift , with effective radii kpc and photometric stellar masses . We find these galaxies have velocity dispersions . The spectra are well fitted by single stellar population models with approximately 1 Gyr of age and solar metallicity. We find that: i) the dynamical masses of these galaxies are systematically smaller by a factor of 6 than the published stellar masses using photometry; ii) when estimating stellar masses as 0.7, a combination of passive luminosity fading with mass/size growth due to minor mergers can plausibly evolve our objects to match the properties of the local population of early-type galaxies.
Subject headings:
galaxies: evolution – galaxies: formation – galaxies: kinematics and dynamics – galaxies: structure1. INTRODUCTION
The evolution of the structural properties of massive early-type galaxies (ETGs) is currently a topic of debate with many open questions. In recent years, studies have shown that galaxies with are smaller by a factor of four at (Daddi et al., 2005; Trujillo et al., 2006; Longhetti et al., 2007; Buitrago et al., 2008; Damjanov et al., 2009) and a factor of two at (Trujillo et al., 2007, 2011) than the nearby population of the same mass. For the most compact and massive galaxies in particular, Trujillo et al. (2009) found that only 0.03% of SDSS galaxies with at are ETGs with kpc. This contrasts with the much higher fraction 15% of such galaxies found at 1 by Trujillo et al. (2007, hereafter T07). Most interestingly, the luminosity-weighted ages of the local compact ETGs from Trujillo et al. (2009) are very low (2 Gyr), which argues against this sample being the counterpart of a passively evolved population of high redshift galaxies. Thus, this suggests that most high redshift compact and massive galaxies must have undergone a systematic growth in size.
Among the different mechanisms proposed to explain this expansion, the one that reproduces best the observed evolution of the average mass-size relation (Trujillo et al., 2011) is the minor merger scenario (Naab et al., 2009; Hopkins et al., 2010). With this mechanism, galaxies grow inside-out by accretion of smaller satellites that build up an extended envelope (van Dokkum et al., 2010; Hopkins et al., 2009). This model predicts a substantial growth in mass and effective radius, with a mild decrease in stellar velocity dispersion . Thus, measurements of at different redshifts are a direct way to constrain this evolutionary scenario. In addition, they allow for an independent mass estimate through the virial theorem.
The minor merger scenario is consistent with the common findings of for general ETG samples at (Gebhardt et al., 2003; Treu et al., 2005; van der Wel et al., 2005; di Serego Alighieri et
al., 2005; Cenarro
& Trujillo, 2009; Cappellari et al., 2009; Fernández Lorenzo et
al., 2011). Conversely, it is greatly challenged by the dramatic evolution required for the super-dense galaxies ( kpc, ), which are expected to have much larger . van Dokkum et al. (2009) measured from a super-dense ETG at , yielding a dynamical mass that is in agreement with the photometric mass estimate. However, more measurements of these extreme galaxies are needed to support or weaken the need of a stronger evolutionary scenario. In this paper we present ’s of four massive and compact ETGs at , two of which are super-dense. We compare dynamical/stellar masses and estimate the evolutionary paths of these objects. Throughout this work we adopt a standard cosmology of , and Mpc-1.
2. THE DATA
2.1. Sample Selection
Our targets were selected from the sample by T07, which contains photometrically derived parameters for 831 galaxies with up to in the EGS field from the POWIR/DEEP-2 survey (Bundy et al., 2006). Those authors measured effective radii with the GALFIT code (Peng et al., 2002) and derived total stellar masses by fitting spectral energy distributions from Bruzual & Charlot (2003) with Chabrier IMF on photometry. We selected four massive and compact ETGs at with Sérsic index . Three of them have extreme densities in the sense that they are the most compact at a given mass. The catalog parameters of our selection are displayed in the first five columns of Table 1.
2.2. Observations and reduction
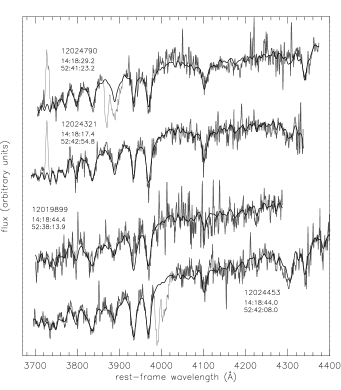
We observed 2 galaxies at a time using optical long-slit spectroscopy with the OSIRIS camera-spectrograph (Cepa, 1998) at the 10.4 m Gran Telescopio Canarias. We used a 0.8′′ slit and R1000 grism in the spectral range of Å under a seeing of 0.7′′. The total integration time per target was 12800 s. The instrumental resolution was determined by Gaussian fitting of the strong sky emission lines yielding . However, in one of the observing nights the spectrograph suffered a defocus that decreased the resolution, affecting half of the exposures of 12019899 and 12024453. For these frames we found , and we reduced this data subset independently. The standard star L970-30 was also observed to flux calibrate the spectra. The data reduction was performed with the IRAF longslit package and involved the standard steps of bias level correction, spectral flat-fielding, cosmic ray removal, sky subtraction, frame co-adding and aperture extraction. The telluric absorption band around 7600 Å was present in all of our spectra, affecting the Ca H+K lines in targets 12019899 and 12024321. To correct for telluric absorption in these two galaxies, we used a F-type star observed in the same slit as 12019899. This star’s spectrum has a signal-to-noise ratio and a smooth continuum with no spectral features within the telluric band. After its continuum removal and normalization we obtained the atmospheric transmission profile in the spectral window and divided the galaxy spectra with affected Ca H+K lines by this transmission profile. We did not apply the telluric band correction on the other targets because the main spectral lines used to measure were not affected in them. Note that this correction increases the noise in the spectral window where it is applied. Thus, in these cases the correction did not contribute towards more precise measurements and for this reason we simply excluded the affected range in wavelength from the analysis. The final rest-frame spectra have per Å and are shown in Fig. 1. Note the strong absorption in the Ca H+K lines and the Balmer series from Hγ to H12. [OII] Å doublet emission was found in two objects. In 12024790, this emission shows a double peak with a separation of 4.1 Å as compared to 2.7 Å of the doublet.
| ID | Redshift | (ABmag) | (kpc) | log | SBe(mag) | log | (km s-1) | log | Age (Gyr) | [Fe/H] |
|---|---|---|---|---|---|---|---|---|---|---|
| 12024790 | 0.9656 | 21.89 | 0.514 | 11.07 | 15.82 | 10.650.03 | 15610 | 10.160.08 | 0.8 | 0.0 |
| 12024321 | 0.9159 | 21.34 | 2.462 | 11.10 | 18.95 | 10.670.04 | 16612 | 10.900.08 | 1.0 | 0.0 |
| 12019899 | 0.9325 | 21.71 | 0.469 | 11.34 | 15.63 | 10.800.06 | 23617 | 10.480.08 | 1.6 | 0.2 |
| 12024453 | 0.9056 | 20.91 | 1.601 | 11.60 | 17.60 | 10.980.05 | 18610 | 10.800.07 | 1.3 | 0.2 |
Note. — The first five columns are properties from T07, where the effective radii and stellar masses have uncertainties of 0.06 dex and 0.2 dex, respectively. refers to the stellar mass derived with photometry from the RAINBOW database. SBe is the rest-frame -band average surface brightness within the effective radius. Age and metallicity are luminosity-weighted by the linear combination of SSP models.
2.3. Velocity Dispersions
To measure ’s we used the MOVEL code within the REDucm E distribution (Cardiel, 1999). This program computes an optimal template by creating a linear combination of model stellar template spectra that yields the best fit to the galaxy spectrum. The linear combination coefficients of the templates weigh their contribution to the total stellar population and provide an estimate of the age and metallicity distribution of the galaxy. Our single stellar population (SSP) templates were obtained from the MILES library 111miles.iac.es (Sánchez-Blázquez et al., 2006; Vazdekis et al., 2010) assuming Chabrier IMF and broadened to match the resolution of our galaxy spectra. These templates were selected with metallicities [Fe/H] and a range of ages Gyr. We ruled out lower metallicities since they are very rare given the masses of our galaxies (Zahid et al., 2011).
We fitted each spectrum using a rest-frame range of approximately Å since the noise generated by the subtraction of sky OH lines washed out most features in the redder part of the observed wavelength range. Where applicable, we excluded the [OII] emission and uncorrected telluric absorption from the MOVEL fits. In order to account for the dominant photon noise in the final results, we performed Monte Carlo computations with 200 bootstrapped spectra. The output produced a distribution of values, whose mean and standard deviation give the value and error of the . For the objects 12019899 and 12024453 we calculated as the weighted mean of the values derived from the two different instrumental resolutions, which favors the higher resolution value due to its smaller error. The fits to the spectra are displayed in Fig. 1. Following Jørgensen et al. (1995), we apply an aperture correction to a diameter of 1.19 kpc, which increases our values around 6%. The final ’s are given in Table 1. We note that there exists publicly available DEEP2 spectra for all of our galaxies (Davis et al., 2007). The target 12024453 has already been part of the photometric and spectroscopic study by Fernández Lorenzo et
al. (2011), who find from a spectrum of per Å. This is consistent with our measurement. The rest of the DEEP2 spectra of galaxies in common with our sample have (S/N) per Å and cannot be used for reliable measurements.
2.4. Stellar Populations
The age and metallicity of each galaxy were determined from the values of the SSP model with the largest coefficient in the linear combination that best fitted the galaxy spectrum (see values in Table 1). These values show relatively low ages in the range of Gyr, with uncertainties estimated to be around 0.4 Gyr. In addition, we calculated photometric stellar masses using the data from the RAINBOW database222rainbowx.fis.ucm.es (Barro et al., 2011), which includes photometry for our galaxies in 30 bands covering a range from 150 nm up to 70 m. We fit these data to stellar population models by Bruzual
& Charlot (2003) with Chabrier IMF, assuming an extinction law from Calzetti et al. (2000). We constrain the metallicity in the same way than for the MOVEL templates. The results show solar metallicity for all galaxies and ages in the range of 0.7-1.7 Gyr. Such outcome is very similar to the results from MOVEL.
The galaxies 12024790 and 12024321 have [OII]3727 Å emission, implying ongoing or recent star formation. We combine the [OII] fluxes from our spectra with the rest-frame -corrected 24 m fluxes from RAINBOW to derive star formation rates (SFR) using the conversion from Kennicutt et al. (2009) based on Kroupa IMF. The total SFR[OII]+IR for the [OII] emission galaxies is 9.7 and 22.6 , respectively.
3. DISCUSSION
Dynamical masses are calculated under the assumption of homology as with (see Table 1), following studies of local ETGs (Cappellari et al., 2006). As noted in 2.2, the galaxy 12024790 shows a double peak in the [OII] emission. If such feature is due to rotation of a gaseous disk, it yields a projected velocity of , which is comparable to its measured . However, it is unlikely that this caused an important bias in the dynamical mass estimates. At it has been found that is robust against rotation up to (Cappellari et al., 2006, 2007), and there is no clear evidence that this would be different at (van der Wel
& van der Marel, 2008). Therefore, we assume that any deviations from homology due to possible rotational support are within the errors of our dynamical masses.
Our galaxies have values that are systematically smaller than the originally published stellar masses by an average factor of 6. This is much larger than the combined error of photometric stellar mass and radius (typically a factor of 3). Note that for the galaxy 12024321 these masses are consistent within uncertainties. The stellar population models we used with the RAINBOW data yield stellar masses in the range of log, on average a factor of 1.8 larger than the dynamical masses. The masses from RAINBOW are derived with the same IMF and stellar population models as in T07 but with a broader spectral range (UV-FIR) as described in 2.4. In order to investigate the large differences between both sets of masses, we also derived masses using only bands as in T07. We found no significant difference between our UV-FIR and masses, implying that the discrepancy with T07 cannot be simply explained by the use of a different spectral range. We also checked that our mass determinations are weakly sensitive to the choice of extinction model and small variations in metallicity. Barro et al. (2011) derive masses for hundreds of galaxies in T07’s sample using the full RAINBOW photometry. They find that, on average, their masses are consistent with those from T07. Therefore, the cause of the inconsistency with our photometric masses is unclear. Given the large uncertainties in the systematics of photometric masses, we adopt dynamical masses as the correct total mass estimates. Following local lensing studies (Gavazzi et al., 2007), we apply a fiducial dark matter fraction and recalculate the stellar masses as .
Comparison studies between stellar and dynamical mass of less dense ETGs than those in our sample have been conducted at low (Cappellari et al., 2006) and high redshifts (van der Wel et al., 2006) with the result of dynamical masses being on average equal or larger than stellar masses, as expected when considering a dark matter contribution. When van der Wel et al. (2006) calculate stellar masses using similar multi-band photometry and stellar population parameters as in T07, they find (Salpeter IMF). Therefore, our results point towards a systematic overestimation of the stellar masses used to select the galaxies of our sample. We cannot rule out a deviation from homology that requires . However, the theoretical expectation for objects with such high Sérsic index is (Cappellari et al., 2006; Bertin et
al., 2002), which would yield even smaller dynamical masses.
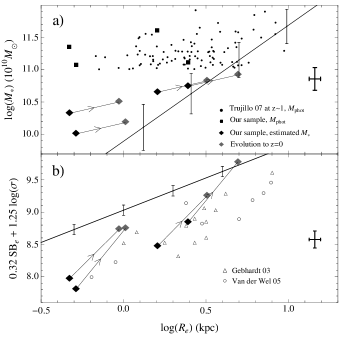
Fig. 2a shows the position of our objects in the stellar mass-size relation with the old/new stellar mass estimates. Fig. 2b shows our objects in the Fundamental Plane (FP). At a given , they have systematically larger masses and smaller combination of surface brightness (SBe) and than the respective local relations. Moreover, our objects follow a trend in which they lie further from both local relations at smaller radii. This result has also been found in clusters by Jørgensen et al. (2006, 2007). Compared to the FP derived by these authors, at a given our field sample shows a similar slope and a relative offset of mag towards brighter , which is in agreement with field galaxies having generally younger stellar populations than clusters of the same redshift.
In order to understand how our galaxies relate to low redshift ETGs, we investigate the simple evolutionary scenario based on passive luminosity fading of the stellar populations and growth via minor mergers that has been proposed for the general population of ETGs at (Gebhardt et al., 2003; Naab et al., 2009). To derive the amount of fading for our sample, we use Bruzual
& Charlot (2003) models with Chabrier IMF and the redshift, ages and metallicities from Table 1. Passive evolution from to results in an average dimming of 2 mag in SBe. We assume that the passive luminosity evolution does not affect . Minor mergers are very efficient growing the size at a given mass increment, slightly decreasing . According to the simulations by Naab et al. (2009), an ETG with and kpc would grow a factor of 1.5 in mass via minor mergers from to . We adopt this factor of mass growth for our galaxies. Following these authors, we model each merger as and , where the subindexes (i)/(f) denote initial/final values of the host galaxy and and the mass ratio take into account the accreted system (). We assume a history of four mergers with constant and for all galaxies (note that and the total mass growth set the total number of mergers). This choice of values is consistent with the simulations by Naab et al. (2009). The total change for and become factors of 2 and 0.8, respectively. These results are robust against variations in the values of and at the given total mass growth. We assume that the mass-to-light ratio does not change significantly after each merger. In addition, we assume that as the size increases, SBe decreases by (Hamabe
& Kormendy, 1987).
Fig. 2 shows the combined evolution of minor mergers and luminosity fading for our galaxies. Most of them reach positions that are consistent with the local FP and mass-size relations, considering the estimated uncertainties in our measurements. Therefore, this simple evolutionary scenario can plausibly describe the evolution in our sample galaxies to become normal ETGs at .
References
- Barro et al. (2011) Barro, G., et al. 2011, ApJS, 193, 13
- Barro et al. (2011) Barro, G., et al. 2011, ApJS, 193, 30
- Bertin et al. (2002) Bertin, G., Ciotti, L., & Del Principe, M. 2002, A&A, 386, 149
- Bruzual & Charlot (2003) Bruzual, G., & Charlot, S. 2003, MNRAS, 344, 1000
- Buitrago et al. (2008) Buitrago, F., Trujillo, I., Conselice, C. J., Bouwens, R. J., Dickinson, M., & Yan, H. 2008, ApJ, 687, L61
- Bundy et al. (2006) Bundy, K., et al. 2006, ApJ, 651, 120
- Calzetti et al. (2000) Calzetti, D., Armus, L., Bohlin, R. C., Kinney, A. L., Koornneef, J., & Storchi-Bergmann, T. 2000, ApJ, 533, 682
- Cappellari et al. (2006) Cappellari, M., et al. 2006, MNRAS, 366, 1126
- Cappellari et al. (2007) Cappellari, M., et al. 2007, MNRAS, 379, 418
- Cappellari et al. (2009) Cappellari, M., et al. 2009, ApJ, 704, L34
- Cardiel (1999) Cardiel, N. 1999, Ph.D. Thesis, Universidad Complutense de Madrid, Spain, (1999)
- Cenarro & Trujillo (2009) Cenarro, A. J., & Trujillo, I. 2009, ApJ, 696, L43
- Cepa (1998) Cepa, J. 1998, Ap&SS, 263, 369
- Daddi et al. (2005) Daddi, E., et al. 2005, ApJ, 626, 680
- Damjanov et al. (2009) Damjanov, I., et al. 2009, ApJ, 695, 101
- Davis et al. (2007) Davis, M., et al. 2007, ApJ, 660, L1
- di Serego Alighieri et al. (2005) di Serego Alighieri, S., et al. 2005, A&A, 442, 125
- Fernández Lorenzo et al. (2011) Fernández Lorenzo, M., Cepa, J., Bongiovanni, A., Pérez García, A. M., Ederoclite, A., Lara-López, M. A., Pović, M., & Sánchez-Portal, M. 2011, A&A, 526, A72
- Gavazzi et al. (2007) Gavazzi, R., Treu, T., Rhodes, J. D., Koopmans, L. V. E., Bolton, A. S., Burles, S., Massey, R. J., & Moustakas, L. A. 2007, ApJ, 667, 176
- Gebhardt et al. (2003) Gebhardt, K., et al. 2003, ApJ, 597, 239
- Hamabe & Kormendy (1987) Hamabe, M., & Kormendy, J. 1987, Structure and Dynamics of Elliptical Galaxies, 127, 379
- Hopkins et al. (2009) Hopkins, P. F., Hernquist, L., Cox, T. J., Keres, D., & Wuyts, S. 2009, ApJ, 691, 1424
- Hopkins et al. (2010) Hopkins, P. F., Bundy, K., Hernquist, L., Wuyts, S., & Cox, T. J. 2010, MNRAS, 401, 1099
- Jørgensen et al. (1995) Jørgensen, I., Franx, M., & Kjaergaard, P. 1995, MNRAS, 276, 1341
- Jørgensen et al. (1996) Jørgensen, I., Franx, M., & Kjaergaard, P. 1996, MNRAS, 280, 167
- Jørgensen et al. (2006) Jørgensen, I., Chiboucas, K., Flint, K., Bergmann, M., Barr, J., & Davies, R. 2006, ApJ, 639, L9
- Jørgensen et al. (2007) Jørgensen, I., Chiboucas, K., Flint, K., Bergmann, M., Barr, J., & Davies, R. 2007, ApJ, 654, L179
- Kennicutt et al. (2009) Kennicutt, R. C., et al. 2009, ApJ, 703, 1672
- Longhetti et al. (2007) Longhetti, M., et al. 2007, MNRAS, 374, 614
- Naab et al. (2009) Naab, T., Johansson, P. H., & Ostriker, J. P. 2009, ApJ, 699, L178
- Peng et al. (2002) Peng, C. Y., Ho, L. C., Impey, C. D., & Rix, H.-W. 2002, AJ, 124, 266
- Sánchez-Blázquez et al. (2006) Sánchez-Blázquez, P., et al. 2006, MNRAS, 371, 703
- Shen et al. (2003) Shen, S., Mo, H. J., White, S. D. M., Blanton, M. R., Kauffmann, G., Voges, W., Brinkmann, J., & Csabai, I. 2003, MNRAS, 343, 978
- Treu et al. (2005) Treu, T., Ellis, R. S., Liao, T. X., & van Dokkum, P. G. 2005, ApJ, 622, L5
- Trujillo et al. (2009) Trujillo, I., Cenarro, A. J., de Lorenzo-Cáceres, A., Vazdekis, A., de la Rosa, I. G., & Cava, A. 2009, ApJ, 692, L118
- Trujillo et al. (2007) Trujillo, I., Conselice, C. J., Bundy, K., Cooper, M. C., Eisenhardt, P., & Ellis, R. S. 2007, MNRAS, 382, 109
- Trujillo et al. (2011) Trujillo, I., Ferreras, I., & de la Rosa, I. G. 2011, arXiv:1102.3398
- Trujillo et al. (2006) Trujillo, I., et al. 2006, ApJ, 650, 18
- van der Wel et al. (2005) van der Wel, A., Franx, M., van Dokkum, P. G., Rix, H.-W., Illingworth, G. D., & Rosati, P. 2005, ApJ, 631, 145
- van der Wel et al. (2006) van der Wel, A., Franx, M., Wuyts, S., van Dokkum, P. G., Huang, J., Rix, H.-W., & Illingworth, G. D. 2006, ApJ, 652, 97
- van der Wel & van der Marel (2008) van der Wel, A., & van der Marel, R. P. 2008, ApJ, 684, 260
- van Dokkum et al. (2009) van Dokkum, P. G., Kriek, M., & Franx, M. 2009, Nature, 460, 717
- van Dokkum et al. (2010) van Dokkum, P. G., et al. 2010, ApJ, 709, 1018
- Vazdekis et al. (2010) Vazdekis, A., Sánchez-Blázquez, P., Falcón-Barroso, J., Cenarro, A. J., Beasley, M. A., Cardiel, N., Gorgas, J., & Peletier, R. F. 2010, MNRAS, 404, 1639
- Zahid et al. (2011) Zahid, H. J., Kewley, L. J., & Bresolin, F. 2011, ApJ, 730, 137