Ferromagnetic Quantum Critical Endpoint in UCoAl
Abstract
Resistivity and magnetostriction measurements were performed at high magnetic fields and under pressure on UCoAl. At ambient pressure, the 1st order metamagnetic transition at from the paramagnetic ground state to the field-induced ferromagnetic state changes to a crossover at finite temperature . With increasing pressure, linearly increases, while decreases and is suppressed at the quantum critical endpoint (QCEP, , ). At higher pressure, the value of identified as a crossover continuously increases, while a new anomaly appears above at higher field in resistivity measurements. The field dependence of the effective mass () obtained by resistivity and specific heat measurements exhibits a step-like drop at at ambient pressure. With increasing pressure, it gradually changes into a peak structure and a sharp enhancement of is observed near the QCEP. Above , the enhancement of is reduced, and a broad plateau is found between and . We compare our results on UCoAl with those of the ferromagnetic superconductor UGe2 and the itinerant metamagnetic ruthenate Sr3Ru2O7.
1 Introduction
Metamagnetism and quantum criticality in strongly correlated electron systems have attracted much interest as new quantum phases are expected. They can be related to unconventional superconductivity, non-Fermi liquid behavior and nematic phases. In the case of antiferromagnetic (or nearly antiferromagnetic) compounds, the metamagnetic transition in heavy fermion systems is well documented. [1, 2] A prototype material is CeRu2Si2 where a pseudo-metamagnetic transition occurs at and the quantum critical endpoint (QCEP) at which the 1st order metamagnetism collapses exists at negative pressure, as seen in Ce0.925La0.075Ru2Si2. [3, 4]
On the other hand, in itinerant ferromagnets, the metamagnetic transition from the paramagnetic ground state to the field-induced ferromagnetic state could occur when the system is tuned into the paramagnetic ground state at zero field. Well-known systems are the itinerant ferromagnets UGe2 [5, 6], ZrZn2 [7], and the nearly ferromagnetic compound Sr3Ru2O7 [8]. In particular, UGe2 is an interesting system, because unconventional superconductivity coexisting with ferromagnetism appears near the critical pressure, [9] and the superconducting phase is enhanced by the metamagnetic transition between two ferromagnetic phases, FM1 and FM2. [10] Recently we have investigated the ferromagnetic QCEP of UGe2 by resistivity and Hall effect measurements, and have concluded that the QCEP exists at and at . [5, 6] However severe experimental conditions, namely the high field, very low temperature and high pressure, prevent us from performing precise experiments above the QCEP to date. Therefore it is important to find new systems which can be easily tuned to the QCEP. In this paper, we demonstrate that UCoAl is an ideal system for this kind of study.
UCoAl crystallizes in a hexagonal structure with ZrNiAl-type (space group: , No. 189) without inversion symmetry. Applying the magnetic field along the -axis, the paramagnetic ground state becomes a field induced ferromagnetic state through the metamagnetic transition at , with an induced magnetic moment . [11] The magnetization curve is very anisotropic between -axis and -axis, indicating Ising-like behavior. By doping with Y as a negative pressure or by applying uniaxial stress, [12, 13] ferromagnetism appears, indicating that UCoAl is in proximity to ferromagnetic order. The critical pressure where the Curie temperature is suppressed to zero will be negative () [14] and the ground state at ambient pressure is already the paramagnetic one. linearly increases with increasing hydrostatic pressure. [14] The metamagnetic transition at is identified to be of 1st order by the clear hysteresis between increasing and decreasing fields. Applying pressure, this hysteresis starts to be suppressed, which may suggest that the 1st order transition will terminate at a QCEP. However there are no experimental reports which clarify the existence of the QCEP at high pressures above . Here we report the experimental evidence for the QCEP in UCoAl detected by resistivity and magnetostriction measurements at high fields and at high pressures.
2 Experimental
Single crystals of UCoAl were grown using the Czochralski method in a tetra-arc furnace. The starting materials of U (purity: -3N5) , Co (3N) and Al (5N) were melted on a water-cooled copper hearth under a high purity Ar atmosphere gas. The ingot was turned over and was melted again. This process was repeated several times in order to obtain a homogeneous polycrystalline ingot. The ingot was subsequently pulled with a rate of for single crystal growth. The obtained single crystal ingot was cut using a spark cutter and was oriented by X-ray Laue photograph, displaying very sharp Laue spots. The resistivity using a sample with rectangular shape (, -axis long) was measured by a four probe AC method () for the electrical current along direction (-axis) at low temperatures down to and at high fields up to for the field along direction (-axis). The residual resistivity ratio (RRR) was approximately . The magnetostriction was measured using strain gauges by the active dummy method with a wheatstone bridge at temperatures down to using a lock-in amplifier (). The gauge was glued on the surface of the sample with the dimension of , so that it detects the dilatation along the -axis (). Both resistivity and magnetostriction measurements were performed under pressure up to using a CuBe-NiCrAl hybrid type piston cylinder cell with Daphne oil 7373 as a pressure medium. The pressure was determined by the superconducting transition temperature of Pb. The sharp transition assures that the pressure gradient is small () for all pressure range. However, the pressure gradient for magnetostriction measurements with a relatively large sample is larger, which is approximately in maximum. [15] The Daphne oil 7373 solidifies at at room temperature, [16] thus the hydrostaticity is good at least up to at low temperatures. For comparison with the field dependence of the resistivity coefficient, the specific heat was measured by the relaxation method at ambient pressure under magnetic field up to and at low temperature down to . Angular dependences of from -axis to -axis () were also measured at ambient pressure by magnetization and magnetostriction. The magnetization was measured at temperatures down to and at magnetic fields up to using a SQUID magnetometer. The magnetostriction was measured employing the same manner as under pressure at temperatures down to and at fields up to using a horizontal-axis sample rotator.
3 Experimental results
3.1 Ambient pressure and angular dependence
Figure 1 show the susceptibility and magnetization at . A very anisotropic susceptibility response is found between and -axis, indicating the Ising-type behavior, which is in good agreement with the previous results. [17, 18, 19] For -axis, the susceptibility shows a broad maximum around , while no anomaly is observed for -axis. This behavior is typical for heavy fermion systems, such as CeRu2Si2, UPt3, URu2Si2. Applying the magnetic field along -axis at low temperature, a sharp metamagnetic 1st order transition is observed at , with a hysteresis between the upsweep and downsweep measurements.
First we focus on the angular dependence of the metamagnetic transition, since in the well-known ferromagnetic systems, such as URhGe [20, 21, 22, 23], UCoGe [24, 25, 26] and Sr3Ru2O7 (nearly ferromagnetic compound) [27], the field angle is found to be a tuning parameter for the quantum singularities, as pressure is. By increasing the field angle from -axis to -axis, shifts to higher fields proportional to . It should be noted that the induced moment just above decreases with , which roughly follows dependence. This is different from the pressure response of magnetization up to for -axis, where the induced moment just above remains almost at the same value, , while is monotonously increased with pressure. [14] The field angle response is obviously different from the pressure response in UCoAl.
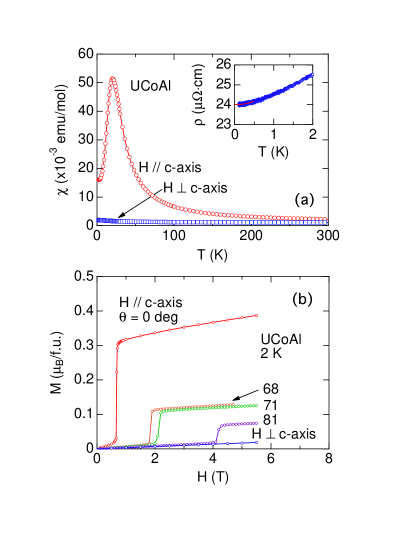
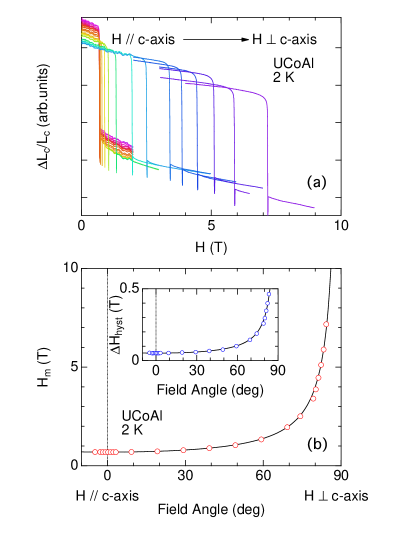
Figure 2(a) show the field dependence of the magnetostriction for different field angles at . Sharp drops of magnetostriction due to the metamagnetic transition in agreement with the previous results [28] are observed at , which is increased with increasing field angle. As shown in Fig. 2(b), increases following a dependence, at least up to at . The magnitude of the jump of magnetostriction retains a large value even at high field angles. Furthermore the hysteresis at , also increases with field angle, following the dependence, as shown in the inset of Fig. 2(b). It is noted that the width of metamagnetic transition () shows no significant increase with field angle, indicating that the sharp metamagnetic transition is retained up to . These results indicate that the 1st order nature is very robust against the field angle, which cannot be a tuning parameter to a QCEP in UCoAl at least at ambient pressure.
It should be noted that Fermi liquid properties are observed in the resistivity measurements, as shown in the inset of Fig. 1(a), where the resistivity follows the dependence below , in good agreement with very low temperature specific heat data. [18]. Thus, the achievement of a very low temperature () is a necessary condition to observe the Fermi liquid regime at ambient pressure.
3.2 Pressure study
Figure. 3(a) shows the field dependence of the magnetoresistance at ambient pressure for different constant temperatures. Anomalies due to the metamagnetic transition from the paramagnetic state to the field-induced ferromagnetic state are clearly observed around . The anomaly with a small step-like decrease at low temperatures gradually changes into a sharp peak around . Further increasing temperature, the anomaly is smeared out. Figure 3(b) shows the temperature variation of . slightly shifts to higher fields with increasing temperature implying that the ferromagnetic correlations play a main role for the metamagnetism in UCoAl, as observed just above in UGe2. [5] At low temperatures, is obviously identified as the 1st order transition, since hysteresis between the upsweep- and the downsweep-field is observed in magnetoresistance. With increasing temperature, changes from 1st order to a crossover at . Here we determined from the field derivative of magnetoresistance, . As shown in the inset of Fig. 3(b), reveals sharp maximum and minimum below and above . When the peak-to-peak amplitude of becomes maximum, meaning an acute peak of the magnetoresistance, we define this temperature as . In Fig. 3, is found to be . This value is in good agreement with that obtained from the hysteresis of in the magnetostriction measurements, as mentioned later, supporting the validity of our definition for .
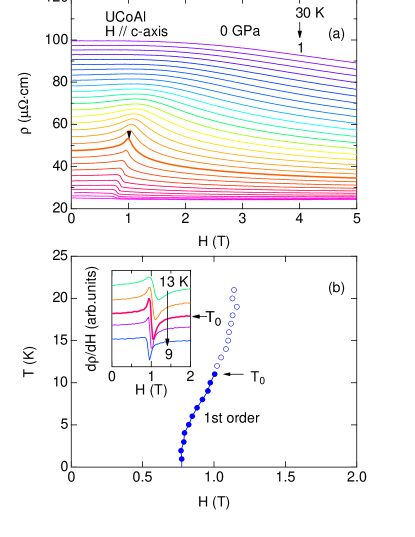
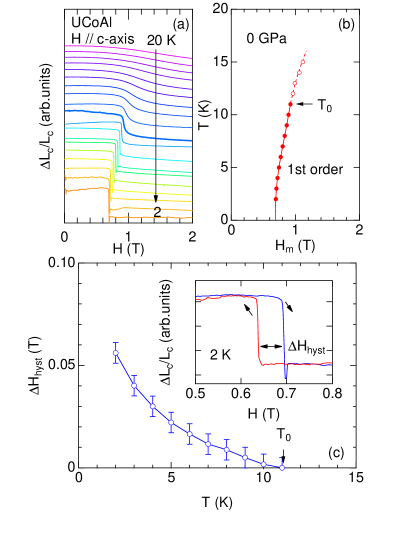
Figure 4(a) shows the field dependence of the magnetostriction at ambient pressure for different constant temperatures. Sharp drops of the magnetostriction are observed at at low temperatures. This is in good agreement with the previous report. [28] At high temperatures, the anomalies at become broad and finally they are smeared out. As shown in the inset of Fig.4(c), a hysteresis () is clearly observed at between up and down field sweeps indicating the 1st order transition at low temperatures. decreases with increasing temperatures and finally becomes zero at , which is in good agreement with the value obtained by the magnetoresistance measurements as shown in Fig. 3. The transition at changes to a crossover above .
As shown in Fig. 5, the hysteresis is suppressed by applying pressure. With increasing pressure, at is markedly suppressed from at ambient pressure to at . No hysteresis was observed at higher pressures (). Correspondingly, decreases with pressures. It is, however, difficult to evaluate the value of precisely for different pressures, because is too small for the magnetostriction measurements using strain gauges, giving rise to relatively large error bars of . Nevertheless, the present results imply that the 1st order transition at will terminate at high pressure probably above .
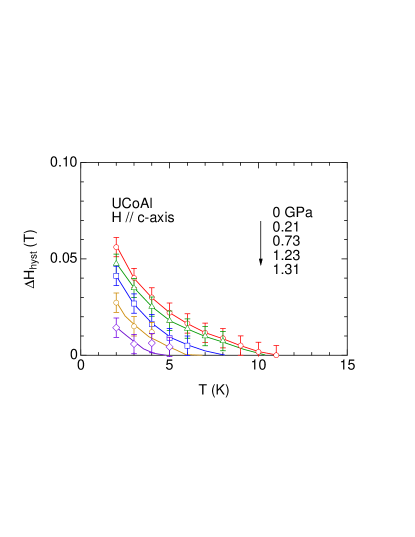
Figure 6(a) shows the field dependence of the magnetostrictions at at various pressures. Increasing pressure, increases linearly to high fields and reaches at . Here we define from a midpoint of the magnetostriction jump. The amplitude of the jump () decreases with pressure and most likely remains constant above , as shown in Fig. 6(b). On the other hand, the transition width () is almost constant or slightly increases up to , and then rapidly increases with further increasing pressure, as shown in Fig. 6(c). One can speculate that the quantum critical endpoint (QCEP) is located around . At first aprroximatation, the magnetic contribution of the magnetovolume effect is related to the magnetization via the relation, . According to the previous magnetization measurements under pressure up to , [14] the initial slope of magnetization is unchanged, but increases with pressure, while the induced moment above is constant (). The present results in Fig. 6 should be related to the pressure response of magnetization curve.
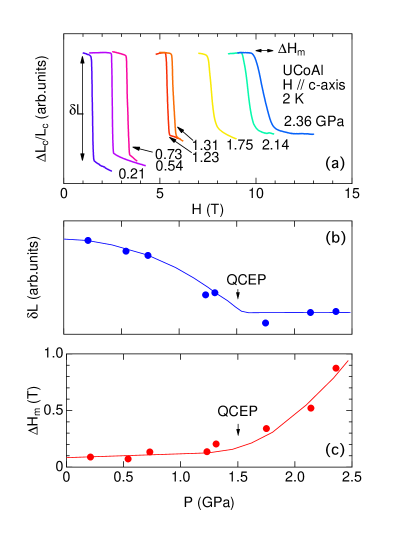
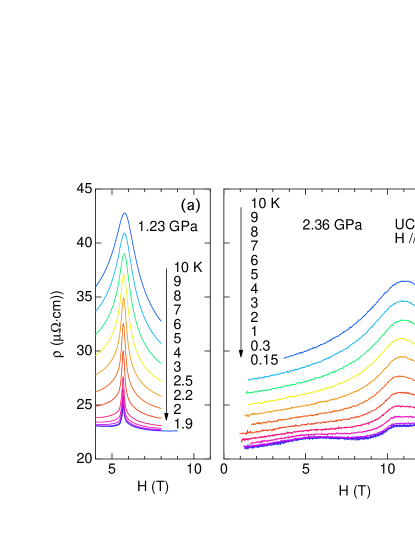
Figure 7 shows the magnetoresistance at different constant temperatures at two different pressures below and above . At (), the magnetoresistance shows the very sharp peak at at , which is quite different from that at ambient pressure where the step-like behavior is observed at low temperatures. From the analysis of as in the inset of Fig. 3(b), at is found to be , which is reduced from the original value, at ambient pressure.
On the other hand, at (), the magnetoresistance shows a plateau around at low temperatures. Two kinks are observed at and at the lowest temperature. The former kink at is fairly in good agreement with the results of magnetostriction as shown in Fig. 6(a). However, the latter kink at was only observed in the magnetoresistance measurements, while no anomaly was detected at in the magnetostriction measurements. Two kinks are merged and broaden at high temperatures. Interestingly, another broad hump is observed around only at low temperatures.
From the temperature dependence of the resistivity at constant field, we determined the field dependence of the resistivity coefficient and the residual resistivity at different pressures, as shown in Fig. 8(b)(c). Here the resistivity is described by . Considering the Kadowaki-Woods relation (, : Sommerfeld coefficient) based on the existence of the strong local fluctuation, the field dependence of the coefficient corresponds to that of the square of the effective mass (). For comparison, the field dependence of the -value at ambient pressure estimated from the measurements at is also shown in Fig. 8(a). The results are consistent with the previous results [18] The -value at zero field is , which is almost unchanged up to . Further increasing field, the -value is abruptly reduced down to and is almost constant up to . It should be noted that the slight upturn at high fields is due to the hyperfine contribution from Co and Al. This is roughly consistent with the field dependence of coefficient at ambient pressure shown in Fig. 8(a). However, the normalization to the high field limit will lead to an enhancement of at zero field in agreement with the enhancement of with respect to in ferromagnetic spin fluctuation theory.
With increasing pressure, the field dependence of the coefficient is drastically changed, as shown in Fig. 8(b). increases linearly with field, and the coefficient at zero field is suppressed with pressure. Instead, the peak structure at becomes pronounced. At , the coefficient reveals a very sharp peak at , which is approximately three times larger than that at zero field. Further increasing pressure, the peak value of coefficient is reduced and the width of the peak is significantly increased. Above , the coefficient exhibits a plateau.
In order to see the pressure evolution of the coefficient more clearly, we plot the pressure dependence of the coefficient at and at zero field, as shown in Fig. 9. The coefficient at zero field, , monotonously decreases in Fig. 9(b), indicating that the pressure drives UCoAl away from the critical region. On the other hand, the coefficient at , , shows a maximum around the QCEP. If we take the ratio, , the enhancement of at QCEP is more significant, as shown in Fig. 9(c). It is interesting to note that the value of seems to remain constant above .
The residual resistivity shows a plateau, as well (see Fig. 8(c)). The kink of the plateau at lower field, for example, at corresponds to the continuation of , which was detected by the magnetostriction (see Fig. 6(a)). However, the kink of the plateau at higher field (ex. at ) was detected only by the resistivity, but the magnetostriction down to shows no anomaly. Interestingly, the residual resistivity exhibits a sharp peak around . This is in good agreement with the prediction of residual resistivity enhancement at the ferromagnetic singularity [29]. Furthermore, a broad anomaly is observed around at , which shifts to lower field with decreasing pressure. These broad anomalies might be explained by the competitive phenomena between the scattering near and the orbital effect of transverse magnetoresistance, which is related to the value of where () and are the cyclotron frequency and the scattering lifetime, respectively.
It should be noted that temperature range where the resistivity follows a relation becomes narrower around QCEP, as shown in Fig. 10. For example, at , behavior was observed only up to at . An interesting point is to investigate the critical exponent of resistivity at the QCEP, which is left for future studies of precise resistivity measurements.
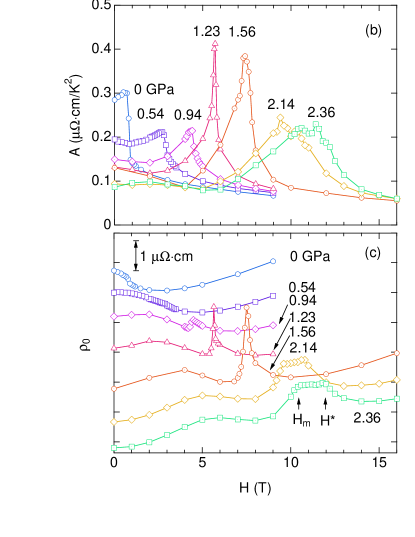
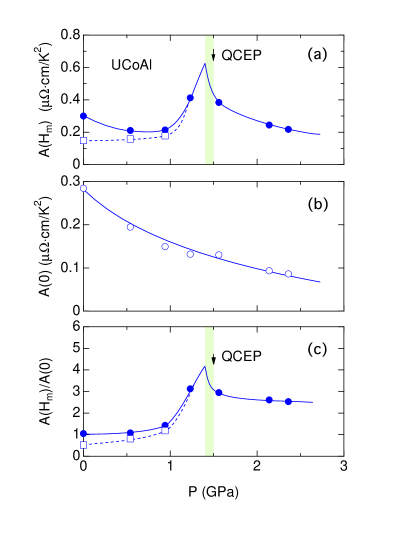
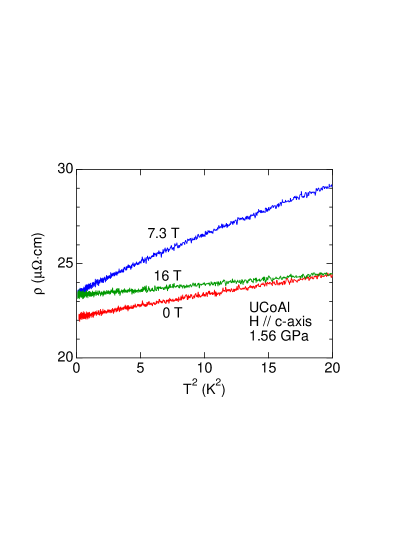
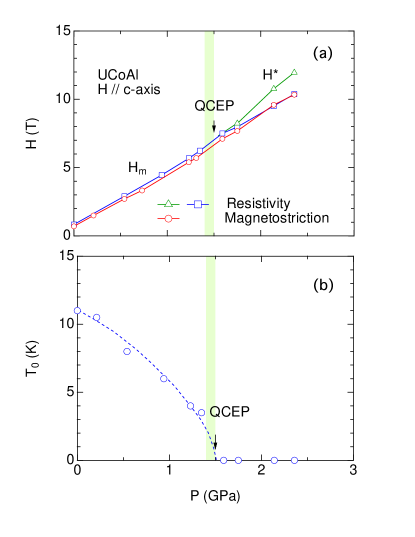
Figure 11 shows the pressure dependence of extrapolated to obtained by the magnetoresistance and magnetostriction measurements. is almost linearly increased with pressure up to at . The value of from the resistivity measurements almost coincides with that from the magnetostriction measurements, although of resistivity is slightly higher than that of magnetostriction, which is most likely due to the slight pressure inhomogeneity in the pressure cell. Above , the magnetostriction shows the linear increase of continuously, while the magnetoresistance shows the split corresponding to the plateau of the residual resistivity. The lower field anomaly is in good agreement with the results of magnetostriction.
Figure 11(b) shows the pressure dependence of at which the 1st order transition of terminates and changes into a crossover. The value was evaluated by the field derivative of magnetoresistance, as shown in the inset of Fig. 3(b). decreases with pressure, and collapses around , indicating that the 1st order transition at terminates at , and a new phase appears above .
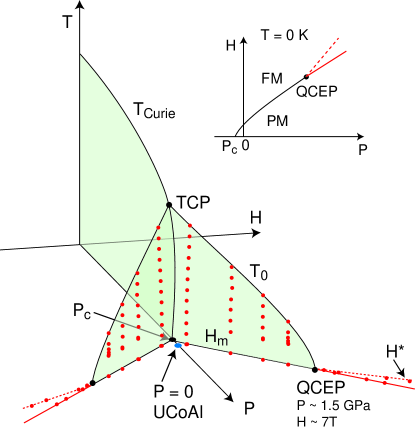
As a summary of pressure experiments, we schematically show in Fig. 12 the temperature–pressure–field phase diagram of UCoAl, together with the field–pressure phase diagram at . The critical point where is suppressed to is at a negative pressure () in UCoAl. At the tricritical point (TCP), bifurcates and the 1st order plane appears. When the magnetic field is applied at ambient pressure, UCoAl crosses the 1st order plane, which corresponds to the metamagnetic transition from paramagnetic ground state to the field-induced ferromagnetic state. The temperature, which is located on the 1st order plane at finite temperature, corresponds to . Increasing pressure, increases linearly and meets with QCEP where is suppressed to . At QCEP, the effective mass shows the acute enhancement. At higher pressure , increases continuously as a crossover, which can be observed both by resistivity and by magnetostriction. From the QCEP, a new transition or crossover line at which was detected in appears and deviates from the original line.
4 Discussion
A general treatment [31] implies that the ferromagnetic phase diagram with a strong decrease of near will be extended in magnetic field by a first order line which will terminate at a pressure higher than . In a conventional approach, the paramagnetic–ferromagnetic transition at has been described with special features in the density of states such as a double peak structure or van Hove singularity. [32, 33, 34] It has also been treated in spin fluctuation theory assuming Fermi surface invariance through or quite generally by considering excitations at the Fermi level which introduce non-analytic corrections in the Landau expression of the free energy [30, 35, 36] It was, however, recently stressed that a strong modification of the Fermi surface can occur at . A recent calculation assuming that a Lifshitz transition may occur at shows that the ferromagnetic wing structure on the phase diagram will be strongly affected in this case. [37]
Here we compare the present results of UCoAl with those recently obtained for the other Ising ferromagnet UGe2. At ambient pressure, UGe2 has a high Curie temperature associated with a large ferromagnetic ordered moment . The tricritical point (TCP) is located at and . The ferromagnetism disappears at at zero field via a sharp drop of the magnetization with a 1st order nature. [38] Due to the large value of in UGe2, the QCEP is achieved at high pressure () and high field ().
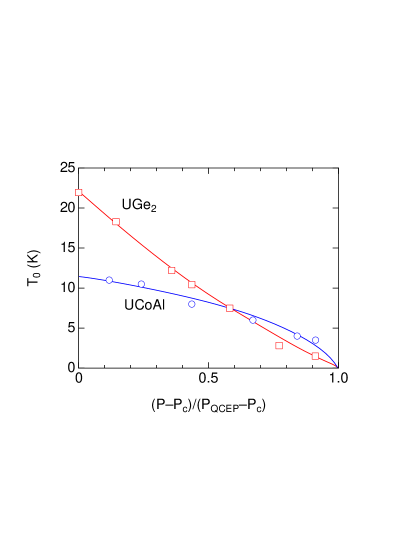
Figure 13 shows the pressure dependence of as a function of the scaled pressure, in UCoAl and UGe2 [6]. In UGe2, has an upward (concave) curvature, while in UCoAl shows a downward (convex) curvature. This difference might correspond to a difference of Fermi surface dimensionality between the two compounds. In the ferromagnetic state of UGe2, both dHvA experiments [39, 40, 41, 42, 43, 44] and band structure calculation [45, 46] show a quasi-two dimensional Fermi surface at least for a main dHvA branch. Such lower dimensionality can explain the upward curvature of . [35] Up to now, there are no reports concerning Fermi surface topology on UCoAl, although band structure calculations have been reported. [47, 48] However, three dimensionality is expected from the crystal structure. It should be noted that the crystal structure without inversion symmetry in UCoAl may also affect the pressure response of .
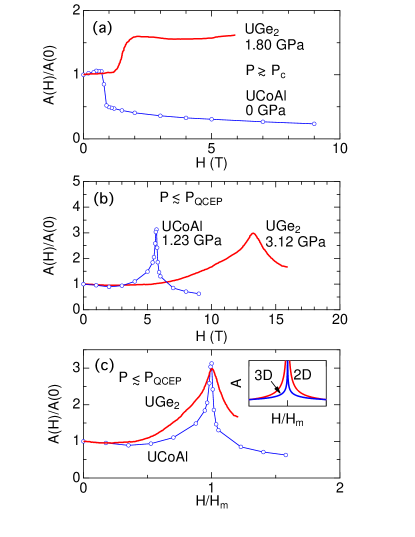
The difference between the two compounds is confirmed by the field dependence of the resistivity coefficient, as shown in Fig. 14. In UGe2, the coefficient shows a step-like increase at at pressures just above (), [6] as shown in Fig.14(a), while the coefficient near in UCoAl shows a step-like decrease at . However, near , the field dependence of the coefficient for both UCoAl and UGe2 shows a similar peak structure at , where the enhanced values for both compounds are three times larger than those at zero field, although the peak of UCoAl is much shaper than that of UGe2. This observation is consistent with the effect of lower dimensionality in UGe2. It is indeed predicted as for (3D system) and for (2D system), [35] as shown in the inset of Fig. 14(c) but for both cases, the data cannot be fully fitted with a spin fluctuation approach. A possible reason might be unusual critical exponent around . The present results of coefficient are obtained, assuming that the resistivity follows at low temperatures just above . More precise measurements at lower temperatures is left for the future study. That will allow a definitive comparison with a spin fluctuation approach.
The difficult question is possible changes of the Fermi surface at . In UGe2, the drastic change of the Fermi surface between the paramagnetic state and the ferromagnetic state (FM1) was directly observed by de Haas-van Alphen (dHvA) experiments. [40, 41, 42, 43, 44] Nevertheless, it is still an open question whether the Fermi surface changes near the QCEP because of the large values of and . The change of Fermi surface associated with a Lifshitz transition near might be a possible origin for the deviation of and from the spin fluctuation theory.
Up to now, no clear quantum oscillation experiments has been reported for UCoAl. However, the Hall coefficient and thermopower coefficient at ambient pressure reveal a drastic change through , [49] also suggesting a change of Fermi surface. An interesting point in UCoAl is that the measurements can be easily achieved far above .
A new feature in the present study is that further increasing pressure above QCEP, the transition line continues as a crossover line from the 1st order metamagnetic transition and a new high field phase appears. Theoretically, a new mechanism caused by the topological change of Fermi surface related to the Lifshitz-type transition is proposed at QCEP, where the unusual behavior (, : susceptibility, : magnetization) is predicted. [37, 50]
Another interesting result is that the field dependence of appears to have a plateau for associated with a plateau in the field dependence of . For example at , the plateau extends from to . It should be noted that the present experimental setup means transverse magnetoresistance, which can be affected by the orbital effect of the cyclotron motion, namely (). If the orbit is associated with van Hove singularity and a Lifshitz transition, a feedback can occur on the variation of the cyclotron effective mass .
In general, a field sweep on a system with a sharp singularity in the density of states can lead to a large variety of phenomena: collapse or change of interactions (balance between ferromagnetic and antiferrmagnetic channel), field dependence of local fluctuations (Kondo effect and valence fluctuations) [1, 51] and field evolution of Fermi surfaces (Lifshitz transition and/or Pauli depairing of small Fermi surface sheets). [52, 53, 54] A recent appealing possibility will be the occurrence of nematic phase as suggested in Sr3Ru2O7 [55, 56]
A simple way to understand the plateau is to assume two different contributions; one is located at and the other is located at . For example, through the studies of metamagnetic phenomena in CeRu2Si2 family, a plateau of the field dependence of effective mass is detected in Ce(Ru0.92Rh0.08)2Si2 between and . [57] The details will be published elsewhere. In the pure system CeRu2Si2, it is known that two singularities attributed to antiferromagnetic fluctuations and the ferromagnetic fluctuations occur at the same field [4], as detected by neutron scattering experiments. [58] However, in Ce(Ru0.92Rh0.08)2Si2, two singularities might be separated. Although the microscopic experimental evidence is not yet obtained, the simple image is that the nature of antiferromagnetic order is strongly modified by Rh-doping going from the transverse (La-doping) to longitudinal antiferromagnetic mode at zero field. However, the fact that the magnetic field favors the transverse mode in antiferromagnetic correlations leads to a switch in the paramagnetic phase with only strong antiferromagnetic correlations at ; the subsequent crossing through a regime dominated by ferromagnetic fluctuations occurs at which is higher than . In UCoAl, similar two contributions may give rise to the plateau of effective mass.
The plateau observed in UCoAl above has some similarities with the results of Sr3Ru2O7, which are interpreted as a signature of a nematic fluid which is characterized as a translationally invariant metallic phase with a spontaneously generated spatial anisotropy. [56] This proposal supports the idea that strongly correlated electrons can self-organize in quite different fashions and the metamagnetism here is not the only possibility. The possibility of a nematic phase in Sr3Ru2O7 has been mainly given by the field-angle tuned magnetoresistance and the anisotropy. [55] Recent pressure experiments have clearly shown that the uniform magnetization density is not the order parameter near QCEP but clear signatures of nematic phase were not observed. [59] It is worthwhile to remark that UCoAl is a Ising 3D system with respect to the Fermi surface properties, while Sr3Ru2O7 is a Heisenberg type with 2D Fermi surfaces. As shown in Figs. 1 and 2, UCoAl has strong Ising nature where strongly increases with a dependence, while in Sr3Ru2O7 shows the moderate increase from for -plane to for -axis. Basically, in UCoAl at least at low pressures, the key ingredient is the component of the magnetization along the -axis. There is no relation between field-angle and pressure for singularities. An interesting question is whether the Ising type behavior is changed into the quasi-Heisenberg type at high pressure above QCEP, together with the topological change of Fermi surface. A conservative view is to assume that the Ising character is preserved through QCEP and thus the plateau observed above cannot be associated with a nematic phase. Key experiments will be magnetization, Hall effect, and thermopower measurements under pressure at high fields. If UCoAl will be a weak ferromagnet, as it is the case for URhGe [21, 22, 23] and UCoGe [25, 60] one can expect that transverse field perpendicular to will have strong effect on the ferromagnetic instability. Here excellent agreement is found with the view that tilting the field-angle only modifies the Zeeman energy.
5 Summary
We grew single crystals of UCoAl and performed resistivity and magnetostriction measurements under pressure up to and at high fields up to . The metamagnetic transition at changes from the 1st order at low temperature to the crossover at high temperature. The critical temperature is determined by the field sweep of resistivity and magnetostriction measurements. With increasing pressure, monotonously increases, while decreases and is suppressed at the quantum critical endpoint (QCEP). The field dependence of the effective mass detected by the resistivity coefficient reveals the acute enhancement at QCEP at . Further increasing pressure, increases continuously as the crossover, which was detected both by resistivity and magnetostriction. The resistivity measurements exhibit another new anomaly at higher field than at pressures above . Our experiments show that UCoAl will be a key example of field-induced state built from ferromagnetic fluctuations. Its rather low values of and will allow one to perform a large variety microscopic and macroscopic experiments, which can provide definitive conclusions on the properties of QCEP and in the plateau regime detected at .
Acknowledgements
We thank H. Harima, L. Malone and A. P. Mackenzie for useful discussions. This work was supported by ERC starting grant (NewHeavyFermion), French ANR project (CORMAT, SINUS, DELICE).
References
- [1] J. Flouquet: Progress in Low Temperature Physics, ed. W. P. Halperin (Elsevier, Amsterdam, 2006) p. 139.
- [2] J. Flouquet, D. Aoki, W. Knafo, G. Knebel, T. D. Matsuda, S. Raymond, C. Proust, C. Paulsen and P. Haen: J. Low Temp. Phys. 161 (2010) 83.
- [3] R. A. Fisher, C. Marcenat, N. E. Phillips, P. Haen, F. Lapierre, P. Lejay, J. Flouquet and J. Voiron: J. Low Temp. Phys. 84 (1-2) (1991) 49.
- [4] D. Aoki, C. Paulsen, T. D. Matsuda, L. Malone, G. Knebel, P. Haen, P. Lejay, R. Settai, Y. Ōnuki and J. Flouquet: J. Phys. Soc. Jpn. 80 (2011) 053702.
- [5] V. Taufour, D. Aoki, G. Knebel and J. Flouquet: Phys. Rev. Lett. 105 (21) (2010) 217201.
- [6] H. Kotegawa, V. Taufour, D. Aoki, G. Knebel and J. Flouquet: to be published in J. Phys. Soc. Jpn.
- [7] M. Uhlarz, C. Pfleiderer and S. M. Hayden: Phys. Rev. Lett. 93 (25) (2004) 256404.
- [8] S. A. Grigera, R. S. Perry, A. J. Schofield, M. Chiao, S. R. Julian, G. G. Lonzarich, S. I. Ikeda, Y. Maeno, A. J. Millis and A. P. Mackenzie: Science 294 (2001) 329.
- [9] S. S. Saxena, P. Agarwal, K. Ahilan, F. M. Grosche, R. K. W. Haselwimmer, M. J. Steiner, E. Pugh, I. R. Walker, S. R. Julian, P. Monthoux, G. G. Lonzarich, A. Huxley, I. Sheikin, D. Braithwaite and J. Flouquet: Nature 406 (2000) 587.
- [10] I. Sheikin, A. Huxley, D. Braithwaite, J. P. Brison, S. Watanabe, K. Miyake and J. Flouquet: Phys. Rev. B 64 (2001) 220503.
- [11] A. V. Andreev, R. Z. Levitin, Y. F. Popov and R. Y. Yumaguzhin: Sov. Phys. Solid State 27 (1985) 1145.
- [12] A. V. Andreev, K. Koyama, N. V. Mushnikov, V. Sechovský, Y. Shiokawa, I. Satoh and K. Watanabe: J. Alloys Comp. 441 (2007) 33.
- [13] Y. Ishii, M. Kosaka, Y. Uwatoko, A. V. Andreev and V. Sechovský: Physica B 334 (2003) 160.
- [14] N. V. Mushnikov, T. Goto, K. Kamishima, H. Yamada, A. V. Andreev, Y. Shiokawa, A. Iwao and V. Sechovský: Phys. Rev. B 90 (1999) 6877.
- [15] K. Koyama-Nakazawa, M. Koeda, M. Hedo and Y. Uwatoko: Rev. Sci. Instr. 78 (2007) 066109.
- [16] K. Yokogawa, K. MURATA, H. Yoshino and S. Aoyama: Jpn. J. Appl. Phys. 46 (2007) 3636.
- [17] L. Havela, A. V. Andreev, V. Sechovský, I. K. Kozlovskaya, K. Prokeš, P. Javorský, M. I. Bartashevich, T. Goto and K. Kamishima: Physica B 230-232 (1997) 98.
- [18] T. D. Matsuda, Y. Aoki, H. Sugawara, H. Sato, A. V. Andreev and V. Sechovsky: J. Phys. Soc. Jpn. 68 (1999) 3922.
- [19] N. V. Mushnikov, A. V. Andreev, T. Goto and V. Sechovský: Philos. Mag. B 81 (2001) 569.
- [20] D. Aoki, A. Huxley, E. Ressouche, D. Braithwaite, J. Flouquet, J.-P. Brison, E. Lhotel and C. Paulsen: Nature 413 (2001) 613.
- [21] F. Lévy, I. Sheikin and A. Huxley: Nature Physics 3 (2007) 460.
- [22] A. Miyake, D. Aoki and J. Flouquet: J. Phys. Soc. Jpn. 78 (2009) 063703.
- [23] D. Aoki, T. D. Matsuda, F. Hardy, C. Meingast, V. Taufour, E. Hassinger, I. Sheikin, C. Paulsen, G. Knebel, H. Kotegawa and J. Flouquet: J. Phys. Soc. Jpn. 80 (2011) SA008.
- [24] N. T. Huy, A. Gasparini, D. E. de Nijs, Y. Huang, J. C. P. Klaasse, T. Gortenmulder, A. de Visser, A. Hamann, T. Görlach and H. v. Löhneysen: Phys. Rev. Lett. 99 (2007) 067006.
- [25] D. Aoki, T. D. Matsuda, V. Taufour, E. Hassinger, G. Knebel and J. Flouquet: J. Phys. Soc. Jpn. 78 (2009) 113709.
- [26] Y. Ihara, T. Hattori, K. Ishida, Y. Nakai, E. Osaki, K. Deguchi, N. K. Sato and I. Satoh: Phys. Rev. Lett. 105 (2010) 206403.
- [27] S. A. Grigera, R. A. Borzi, A. P. Mackenzie, S. R. Julian, R. S. Perry and Y. Maeno: Phys. Rev. B 67 (2003) 214427.
- [28] F. Honda, T. Kagayama, G. Oomi, L. Havela, V. Sechovský and A. Andreev: Physica B 284-288 (2000) 1299.
- [29] K. Miyake and O. Narikiyo: J. Phys. Soc. Jpn. 71 (3) (2002) 867.
- [30] D. Belitz, T. R. Kirkpatrick and Jörg Rollbühler: Phys. Rev. Lett. 94 (24) (2005) 247205.
- [31] V. Mineev: C. R. Physique 12, 567 (2011).
- [32] K. G. Sandeman, G. G. Lonzarich and A. J. Schofield: Phys. Rev. Lett. 90 (16) (2003) 167005.
- [33] B. Binz and M. Sigrist: Europhys. Lett. 65 (2004) 816.
- [34] M. Shimizu: Proc. Phys. Soc. 84 (1964) 397.
- [35] A. J. Millis, A. J. Schofield, G. G. Lonzarich and S. A. Grigera: Phys. Rev. Lett. 88 (2002) 217204.
- [36] H. Yamada: Phys. Rev. B 47 (17) (1993) 11211.
- [37] Y. Yamaji, T. Misawa and M. Imada: J. Phys. Soc. Jpn. 76 (2007) 063702.
- [38] C. Pfleiderer and A. D. Huxley: Phys. Rev. Lett. 89 (2002) 147005.
- [39] K. Satoh, S. W. Yun, I. Umehara, Y. Ōnuki, S. Uji, T. Shimizu and H. Aoki: J. Phys. Soc. Jpn. 61 (1992) 1827.
- [40] T. Terashima, T. Matsumoto, C. Terakura, S. Uji, N. Kimura, M. Endo, T. Komatsubara and H. Aoki: Phys. Rev. Lett. 87 (16) (2001) 166401.
- [41] R. Settai, M. Nakashima, S. Araki, Y. Haga, T. C. Kobayashi, N. Tateiwa, H. Yamagami and Y. Ōnuki: J. Phys.: Condens. Matter 14 (2002) L29.
- [42] Y. Haga, M. Nakashima, R. Settai, S. Ikeda, T. Okubo, S. Araki, T. C. K. N. Tateiwa and Y. Ōnuki: J. Phys.: Condens. Matter 14 (2002) L125.
- [43] T. Terashima, T. Matsumoto, C. Terakura, S. Uji, N. Kimura, M. Endo, T. Komatsubara, H. Aoki and K. Maezawa: Phys. Rev. B 65 (2002) 174501.
- [44] R. Settai, M. Nakashima, H. Shishido, Y. Haga, H. Yamagami and Y. Ōnuki: Acta Physica Polonica B 34 (2003) 725.
- [45] H. Yamagami and A. Hasegawa: Physica B 186-188 (1993) 182.
- [46] A. B. Shick and W. E. Pickett: Phys. Rev. Lett. 86 (2) (2001) 300.
- [47] O. Eriksson, B. Johansson and M. S. S. Brooks: J. Phys.: Condens. Matter 1 (1989) 4005.
- [48] K. Betsuyaku and H. Harima: Physica B 281-282 (2000) 778.
- [49] T. D. Matsuda, H. Sugawara, Y. Aoki, H. Sato, A. V. Andreev, Y. Shiokawa, V. Sechovsky and L. Havela: Phys. Rev. B 62 (2000) 13852.
- [50] N. Kimura, M. Endo, T. Isshiki, S. Minagawa, A. Ochiai, H. Aoki, T. Terashima, S. Uji, T. Matsumoto and G. G. Lonzarich: Phys. Rev. Lett. 92 (19) (2004) 197002.
- [51] S. Watanabe, A. Tsuruta, K. Miyake and J. Flouquet: J. Phys. Soc. Jpn. 78 (10) (2009) 104706.
- [52] H. Shishido, K. Hashimoto, T. Shibauchi, T. Sasaki, H. Oizumi, N. Kobayashi, T. Takamasu, K. Takehana, Y. Imanaka, T. D. Matsuda, Y. Haga, Y. Onuki and Y. Matsuda: Phys. Rev. Lett. 102 (15) (2009) 156403.
- [53] M. M. Altarawneh, N. Harrison, S. E. Sebastian, L. Balicas, P. H. Tobash, J. D. Thompson, F. Ronning and E. D. Bauer: Phys. Rev. Lett. 106 (14) (2011) 146403.
- [54] L. Malone, T. D. Matusda, A. Antunes, G. Knebel, V. Taufour, D. Aoki, K. Behnia, C. Proust and J. Flouquet: Phys. Rev. B 83 (2011) 245117.
- [55] R. A. Borzi, S. A. Grigera, J. Farrell, R. S. Perry, S. J. S. Lister, S. L. Lee, D. A. Tennant, Y. Maeno and A. P. Mackenzie: Science 315 (2007) 214.
- [56] E. Fradkin, S. A. Kivelson, M. J. Lawler, J. P. Eisenstein and A. P. Mackenzie: Annual Rev. Cond. Mat. Phys. 1 (2010) 153.
- [57] C. Sekine, T. Sakakibara, H. Amitsuka and Y. M. Goto: J. Phys. Soc. Jpn. 61 (12) (1992) 4536.
- [58] M. Sato, Y. Koike, S. Katano, N. Metoki, H. Kadowaki and S. Kawarazaki: J. Phys. Soc. Jpn. 73 (12) (2004) 3418.
- [59] W. Wu, A. McCollam, S. A. Grigera, R. S. Perry, A. P. Mackenzie and S. R. Julian: Phys. Rev. B 83 (4) (2011) 045106.
- [60] D. Aoki and J. Flouquet: to be published in J. Phys. Soc. Jpn.