A de Haas-van Alphen study of the Fermi surfaces
of superconducting LiFeP and LiFeAs
Abstract
We report a de Haas-van Alphen (dHvA) oscillation study of the 111 iron pnictide superconductors LiFeAs with K and LiFeP with K. We find that for both compounds the Fermi surface topology is in good agreement with density functional band-structure calculations and shows quasi-nested electron and hole bands. The effective masses generally show significant enhancement, up to for LiFeP and 5 for LiFeAs. However, one hole Fermi surface in LiFeP shows a very small enhancement, as compared with its other sheets. This difference probably results from -dependent coupling to spin fluctuations and may be the origin of the different nodal and nodeless superconducting gap structures in LiFeP and LiFeAs respectively.
Identification of the particular structural and electronic characteristics that drive superconductivity in the iron-based materials continues to be a central experimental and theoretical question in the field. A successful theory needs to explain trends, such as the variation of and also the structure of the superconducting energy gap. In most of the iron arsenides the parent materials have a non-superconducting, antiferromagnetically ordered ground state. Disruption of this magnetic order leads to superconductivity and then eventually a non-superconducting paramagnetic ground state. A good example is the BaFe2(As1-xPx)2 series which has a maximum =30 K when Jiang et al. (2009); Kasahara et al. (2010). Here BaFe2As2 has a magnetic ground state whereas BaFe2P2 is a paramagnet and neither superconduct.
The 111-family of iron-pnictides LiFeAs1-xPx, is unique because both LiFeAs and its counterpart LiFeP superconduct and are non-magnetic with K Tapp et al. (2008); Pitcher et al. (2008) and K Deng et al. (2009), respectively. Also, penetration depth measurements have shown that LiFeAs is fully gapped Kim et al. (2011); Hashimoto et al. (2011), whereas LiFeP has gap nodes Hashimoto et al. (2011). Establishing whether this switch of pairing structure is linked to changes in the topology and orbital character of the Fermi surface (FS) provides an stringent test of candidate theories for the superconducting pairing in these materials.
Magneto-quantum oscillation effects such as the de Haas-van Alphen (dHvA) effect are a powerful probe of the three-dimensional bulk Fermi surface and have been successfully used to study a variety of iron-based superconductors Coldea (2010); Carrington (2011). In this Letter, we present a study of the dHvA oscillations in both LiFeP and LiFeAs which establishes that the bulk Fermi surface topology of these compounds is in good agreement with DFT calculations. Furthermore, by comparing the values of the extracted effective masses of the quasiparticles to the calculated band masses, we find significant orbit dependence to the mass enhancement factors which is likely linked to the contrasting superconducting gap structures and in these compounds.
Single crystals of LiFeP and LiFeAs were grown by a flux method Kasahara et al. (2011). Small single crystals, typically m3 for LiFeP and m3 for LiFeAs, were selected for the torque measurements. To avoid reaction with air the samples were encapsulated in degassed Apiezon-N grease. Sharp superconducting transitions were measured using radio frequency susceptibility with onset (midpoint) values of 4.9 K (4.7 K) and 18.4 K (17.3 K) for LiFeP and LiFeAs, respectively. The samples were mounted onto miniature Seiko piezo-resistive cantilevers which were installed on a rotating platform, immersed in liquid 4He, in the bore of a pulsed magnet up to 58 T in Toulouse. Measurements on the same crystals were also conducted in an 18 T superconducting magnet in Bristol and a 33 T Bitter magnet at HMFL in Nijmegen and 45 T hybrid magnet at NHMFL, Tallahassee, all equipped with 3He refrigerators.
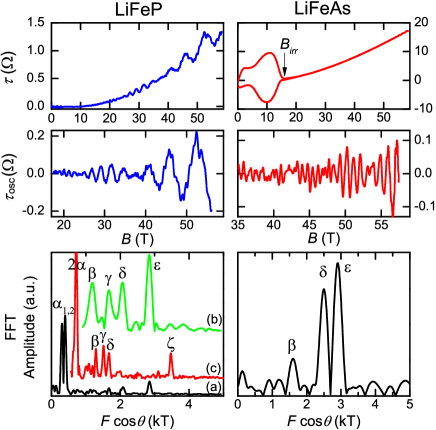
Torque versus magnetic field data are shown in Fig. 1. For both materials dHvA oscillations are seen at high fields and low temperatures, well above the upper critical field, estimated to be T for LiFeP Mydeen et al. (2010) and 16 T for LiFeAs Kurita et al. (2011) when (see also Fig. 1). After the fast Fourier transform (FFT) as a function of inverse field, several strong peaks are visible (Fig. 1 bottom panels), which correspond to the extremal cross-sectional areas of the FS: . For LiFeP, the spectrum is dominated by two low dHvA frequencies around 300 T and 400 T, labelled and . The amplitude and frequency of the peak at T is consistent with this being the second harmonic of the peaks. The other five peaks () are clearly derived from unique Fermi surface orbits. For LiFeAs, three frequencies are visible at 1.5 kT, 2.4 kT and 2.8 kT, labelled as , respectively.
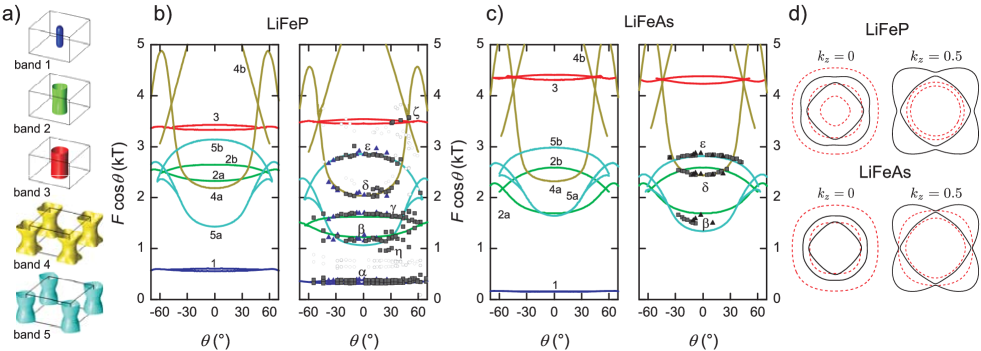
To properly identify these FS orbits, we performed field sweeps with different field orientations starting from () and rotating towards the -plane. For a perfectly two dimensional (2D) FS, , so by multiplying by the degree of two dimensionality of a FS can be easily seen. For quasi-2D surfaces, will decrease with increasing for a local maximum of Fermi surface orbit area as a function of whereas the opposite will be true for a local minimum. The data in Fig. 2 suggest that for LiFeP and are a maxima, and and are minima. The two lowest frequency orbits have opposite curvature indicating that they are the maximum and minimum of the same FS sheet. At angles close to strong peaks are seen (labelled in Figs. 1 and 2) which are likely from the outer hole sheet (band 3). The amplitude becomes large at this angle because of the Yamaji effect, expected when the two extremal orbits of a quasi two dimensional Fermi surface cross. Close to , an additional branch is visible. For LiFeAs, the orbit is a maximum, while and orbits are likely to be minima orbits.
To identify the origin of the orbits and solve the structure of the Fermi surface we have performed DFT calculations using the linear augmented plane wave method, implemented in the wien2k package Blaha et al. (2001). We used the experimental crystal structure lat (????) and included spin-orbit coupling (SOC). The calculated Fermi surfaces (see Fig. 2(a,d)) are quite similar for both materials, there are three hole bands at and two electron bands at M as found previously Shein and Ivanovskii (2010). The two outermost hole sheets are quite 2D, whereas the innermost hole pocket is strongly hybridized with near Z and is closed there, while remaining 2D away from this point. By contrast, the electron orbits are very strongly warped. This geometry is reflected in the calculated angular dependence of the dHvA orbits (Fig. 2(b,c)). For the 2D hole sheets varies little with angle and the maximal and minimal area are close. For the electron sheets there is a large deviation from this behavior. For LiFeP, SOC splits the two outermost hole bands, which are accidentally nearly degenerate in non-relativistic calculations, and causes their character to be mixed . In LiFeAs these bands are well separated irrespective of SOC and have a predominantly (middle) and (outermost) character. The SOC also splits the electron bands along the zone edge (X-M) inducing a gap of 35 meV (see 2(d)), hence as in LaFePO Carrington et al. (2009) we estimate that magnetic breakdown orbits, along the elliptic electron surfaces in the unfolded Brillouin zone, to be strongly damped.
By comparing the calculations to the data (Fig. 2(b,c)), in particular the curvature of , the correspondence between the observed dHvA frequencies and the predicted Fermi surface orbits is immediately apparent for most orbits. The observed frequencies are likely a mixture of signals from orbits 2a (hole) and 5a (electron) close to but are separately resolved at angles close to (the branch probably corresponds to band 5a). For LiFeP, relatively small shifts (somewhat smaller than for other Fe pnictides Carrington (2011)) of the band energies: meV and meV for band 4 and 5 (electron) and , , meV for bands 1, 2 and 3 (hole) bring the observations and calculations into almost perfect agreement as shown in Fig. 2(b). As in other Fe pnictides Shishido et al. (2010); Carrington (2011), these shifts shrink both the electron and hole FSs and likely originate from many body corrections to the DFT bandstructure Ortenzi et al. (2009). Although the maximal orbit of band 4 which is close to 6 kT was not observed, probably because the scattering rate in our sample was too high, we can estimate the accuracy of our band energy determinations by calculating the difference in total volume of the electron and hole Fermi surfaces. We find a small imbalance of just electrons per unit cell which shows the consistency of the procedure.
For LiFeAs, the curvature and absolute values of F suggest that the orbit originates from the maximum of the inner electron Fermi surface (band 5) and the extended angular dependence of the orbit suggest that this originates from the minima of the electron surface (band 4a), rather than the maximum of the middle hole surface (band 2b) which is of similar size in the calculation. The limited angular extent of the data for the orbit means it is not possible to say if it originates from band 5a (electron) or band 2a (hole) although 5a seems more likely. To accurately match the and orbits with the calculations only very small shifts of the band energies are required (5 meV and meV for bands 4 and 5 respectively) (Fig. 2(b)). We did not observe the smallest hole FS (band 1)in LiFeAs, even though the same band gave the largest signals for LiFeP. This suggests that band 1 does not cross the Fermi level in LiFeAs, which requires that it shifts down by meV, possibly because of enhanced SOC. The small shift of the electron bands is almost perfectly compensated by the removal of band 1, so the remaining hole bands are not shifted in Fig. 2(b). Although we do not see definitive evidence for the hole orbits, probably because of a significantly higher impurity scattering rate in LiFeAs compared to LiFeP, the small size of the energy shifts needed to match the electron bands combined with the similar small shifts required in LiFeP to match both electron and hole bands strongly suggests that the DFT calculations correctly predict the Fermi surface topology of these 111 compounds. This is contrast to the photoemission results of Borisenko et al. Borisenko et al. (2010) for LiFeAs, where a significant discrepancy between the size of the hole sheets and the DFT calculations was found.
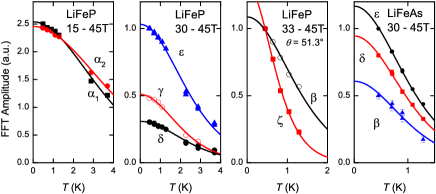
The strength of the electron-electron interactions can be estimated from measurements of the quasiparticle effective mass on each orbit through the temperature dependence of the amplitude of the dHvA signals, by fitting the latter to the Lifshitz-Kosevich formula Shoenberg (1984) (Fig. 3). These measurements were conducted in dc field on the same samples to avoid any possibility of sample heating at low temperature. The derived values along with the DFT calculations are shown in Table 1.
| LiFeP | ||||||
|---|---|---|---|---|---|---|
| DFT calc. | Experiment | |||||
| Orbit | Orbit | |||||
| 557 | 316(2) | 1.1(1) | 1.5(3) | |||
| 607 | 380(2) | 1.0(1) | 1.6(3) | |||
| 2325 | 2040(10)† | 4.4(1)† | 0.6(2)† | |||
| 2645 | 1670(10) | 2.7(2) | 0.7(1) | |||
| 3328 | 5550(10)† | 7.7(2)† | 2.1(5)† | |||
| 3428 | 5550(10)† | 7.7(2)† | 2.1(5)† | |||
| 2183 | 2040(20) | 2.2(1) | 1.4(2) | |||
| 6014 | ||||||
| 1430 | 1160(10) | 3.6(2) | 2.3(2) | |||
| 3142 | 2840(10) | 2.2(2) | 1.6(3) | |||
| LiFeAs | ||||||
| DFT calc. | Experiment | |||||
| Orbit | Orbit | |||||
| 130 | ||||||
| 149 | ||||||
| 1585 | ||||||
| 2529 | ||||||
| 4402 | ||||||
| 4550 | ||||||
| 2359 | 2400(25) | 5.2(4) | 3.3(3) | |||
| 6237 | ||||||
| 1584 | 1590(10) | 6.0(4) | 2.9(3) | |||
| 2942 | 2800(40) | 5.2(4) | 4.1(4) | |||
For LiFeP, the enhancements factors vary strongly between orbits. For the electron sheet is in the range 1.4-2.3, which is comparable to values found for the electron sheets of LaFePO (=6 K) Coldea et al. (2008). The smallest and largest hole sheets (bands 1 and 3) are also strongly enhanced, however for the middle hole sheet (orbits and , band 2) is times smaller than for the other sheets, despite having similar orbital character. As an enhancement Boeri et al. (2009) is expected from electron-phonon coupling, this means that the residual electron-electron component for this particular orbit is very weak. This is an interesting observation, relevant to the ongoing discussion Hirschfeld et al. (????) as to whether the mass enhancement comes entirely from local correlations or partially from long range spin fluctuations. If the mass renormalization in this compound is due to the same spin fluctuations that are believed to cause superconductivity, we can conclude that band 2 is very weakly coupled with these fluctuations, so that the pairing amplitude on this band will be small and hence it is a possible candidate for the location of the gap nodes. Calculations suggest Hirschfeld et al. (????) that node formation is controlled by the pocket, so that if this pocket exists, the order parameter is nodeless, otherwise nodes form on an electron (band 4, in our notation) pocket. LiFeP seems to deviate from this rule, as it has a well developed pocket (band 3) and has gap nodes. LiFeP therefore appears to be a challenging and an extremely interesting material for further theoretical modelling.
For LiFeAs, the measured effective masses are uniformly larger than in LiFeP. For the electron sheet (band 5) is more than 3 times larger than in LiFeP. This observation suggest that mass renormalization in iron pnictides is caused by the same interaction that drives superconductivity. This agrees with previous findings in the isoelectronic superconducting series, BaFe2(As1-xPx)2, in which the effective mass of the electron bands are closely related to the increase in Shishido et al. (2010). Interestingly, the large mass enhancement in LiFeAs is not accompanied by a corresponding large shrinking of the Fermi surface volume Shishido et al. (2010).
In summary, dHvA oscillations have been observed in two members of the 111 family of superconductors, LiFeP and LiFeAs. In both cases we find that measured data are consistent with the topology of the DFT calculated Fermi surface with small band energy shifts. The many-body mass enhancements are larger in LiFeAs than in LiFeP. In LiFeP, the middle hole band has significantly lower mass enhancement than the other sheets, which implies that the electron-hole scatter rate is suppress for this sheet. This may be the origin of the lower and nodal gap in LiFeP, and suggests that the mass enhancement is to a large extent due to a -dependent spin-fluctuation induced interaction, which are also responsible for the pairing. It will be very interesting to see whether these features and the nodal gap structure in LiFeP can be explained by detailed microscopic calculations.
We thank E. Kampert, F. Wolff-Fabris, E.A. Yelland and F. Fabrizi, E. Choi and A. Bangura for technical assistance and S. Borisenko for discussions. This work is supported by EPSRC (UK), EuroMagNET II under the EU contract no. 228043, KAKENHI from JSPS. A portion of this work was performed at the National High Magnetic Field Laboratory, which is supported by National Science Foundation Cooperative Agreement No. DMR-0654118, the State of Florida, and the U.S. Department of Energy.
References
- Jiang et al. (2009) S. Jiang, et al., J. Phys. Cond. Mat. 21, 382203 (2009).
- Kasahara et al. (2010) S. Kasahara, et al., Phys. Rev. B 81, 184519 (2010).
- Tapp et al. (2008) J. H. Tapp, et al., Phys. Rev. B 78, 060505 (2008).
- Pitcher et al. (2008) M. J. Pitcher, et al., Chem. Comm. 45, 5918 (2008).
- Deng et al. (2009) Z. Deng, et al., EPL 87, 37004 (2009).
- Kim et al. (2011) H. Kim, M. A. Tanatar, Y. J. Song, Y. S. Kwon, and R. Prozorov, Phys. Rev. B 83, 100502 (2011).
- Hashimoto et al. (2011) K. Hashimoto, et al., arXiv:1107.4505.
- Coldea (2010) A. Coldea, Philos. Trans. R. Soc. A 368, 3503 (2010).
- Carrington (2011) A. Carrington, Rep. Prog. Phys. in press (ArXiv:1110.1326) (2011).
- Kasahara et al. (2011) S. Kasahara, et al., unpublished.
- Mydeen et al. (2010) K. Mydeen, et al., Phys. Rev. B 82, 014514 (2010).
- Kurita et al. (2011) N. Kurita, et al., J. Phys. Soc. Jpn. 80, 013706 (2011).
- Blaha et al. (2001) P. Blaha, K. Schwarz, G. K. H. Madsen, D. Kvasnicka, and J. Luitz, WIEN2K, An Augmented Plane Wave + Local Orbitals Program for Calculating Crystal Properties (Karlheinz Schwarz, Techn. Universität Wien, Austria, 2001).
- lat (????) The lattice parameters for LiFeP were determined by x-ray diffraction at 300 K, =3.6955 Å =6.041 Å =0.1437, =0.2803 and for LiFeAs we used: a=3.7914 Å c=6.3639 Å =0.1541, =0.2635 from Ref Tapp et al. (2008).
- Shein and Ivanovskii (2010) I. R. Shein and A. L. Ivanovskii, Solid State Commun. 150, 152 (2010).
- Carrington et al. (2009) A. Carrington, et al., Physica C 469, 459 (2009).
- Shishido et al. (2010) H. Shishido, et al., Phys. Rev. Lett. 104, 057008 (2010).
- Ortenzi et al. (2009) L. Ortenzi, E. Cappelluti, L. Benfatto, and L. Pietronero, Phys. Rev. Lett. 103, 046404 (2009).
- Borisenko et al. (2010) S. V. Borisenko, et al., Phys. Rev. Lett. 105, 067002 (2010).
- Shoenberg (1984) D. Shoenberg, Magnetic Oscillations in Metals (Cambridge University Press, Cambridge, 1984).
- Coldea et al. (2008) A. I. Coldea, et al., Phys. Rev. Lett. 101, 216402 (2008).
- Boeri et al. (2009) L. Boeri, O. V. Dolgov, and A. A. Golubov, Physica C 469, 628 (2009).
- Hirschfeld et al. (????) P. J. Hirschfeld, M. M. Korshunov, and I. I. Mazin, arXiv:1106.3712.