Metals; alloys and binary compounds Effects of crystal defects, doping and substitution Properties of superconductors
Raising in charge density wave superconductor ZrTe3 by Ni intercalation
Abstract
We report discovery of bulk superconductivity in Ni0.05ZrTe3 at = 3.1 K, obtained through Ni intercalation. Superconductivity coexists with charge density wave (CDW) state with = 41 K. When compared to parent material ZrTe3, filamentary superconducting transition is substantially increased whereas TCDW was suppressed. The analysis of superconducting state indicates that Ni0.05ZrTe3 is an intermediately coupled superconductor.
pacs:
74.70.Adpacs:
74.62.Dhpacs:
74.25.-q1 Introduction
Charge density wave (CDW) and superconductivity are distinctive quantum orders that emerge due to Fermi surface (FS) instabilities[1]. Competition and coexistence between CDW and superconductivity in low-dimensional materials is one of the most fundamental problems in condensed matter physics. Among CDW superconductors, layered MX2 compounds and chain-typed MX3 compounds (M = transition metal, and X = S, Se or Te) are well-known[2][4]. It was recently pointed out that chalcogenide superconductors represent a weak coupling limit of the melting of the stripe (or smectic) order in cuprates[5]. Furthermore, the domelike Tc(x)[4] in CuxTiSe2 and pairing mechanism was proposed to arise from the quantum criticality related to fluctuations in CDW order[6][7]. Therefore discovery of new superconductors in this materials class is of significant interest.
ZrTe3 belongs to a family of trichalcogenides MX3 (M = Ti, Zr, Hf, U, Th, and X = S, Se, Te). The structure consists of infinite X-X chains formed by stacking MX3 prisms along the crystallographic axis. The polyhedra are arranged in double sheets and stacked along monoclinic c axis by van der Waals forces (fig. 1(a))[8]. ZrTe3 exhibits CDW transition at = 63 K. The CDW nesting vector = (1/14, 0, 1/3) has no component in the chain-axis direction[9]. This is different from another well-known quasi-one-dimensional CDW compound NbSe3 with X-X chains which exhibits a resistivity anomaly along the chain axis[10]. The (T) of ZrTe3 is quasi two dimensional, metallic below 300 K with anomalies due to CDW transition[11], and superconductivity below = 2 K. The superconductivity is not bulk but filamentary[12]. Theoretical calculations[13] and photoemission study[14] indicate that the CDW transition is driven by the nesting of parallel planar sections of the FS which are related to the Te 5px band along the Te-Te chains. Other parts of the FS remain unaffected and are responsible for superconductivity. Therefore, CDW and filamentary superconductivity coexist in ZrTe3 due to multiband nature of the Fermi surface.
On the other hand, ZrTe3 (fig. 1(a)) exhibits uncommon pressure dependence of CDW and superconductivity[15]. With increasing pressure initially increases, then decreases up to 2 GPa and abruptly vanishes near 5 GPa. The falls to below 1.2 K at 0.5 GPa and can not be observed up to 5 GPa. At higher pressures superconducting transition emerges again and increases continuously from 2.5 K to 4.7 K at 11 GPa. The (P) and (P) above 5 GPa can be explained by pressure induced FS modifications. High pressures favor three-dimensionality, therefore the area of the planar portions of FS will decrease and the CDW transition will be suppressed. Consequently superconducting , a competing FS instability will be favored. However, the pressure dependence above 2 Gpa is still unclear. The (P) and (P) indicate that the changes in FS are rather sensitive to crystal structure modification. Besides hydrostatic pressure, doping and intercalation can be used to tune the crystal structure, lattice properties, shape and characteristics of the FS. For example, intercalating external atoms into the interlayer weak van der Waals gap of MX2 can depress the CDW transition and enhance the superconductivity[4]. Since there is also a van der Waals gap in ZrTe3, intercalation is a powerful method to examine the relation between CDW and superconductivity in this system. Ni is often a suitable intercalant as seen on the example of NixTaS2 and NixTaSe2[16],[17].
In this work, we report synthesis and physical properties of Ni0.05ZrTe3 single crystals. Ni intercalation induces bulk superconductivity with enhanced while the shifts to lower temperatures, indicating coexistence of CDW and superconductivity.
2 Experimental
Single crystal NixZrTe3 was grown via the chemical vapor transport (CVT) method. The source and growth zone were set at 700 for 2 days and then kept at 720 and 645 respectively for 10 days. Golden plate-like single crystals with a typical size of 220.2 mm3 were obtained. The crystal structure and phase purity were examined by powder and single crystal X-ray diffraction pattern (XRD) with Cu Kα radiation ( = Å) using a Rigaku Miniflex X-ray machine. The structure parameters are extracted by fitting the XRD spectra using the Rietica software[18]. The composition of NixZrTe3 single crystal was determined by examination of multiple points on the crystals using energy dispersive X-ray spectroscopy (EDS) in an JEOL JSM-6500 scanning electron microscope. The measured compositions are Ni0.052(3)Zr1.00(2)Te3.10(2), abbreviated as Ni0.05ZrTe3. Physical property measurements were performed in a Quantum Design PPMS-9 and MPMS XL 5 instruments.
3 Results and discussion
Powder X-ray diffraction (XRD) result (fig. 1(b)) of ground samples indicates that all peaks of Ni0.05ZrTe3 can be indexed using the structure of ZrTe3, i.e. the intercalation does not change the structure of the mother compound. The fitted lattice parameters are a = 0.5895(1) nm, b = 0.3923(1) nm, c = 1.0160(2) nm, and = 97.76(1)∘. Our refinement of pure ZrTe3 crystals gave lattice parameters a = 0.586(3) nm, b = 0.392(7) nm, c = 1.009(5) nm and = 97.75(1)∘. Hence, the a and c - axis lattice parameters of Ni0.05ZrTe3 are larger than those of ZrTe3. The substitution on Zr site is unlikely due to the smaller size of Ni ion (r = 69 pm) than Zr ion(r = 72 pm). This indicates that Ni is most likely intercalated in the Van-der-Waals bonded crystallographic layers in ZrTe3. The XRD pattern of single crystals (ig. 1(b) inset) reveals that the crystal surface is normal to the c axis with the plate-shaped surface parallel to the ab-plane (fig. 1(c)).
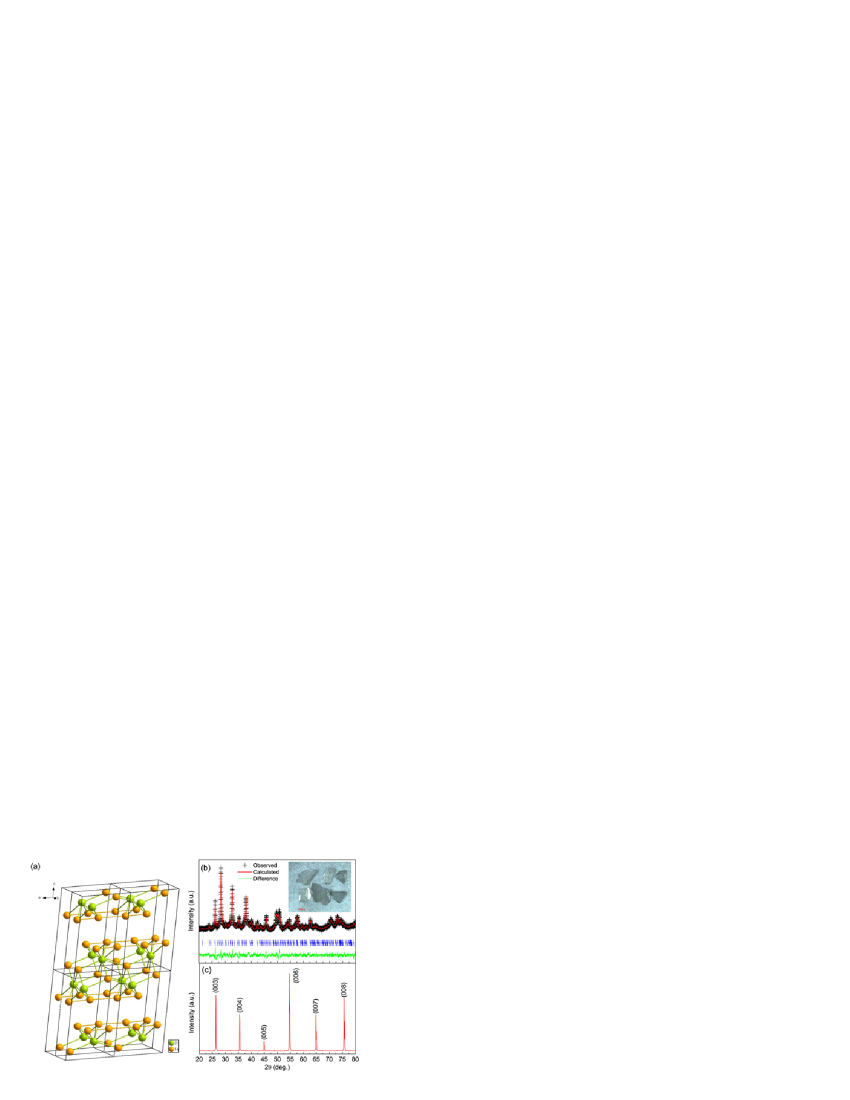
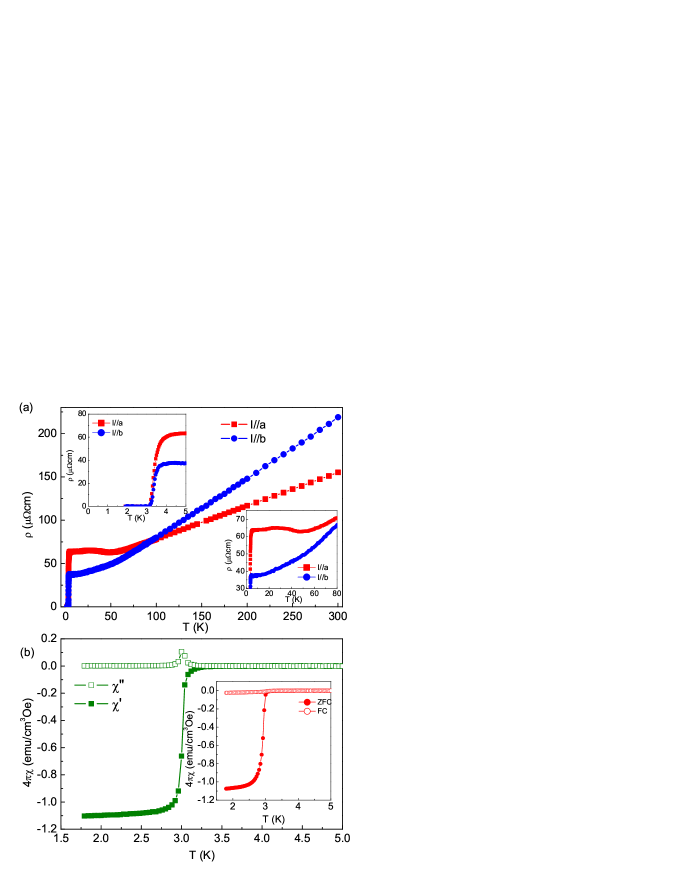
Figure 2(a) shows the temperature dependence of resistivity at zero field from 1.9 K to 300 K. Both (T), and (T) undergo a relatively sharp superconducting transition at = 3.74(3) K and 3.59(2) K, respectively (upper inset). It should be noted that the (T) is metallic in the normal state with no anomalies due to CDW and with a residual resistivity ratio (RRR) of 6. The (T) exhibits a transition located at 41 K (lower inset fig. 2(a)). This can be ascribed to CDW since it is similar to resistivity anomalies in ZrTe3[11]. However, the transition has been depressed from around 65 K to 41 K. Therefore, there is a coexistence of superconductivity and CDW in NixZrTe3 similar to ZrTe3 but with nearly double bulk [12]. The filamentary superconductivity and the CDW originate from different sections of FS in ZrTe3. From the difference in , in Ni0.05ZrTe3 and ZrTe3 we can conclude that Ni intercalation dramatically changes the FS related to the superconductivity but has a minor effects on FS parts associated with the CDW transition. Intercalation has a distinctively different effect when compared to pressure. The reason could be that intercalation only modifies one part of FS related to superconductivity whereas pressure increases three-dimensionality of all parts.
Figure 2(b) shows the temperature dependence of the ac susceptibility of Ni0.05ZrTe3 single crystal with dimension of 21.50.24 mm3 for Hab and Hc. The single sharp peak of 4 accompanied by a very steep transition in 4, indicates that the sample is rather homogeneous. The onset temperature for both field direction is 3.1 K. This is slightly lower than that obtained from resistivity measurement. The transition width is 0.3 K. For Hab, the value of -4 at 1.8 K is 110% without any demagnetization factor correction, indicating that the superconductivity is bulk. This is different from the mother compound ZrTe3 where superconductivity is undetectable in magnetization due to its filamentary nature below = 2 K. Inset in fig. 2(b) shows the dc magnetic susceptibility for field along , axes with zero-field cooling (ZFC) and field cooling (FC). For ZFC curves, the and are consistent with the results of ac susceptibility and the values of -4 at 1.8 K are nearly identical. On the other hand, the volume fraction estimated from the FC curve is about 2% at 1.8 K for Hc, similar to other intercalated compounds such as (Pyridine)1/2TaS2[19], YbC6[20], NixTaS2[21]. The small magnetization values for FC is likely due to the complicated magnetic flux pinning effects in the intercalated compounds[19].
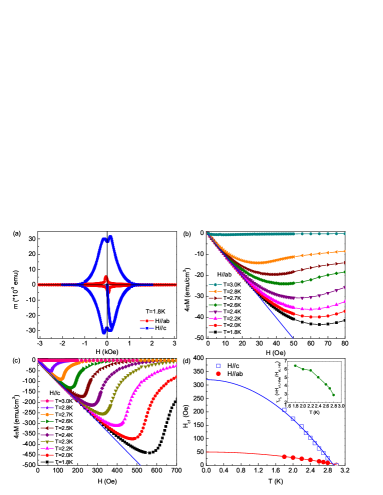
The results of the dc magnetization versus field M(H) at various temperatures for both directions are shown in fig. 3(a). The shape of the M(H) curves points that Ni0.05ZrTe3 is a typical type-II superconductor. Figures 3(b) and (c) show the initial M(H) curves at the low field region. All curves clearly fall on the same line and deviate from linearity for different temperatures. Linear fits describe the Meissner shielding effects (“Meissner line”) (figs. 3(b) and (c)) The obtained slope of the linear fit up to 30 Oe at the lowest temperature of our measurement T = 1.8 K is -0.995(5) -1. This corresponds to -4M = H for Hab where the demagnetization factor is negligible.
The value of at which the field starts to penetrate into the sample can be determined by examining the point of deviation from the Meissner line on the initial slope of the magnetization curve. The is not the same as the real lower critical field, , due to the geometric effect. The can be deduced from the first penetration field , assuming that the magnetization M = - when the first vortex enters into the sample. Thus H has been rescaled to H = Ha-NM and = /(1-N) where N is the demagnetization factor and Ha is the external field[22]. We estimate demagnetization factors 0.075 and 0.781 for Hab and Hc by using = /tanh(), where a and b are width and thickness of a plate-like superconductor[23]. This is consistent with previous, i.e. the demagnetization factor for Hab is negligible. However, demagnetization factor must be considered for Hc. The M(H) curve for Hc with demagnetization correction is shown in fig. 3(c) and the slope of the fitted line in linear region is -0.963(1) -1. From the above and constrained with the resolution limit of our magnetization measurement = 310-5 emu we extract the temperature dependence of for both field directions (fig. 3(d)). The (T) can be well explained by (T) = (0)[1 - ()2]. The obtained (0) and (0) are 50(1) and 321(8) Oe, respectively. On the other hand, the anisotropy of , = , increases with decreasing temperature and is estimated about 6.4 at T = 1.8 K. This is much larger than in MX2 compounds[21].
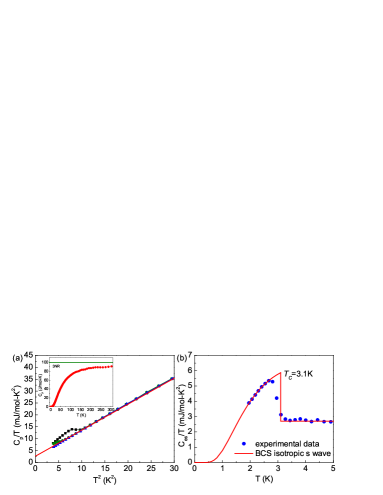
The main panel of fig. 4(a) shows the temperature dependence of the specific heat of Ni0.05ZrTe3 below 5 K at H = 0, 10, and 50 kOe. A jump at 3 K can be clearly seen at H = 0, indicating bulk superconductivity of Ni0.05ZrTe3 sample. The of 3.1 K determined from the specific heat jump is consistent with that obtained from the susceptibility and transport measurements. At H = 1 kOe, the superconducting anomaly is shifted to lower temperatures. The normal state is recovered at H = 50 kOe. In order to obtain the electronic specific heat coefficient and Debye temperatures , the low temperature specific heat at H = 50 kOe is fitted using = . The obtained parameters are = 2.7(1) mJ/mol-K2 and = 192.4(1) K using = where N = 4 is the number of atoms per formula unit and R is the gas constant. The high-temperature specific heat approaches the value of 3NR, in accordance with the Dulong-Petit law (fig. 4(a) inset). According to the McMillan formula for electron-phonon mediated superconductivity[24], the electron-phonon coupling constant can be determined by
| (1) |
where 0.13 is the common value for Coulomb pseudopotential. By using = 3.1 K and = 192.4 K, we obtain = 0.63, indicating an intermediately coupled superconductor. The electronic specific heat part obtained by subtracting phonon part from the total specific heat is shown in fig. 4(b). From fits to /- below using the BCS formula for the electronic contribution to the specific heat[25], the ratio of the gap and the critical temperature is about, 2/ = 3.00(2). This is smaller than the typical BCS value (3.53) in the weak-coupling limit[25]. The solid red line in fig. 4(b) shows the data simulation for an isotropic s-wave BCS gap. The specific heat jump at , Ces/ = 1.20(3), is somewhat smaller than the weak coupling value 1.43[24]. The calculated coupling strength from the heat capacity anomaly could be influenced by the rather large fitting inaccuracy near Tc and somewhat broad superconducting transition width in ().
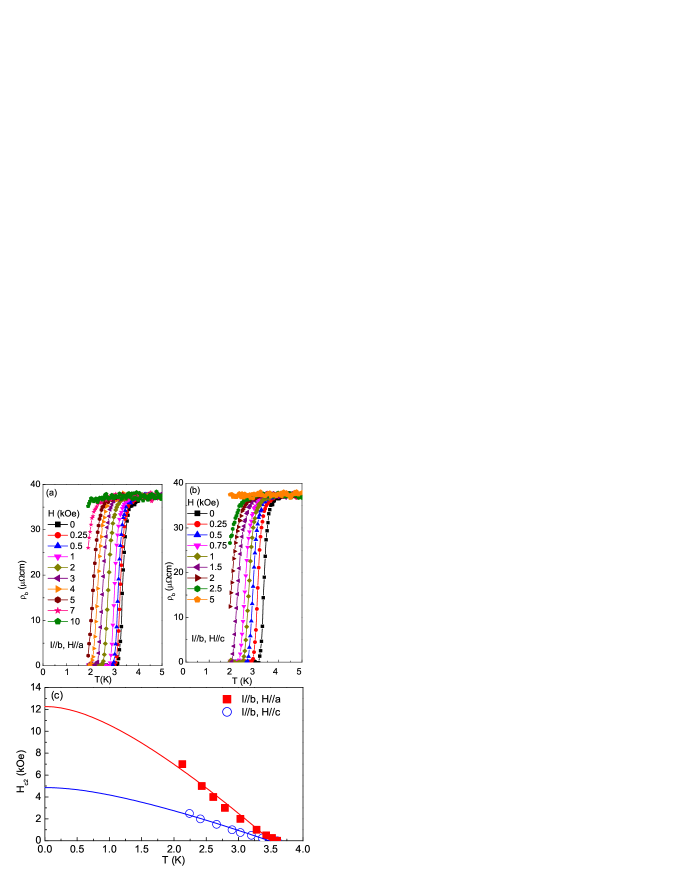
Temperature dependent resistivity of (T) of Ni0.05ZrTe3 below 5 K in magnetic fields for Ha and Hc is shown in figs. 5(a) and (b). With increasing magnetic fields, the resistivity transition width becomes broader and the onset of superconductivity gradually shifts to lower temperatures. At H = 5 kOe, for Hc, the superconducting transition can not be observed above 1.9K, whereas for Ha, the superconductivity above 1.9 K is nearly suppressed at H = 10 kOe.
| Ni0.05ZrTe3 | (0) (Oe) | (0) (kOe) | (0) (Oe) | (0) (nm) | (0) (nm) | (0) |
|---|---|---|---|---|---|---|
| Hab | 50(1) | 12.281(860) | 449(13) | 26(1) | 78(11) | 19.3(8) |
| Hc | 321(8) | 4.862(340) | 10(1) | 1242(100) | 3.0(3) |
Figure 5(c) shows the upper critical field of Ni0.05ZrTe3 corresponding to the temperatures where the resistivity drops to 90% of the normal state resistivity at 5 K. Since Pauli limiting field = 1.84 55 kOe, the orbital effect should be the dominant pair-breaking mechanism. According to the conventional one-band Werthamer-Helfand-Hohenberg (WHH) theory, which describes the orbital limited upper critical field of dirty type-II superconductors[26], the can be described by
| (2) |
where = , is a digamma function and
| (3) |
The fits are shown by solid and dotted lines in fig. 5(c). The obtained = 5.049(285) kOe, = 3.51(4) K for Ha and = 2.016(122) kOe, = 3.48(4) K for Hc are consistent with the ( = 90%(T, H = 0) = 3.59(2) K). The estimated upper critical fields are = 12.281(860) kOe and 4.862(340) kOe for Ha and Hc. From the zero-temperature coherence length can be estimated with Ginzburg-Landau formula = , and = where = 2.0710-15 Wb. Based on the values of and , the Ginzberg-Landau (GL) parameter is obtained from = . And thermodynamic critical field can be obtained from = . The GL penetration length (0) and (0) can be evaluated using (0) = (0)/(0), and (0) = [(0)(0)/(0)(0)]1/2[27]. All of obtained parameters are listed in Table 1.
4 Conclusion
In summary, we have discovered the bulk superconductivity in Ni intercalated ZrTe3 and presented detailed characterization of superconducting state. The bulk superconducting Tc was nearly doubled when compared to filamentary Tc in parent material ZrTe3. The normal state electrical resistivity indicates that the CDW transition is somewhat suppressed with Ni intercalation, coexisting with bulk superconductivity. The Ni intercalation substantially changes the FS related to the superconductivity but has a minor effects on FS parts associated with CDW. This is rather different from the pressure effects. Our results suggest intermediately coupled superconductivity and possible rich vortex physics.
Acknowledgements.
We thank John Warren for experimental support at Brookhaven National Laboratory (BNL). This work was carried out at BNL, which is operated for the U.S. Department of Energy by Brookhaven Science Associates DE-Ac02-98CH10886. *Present and permanent address: High Magnetic Field Laboratory, Chinese Academy of Sciences, Hefei 230031, People’s Republic of ChinaReferences
- [1] \NameGabovich A. M., Voitenko A. I., Annett J. F. Ausloos M. \REVIEWSupercond. Sci. Technol.142001R1.
- [2] \NameWilson J. A. Yoffe A. D. \REVIEWAdv. Phys.181969193.
- [3] \NameFriend R. H. Yoffe A. D. \REVIEWAdv. Phys.3619871.
- [4] \NameMorosan E., Zandbergen H. W., Dennis B. S., Bos J. W. G., Onose Y., Klimczuk T., Ramirez A. P., Ong N. P. Cava R. J. \REVIEWNat. Phys.22006544.
- [5] \NameSun K., Fregoso B. M., Lawler M. J. Fradkin E. \REVIEWPhys. Rev. B782008085124.
- [6] \NameBarath H., Kim M., Karpus J. F., Cooper S. L., Abbamonte P., Fradkin E., Morosan E. Cava R. J. \REVIEWPhys. Rev. Lett.1002008106402.
- [7] \NameKusmartseva A. F., Sipos B., Berger H., Forro L. Tutis E. \REVIEWPhys. Rev. Lett.1032009236401.
- [8] \NameFuruseth S., Brattas L. Kjekshus A. \REVIEWActa Chem. Scand. Ser. A291975623.
- [9] \NameEaglesham D. J., Steeds J. W. Wilson J. A. \REVIEWJ. Phys. C: Solid State Phys.171984L697.
- [10] \NameMonceau P., Peyrard J., Richard J. Molinié P. \REVIEWPhys. Rev. Lett.391977161.
- [11] \NameTakahashi S. and Sambongi T., Brill J. W. Roark W. \REVIEWSolid State Commun.4919841031.
- [12] \NameNakajima H., Nomura K. Sambongi T. \REVIEWPhysica B1431986240.
- [13] \NameFelser C., Finckh E. W., Kleinke H., Rocker F. Tremel W. \REVIEWJ. Mater. Chem819981787.
- [14] \NameYokoya T., Kiss T., Chainani A., Shin S. Yamaya K. \REVIEWPhys. Rev. B712005140504(R).
- [15] \NameYomo R., Yamaya K., Abliz M., Hedo M. Uwatoko Y. \REVIEWPhys. Rev. B712005132508.
- [16] \NameZhu X. D., Sun Y. P., Zhang S. B., Lei H. C., Li L. J., Zhu X. B., Yang Z. R., Song W. H. Dai J. M. \REVIEWSolid State Commun.14920091296.
- [17] \NameLi L. J., Sun Y. P., Zhu X. D., Wang B. S., Zhu X. B., Yang Z. R. Song W. H. \REVIEWSolid State Commun.15020102248.
- [18] \NameHunter B. \REVIEWCommission on Powder Diffraction Newsletter20199821.
- [19] \NameProber D. E., Beasley M. R. Schwall R. E. \REVIEWPhys. Rev. B1519775245.
- [20] \NameWeller T. E., Ellerby M., Saxena S. S., Smith R. P. Skipper N. T. \REVIEWNat. Phys.1200530.
- [21] \NameLi L. J., Zhu X. D., Sun Y. P., Lei H. C., Wang B. S., Zhang S. B., Zhu X. B., Yang Z. R. Song W. H. \REVIEWPhysica C4702010313.
- [22] \NameFossheim K. Sudbo A. \BookSuperconductivity: Physics and Applications \PublJohn Wiley and Sons, West Sussex \Year2004.
- [23] \NameBrandt E. H. \REVIEWPhys. Rev. B60199911939.
- [24] \NameMcMillan W. L. \REVIEWPhys. Rev.1671968331.
- [25] \NameBardeen J., Cooper L. N. Schrieffer J. R. \REVIEWPhys. Rev.10819571175.
- [26] \NameWerthamer N. R., Helfand E. Hohenberg P. C. \REVIEWPhys. Rev.1471966295.
- [27] \NamePlakida N. \BookHigh-Temperature Cuprate Superconductors: Experiment, Theory and Applications \Vol166 \PublSpringer Berlin Heidelberg \Year2010.