CANGAROO-III observation of TeV gamma rays from the unidentified gamma-ray source HESS J1614518
Abstract
We report the detection, with the CANGAROO-III imaging atmospheric Cherenkov telescope array, of a very high energy gamma-ray signal from the unidentified gamma-ray source HESS J1614518, which was discovered in the H.E.S.S. Galactic plane survey. Diffuse gamma-ray emission was detected above 760 GeV at the 8.9 level during an effective exposure of 54 hr from 2008 May to August. The spectrum can be represented by a power-law: TeV cm-2 s-1 TeV-1 with a photon index of , which is compatible with that of the H.E.S.S. observations. By combining our result with multi-wavelength data, we discuss the possible counterparts for HESS J1614518 and consider radiation mechanisms based on hadronic and leptonic processes for a supernova remnant, stellar winds from massive stars, and a pulsar wind nebula. Although a leptonic origin from a pulsar wind nebula driven by an unknown pulsar remains possible, hadronic-origin emission from an unknown supernova remnant is preferred.
Subject headings:
gamma rays:observations — ISM: individual(HESS J1614-518)1. Introduction
Recent progress with Imaging Air Cherenkov Telescopes (IACTs) is enabling the exploration of sites of cosmic-ray acceleration in our galaxy. Very high energy (VHE) gamma rays are produced by the decay of neutral pions which arise from interactions between the accelerated protons and interstellar matter, or by Inverse Compton (IC) scattering and Bremsstrahlung of high-energy electrons. For example, VHE gamma rays have been detected from young supernova remnants (SNRs) such as RX J1713.73946 (Muraishi et al., 2000; Enomoto et al., 2002a; Aharonian et al., 2006c), RX J0852.04622 (Katagiri et al., 2005; Aharonian et al., 2005c; Enomoto et al., 2006b), and RCW86 (Watanabe et al., 2003; Aharonian et al., 2009), which show possible evidence of cosmic-ray acceleration (e.g., Enomoto et al., 2002a; Malkov et al., 2005; Uchiyama et al., 2007; Tanaka et al., 2008; Yamazaki et al., 2009). In addition, detections of VHE gamma rays from pulsar wind nebulae (PWNe) such as the Crab nebula (Weekes et al., 1989) and Vela X nebula (Aharonian et al., 2006b; Enomoto et al., 2006a) have shown that PWNe also play an important role in particle acceleration in the Galaxy. Recently, VHE gamma-ray emission related to massive stars such as the X-ray binary systems PSR B125963 (Aharonian et al., 2005e) and LS I +61 303 (Albert et al., 2006), the young open stellar clusters Cyg OB2 (Aharonian et al., 2002), Westerlund 2 (Aharonian et al., 2007), and Westerlund 1 (Ohm et al., 2010) have also been reported. Moreover, the Galactic plane survey performed by the H.E.S.S. observatory (Aharonian et al., 2005b, 2006a) discovered seventeen unidentified VHE gamma-ray sources, including HESS J1614518. Today, unidentified sources are the largest class of the 123 discovered VHE gamma-ray sources, most of which are located in the Galactic plane (e.g., Aharonian et al. (2005d); Abdo et al. (2007); Aharonian et al. (2008); the TeVCAT catalog, TeVCAT ver.3.400 (2011), is a useful up-to-date, on-line resource). In general, the lack of non-thermal electromagnetic radiation from the radio to the X-ray bands may be evidence of hadron acceleration because the IC scenario requires a lower magnetic field than the typical interstellar magnetic field intensity of a few G. Revealing the possible radiation mechanism(s) of each unidentified source is therefore important for identifying the origin(s) of cosmic rays.
H.E.S.S. reported that HESS J1614518 had a high flux level, 25% of the Crab nebula, above 200 GeV with a photon index of 2.4 and an elliptical morphology with a semi-major axis of arcmin and a semi-minor axis of arcmin (Aharonian et al., 2006a). The peak position has an offset of 8.7 arcmin to the north-east from the central position. Landi et al. (2007) and Rowell et al. (2008) pointed out that HESS J1614518 may be associated with the 40 Myr-old young open star cluster Pismis 22 (Piatti et al., 2000) which is located within the VHE gamma-ray emission region at a distance of 1.00.4 kpc and has sufficient luminosity to produce the observed gamma-ray luminosity, assuming 20% energy conversion from the stellar winds of ten B-type stars. However, there are several issues in identifying HESS J1614518 with Pismis 22 since the size of Pismis 22, 2.0 arcmin in diameter, is one order of magnitude smaller than the VHE gamma-ray emission size and the location has a 12 arcmin offset from the VHE gamma-ray emission peak. In addition, there has been no detailed discussion of the radiation mechanism.
The X-ray satellite Suzaku observed this region with the X-ray imaging spectrometer (XIS) and found three X-ray sources in their follow-up observation in 2006 (Matsumoto et al., 2008). One of these, called Suzaku source A, is located very close to the VHE gamma-ray peak position with an offset of 0.8 arcmin. The spectrum is well fitted by a single power-law model with a photon index of and a hydrogen equivalent column density of cm-2. The distance to Suzaku source A is approximately 10 kpc, which was derived from the hydrogen equivalent column density using the total Galactic H i column density toward HESS J1614518 of cm-2 (Dickey & Lockman, 1990). The size of the X-ray emission region is slightly larger than the Suzaku Point Spread Function (PSF) of 1.8 arcmin and smaller than the size of the VHE gamma-ray region. This difference is seen in PWNe such as HESS J1825137 (Aharonian et al., 2006d; Uchiyama et al., 2009) and Vela X (Markwardt & Ogelman, 1995; Aharonian et al., 2006b) and could be explained by the difference between the synchrotron cooling time of the electrons that radiate X-rays and those that produce TeV gamma rays. Electrons with an energy of 100 TeV radiate X-rays and immediately lose their energy by synchrotron cooling (e.g., the energy-loss timescale is yr assuming a magnetic field of 20 G (Sturner et al., 1997)), while electrons with an energy of 1 TeV, which are responsible for the VHE gamma ray emission through IC scattering, are more slowly cooled by synchrotron radiation (e.g., the energy-loss timescale is yr assuming the same parameters as above) and can travel further from their source. However, the ratio between the observed VHE gamma-ray and X-ray fluxes, F(1–10 TeV) / F(2–10 keV) of 34, is much larger than those of known PWNe — , 0.7, and 1.5 for the Crab, MSH 15-52, and Vela X, respectively (Gaensler et al., 1999; Willingale et al., 2001; Gaensler et al., 2002; Dodson et al., 2003; Aharonian et al., 2004, 2005a, 2006b; Manzali et al., 2007; Nakamori et al., 2008). Nevertheless, recent studies of HESS J1640465 (Funk et al., 2007) and HESS J1804216 (Higashi et al., 2008) claim that this large ratio can be explained by a time-evolving electron injection model, in which the number of electrons injected into space by the pulsar decreases proportionally to the spin-down of the pulsar. On the other hand, this large ratio is also expected in an old SNR with an age of yr, because of the difference between the cooling times of electrons and protons (Yamazaki et al., 2006). We therefore discuss both a PWN scenario and an SNR scenario in this paper.
Suzaku source B is positioned towards the center of HESS J1614518 and is coincident with the position of Pismis 22. Since the hydrogen equivalent column density derived from the Suzaku spectrum is cm-2, which is comparable with that of Suzaku source A, Suzaku source B may lie at a similar distance as for Suzaku source A. This source has a non-thermal X-ray emission with a photon index of . This soft index and X-ray luminosities of ergs s-1 and ergs s-1 in the 210 keV and 0.510 keV ranges, respectively, assuming a distance of 10 kpc, are typical values for an anomalous X-ray pulsar (AXP) (Fahlman & Gregory, 1981; Kuiper et al., 2006). The possible existence of the AXP also suggests this source as an SNR, since AXPs are usually associated with SNRs, e.g., 1E 2259+586 with CTB 109 (Fahlman & Gregory, 1981) and 1E 1841045 with Kes 73 (Vasisht & Gotthelf, 1997). Since the position of this source is coincident with Pismis 22, there is a possibility that this emission originates from the stellar winds from the stellar cluster. Non-thermal X-ray emission from a stellar cluster was reported from Westerlund 1 (Muno et al., 2006), and TeV gamma rays were recently detected from this object (Ohm et al., 2009). However, this positional correlation may be only a chance coincidence since the estimated distances to Suzaku source B and Pismis 22 are different by an order of magnitude. Although Suzaku source B might be marginally extended, it is difficult to quantitatively estimate the spatial extension with the Suzaku PSF of 1.8 arcmin. If Suzaku source B is actually extended, additional scenarios besides an SNR could be considered, e.g., a PWN from a pulsar/AXP as discussed in Matsumoto et al. (2008), or emission from the unresolved hot stars in Pismis 22.
The other source, Suzaku source C, is a late B-type star as described in Matsumoto et al. (2008), and thus is not a possible counterpart of HESS J1614518.
Swift observed this region with the X-ray telescope (XRT) and found six X-ray sources (hereafter Swift sources 1 to 6) (Landi et al., 2006, 2007). All these sources were point-like and no diffuse emission was found. Two sources, Swift sources 1 and 4, are located within the field of view (FOV) of the Suzaku observation. Swift source 1 is located close to Pismis 22 with an offset of 42 arcsec. This source is also coincident with Suzaku source B. Swift source 4 is coincident with Suzaku source C. Swift sources 1, 2, 3, 5 are probably stars, while the nature of Swift sources 4 and 6 were not identified, probably due to the poor statistics. Although Suzaku source A was located in the FOV of the Swift XRT, it was not detected with Swift probably due to the limited exposure time (1700 s) and/or the small effective area.
The Fermi-LAT collaboration (Abdo et al., 2010a) reported the detection of gamma rays in the 100 MeV to 100 GeV band from 1FGL J1614.7-5138c positioned 2.7 arcmin away from the peak position of the VHE gamma-ray emission. In the radio band, no counterpart has been found in the HESS J1614518 region; there is no enhancement in the 843 MHz band, where the rms noise level is 2 mJy arcmin-2 (Bock et al., 1999; Murphy et al., 2007). In this paper, we present TeV gamma-ray observations of HESS J1614518 with the CANGAROO-III telescopes and discuss the possible counterpart and the radiation mechanism by considering multi-wavelength observations.
2. Observations
CANGAROO-III is an array of four IACTs (T1, T2, T3, and T4), located at Woomera, South Australia (136∘47E, 31∘06S, 160 m a.s.l.) (Enomoto et al., 2002b). The oldest telescope, T1, which was the CANGAROO-II telescope, has not been in use since 2004 due to its smaller FOV and higher energy threshold. Each telescope has a 10 m diameter reflector which consists of 114 segmented fiber reinforced plastic spherical mirrors mounted on a parabolic frame (Kawachi et al., 2001). The imaging camera system consists of 427 photomultipliers (PMTs) and has a FOV of 4.0 deg (Kabuki et al., 2003). The PMT signals are digitized by charge analog-to-digital converters (ADCs) and multi-hit time-to-digital converters (TDCs) (Kubo et al., 2001). The observations were carried out from 2008 May to August using a wobble mode in which the pointing position was shifted both in declination and right ascension between deg from the target position every 20 minutes (Nakamori et al., 2008). The target position was (R.A., decl. [J2000])=(243∘.579,51∘.820) which is the center of the source position reported by H.E.S.S.
The light-collecting efficiency, including the reflectivity of the mirror segments and the light guides, and the quantum efficiency of PMTs, was monitored by a muon-ring analysis with individual trigger data taken in the same period (Enomoto et al., 2006a). The average quantity of light per unit arc-length of muon rings is approximately proportional to the light-collecting efficiency. We also did not use the second oldest telescope, T2, since it was very difficult to calibrate with muon-ring data to calculate the efficiency at this time due to the deterioration of mirror reflectivity (Enomoto et al., 2009). The two telescopes T3 and T4 were used. From the muon-ring analysis for the data taken in this period, the light-collecting efficiency of each telescope, which is used in the Monte Carlo simulations, with respect to the original mirror production time, was 0.58 and 0.50 for T3 and T4, respectively. We reject the data for which the average trigger-rate over a one minute period was under 5 Hz to remove data taken in cloudy conditions. The effective exposure time amounts to 53.6 hr and the energy threshold was 760 GeV.
3. Analysis
The standard analysis of the CANGAROO-III collaboration (Enomoto et al., 2006a; Kabuki et al., 2007) was applied to the data. The calibrations for the cameras and ADCs were carried out daily using LEDs. After calibration, the recorded charges of each pixel in the camera were converted to the number of photo-electrons. Time-walk corrections for TDC data were carried out using data taken by changing the luminosity of the LEDs. After calibration, every shower image was cleaned through the following criteria. Only pixels that had 5.0 photo-electrons were used as “hit pixels”. Clusters of five or more adjacent hit pixels with arrival times within 30 nsec of the average hit time of all pixels were recognized as a shower cluster. Before calculating image moments — the “Hillas parameters” (Hillas, 1985) — we applied an “edge cut” to the data (Enomoto et al., 2006b) and rejected events having hit pixels in the outer-most layer of the camera. The orientation angles were determined by minimizing the sum of the squared widths with a constraint given by the distance predicted by Monte Carlo simulations.
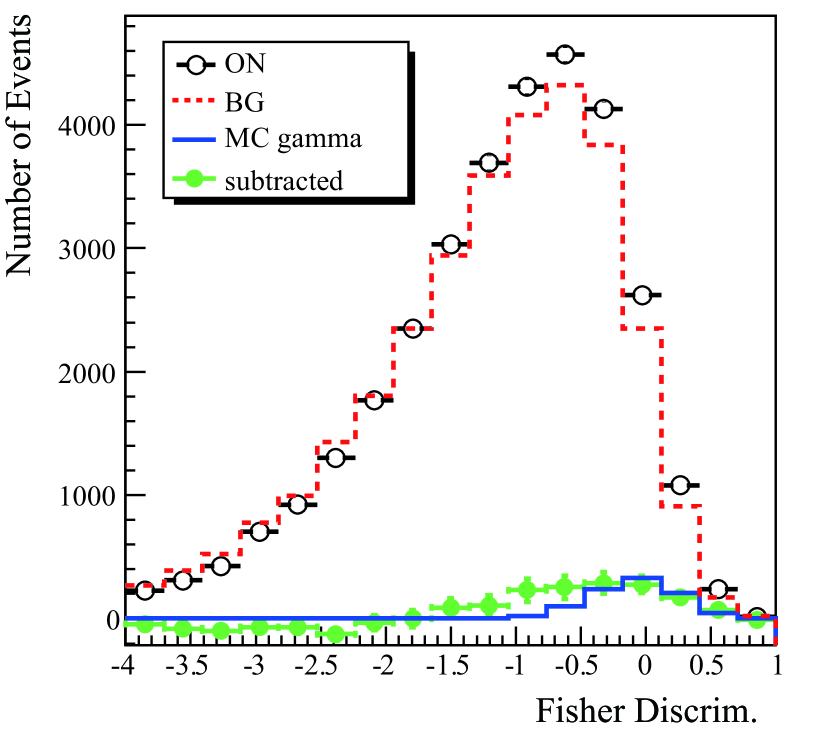
In order to derive the gamma-ray likeliness, we used the Fisher Discriminant method (Fisher, 1936; Enomoto et al., 2006a). The input parameters were
,
where are energy-corrected and for T3 and T4 camera images. The Fisher Discriminant (hereafter FD) is defined as , where is a set of coefficients mathematically determined in order to maximize the separation between two FD distributions for gamma rays and hadrons.
To calculate the background, we selected a ring region around the target, deg2, where is the angular distance to the center of HESS J1614518 (Higashi et al., 2008). We obtained the FD distributions of hadrons from this region and gamma rays from Monte Carlo simulations. Finally, we were able to fit the FD distribution of the events from the target with a linear combination of these two components. The observed FD distributions were represented by
,
where is the ratio of gamma-ray events to the total number of events. Here is a fitting parameter and the obtained FD distributions are shown in Figure 1.
4. Results
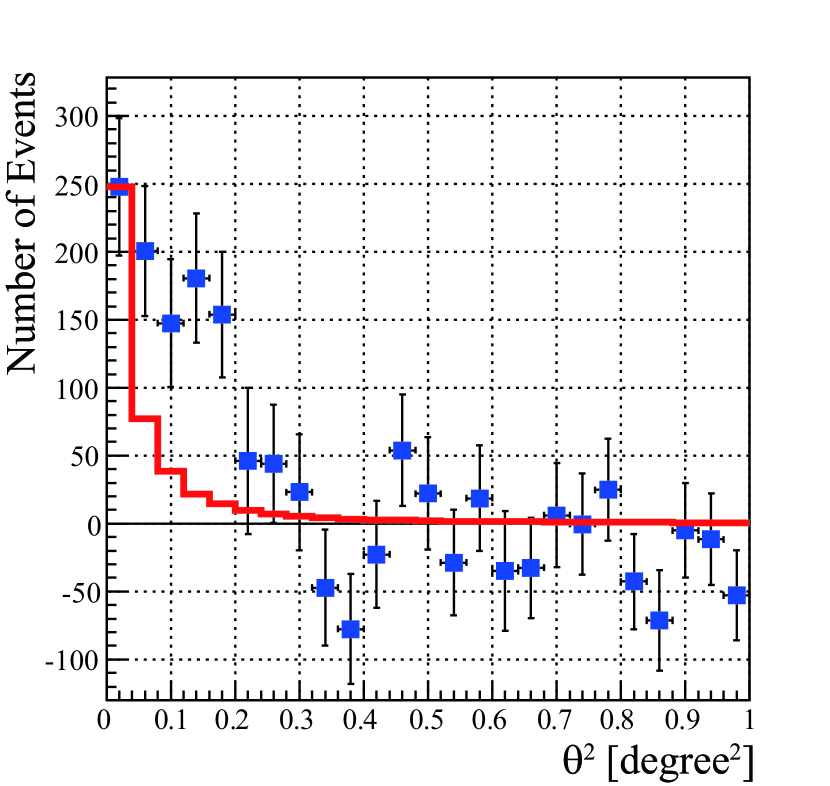
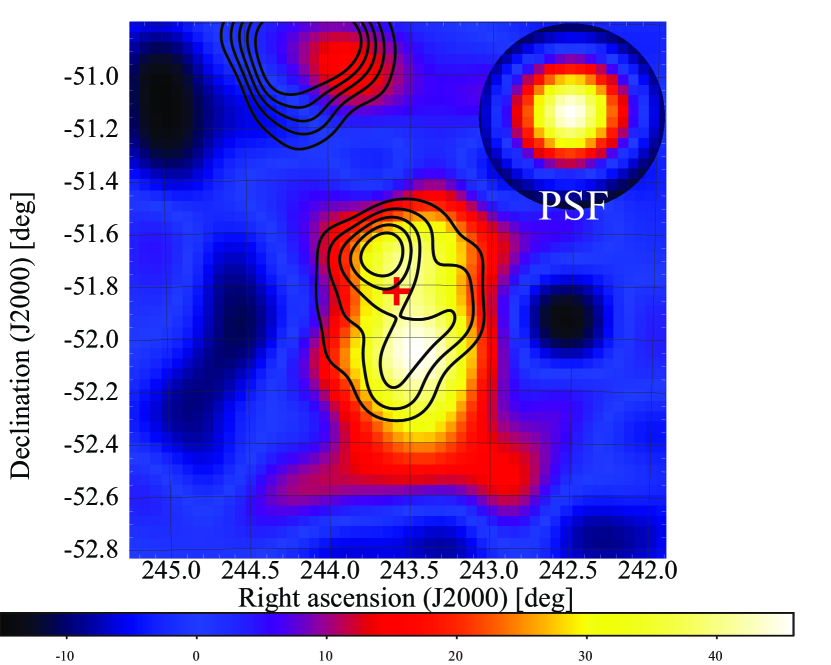
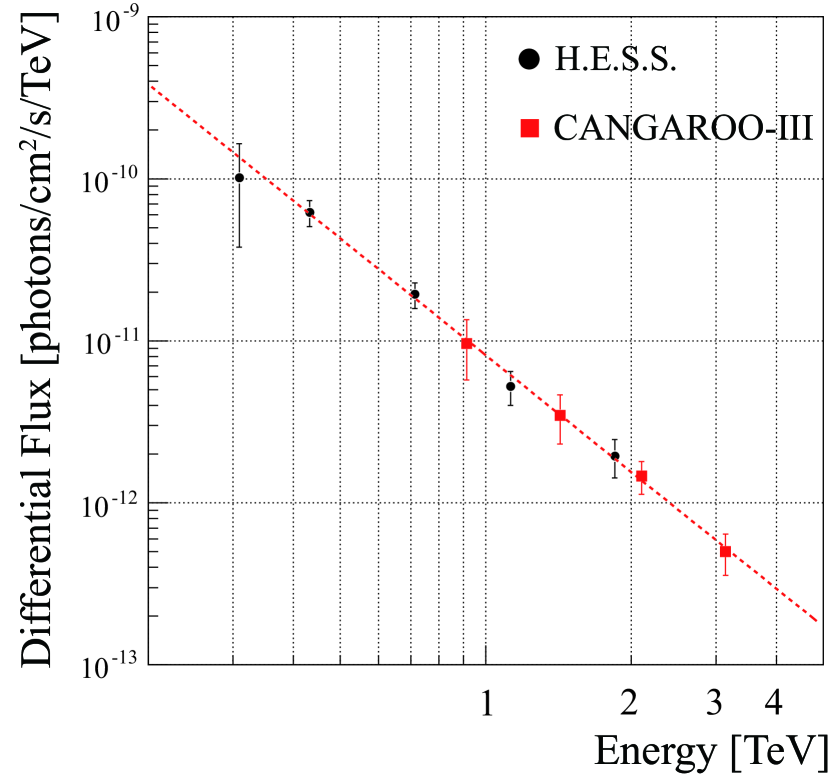
The obtained plot is shown in Figure 2 with the PSF of our telescopes. Above 760 GeV we detected 950107 excess events within deg2. The morphology of gamma-ray–like events, obtained from a gaussian smoothing with the CANGAROO-III PSF of 0.24 deg, is shown in Figure 3. The extent of the VHE gamma-ray emission was estimated by a 2D Gaussian fit on our excess map. The obtained standard deviation was deg which is broader than the CANGAROO-III PSF. The centroid position was determined to be (R.A., decl. [J2000]), . The offset from the best-fit position reported by H.E.S.S. is (R.A., decl.)=(,). The offset is not significant compared with our PSF. A systematic difference due to the difference in energy thresholds between H.E.S.S. and CANGAROO-III may also contribute to this offset. The reconstructed VHE gamma-ray differential flux is shown in Figure 4 together with the H.E.S.S. measurements. The spectrum is compatible with a single power-law: TeV cm-2 s-1 TeV-1 with a photon index of . The relevant systematic errors are due to the atmospheric transparency, night-sky background fluctuations, uniformity of camera pixels, and light-collecting efficiencies. In addition, to estimate the systematic error due to the size of signal integration region, we changed the region from deg2 to 0.30 deg2, which was included in the systematic error. For comparison with the ring-region background, we took background events from opposite positions of HESS J1614518 observations in the wobble mode, and then obtained a differential flux of TeV cm-2 s-1 TeV-1 with a photon index of , which was consistent with that derived with the ring-region background. The VHE gamma-ray extension, centroid position, and flux obtained with CANGAROO-III are consistent with results from H.E.S.S. This result suggests that the VHE gamma-ray emission was unchanged between 2004 and 2008.
5. Discussion
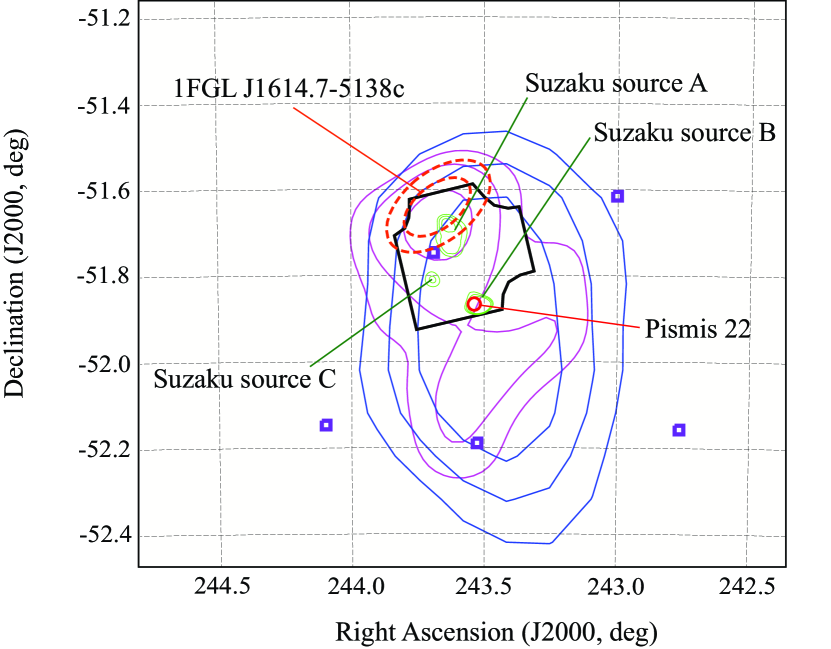
We now discuss the plausible radiation mechanisms of HESS J1614518 using the results of CANGAROO-III, H.E.S.S., Fermi, and Suzaku observations. Since the spectra of Swift sources were not available, we did not use the Swift data. Figure 5 shows the morphological relationship between each observation. The non-thermal X-ray emission from Suzaku source A is positioned very close to the H.E.S.S. gamma-ray peak, the position of the Fermi source 1FGL J1614.7-5138c, and within the emission region detected with CANGAROO-III. Thus, this could be the most likely counterpart for HESS J1614518. We note here that since the FOV of the Suzaku observation covered only the part of the TeV gamma-ray emission region, as shown in Figure 5, the current observed X-ray flux may only be a fraction of the entire X-ray emission from the entire region of the VHE gamma-ray emission. To discuss the emission mechanism with more accuracy, further X-ray observations of the entire region of VHE gamma-ray emission are needed. For further constraints on emission models, we tried to derive the flux at 8 m at the Suzaku source A position, from the archival data with the Infrared Array Camera (IRAC; Fazio et al. (2004)) onboard the Spitzer Space Telescope. However, since there was contamination from a nearby source, we obtained only an upper limit.
SNR Scenario: Suzaku source B, which may be related to a possible AXP, is positioned roughly in the center of the VHE gamma-ray emission. We thus postulate a scenario in which a supernova explosion occurred at the position of Suzaku source B and the shock of the SNR has now reached the position of Suzaku source A, emitting both the X-ray and gamma-ray emission.
PWN Scenario: A PWN could also emit diffuse gamma-ray emission. Five pulsars have been found in this region, PSR J16115209, PSR J16125136, PSR J16135211, PSR J16145144, and PSR J16165208 (Manchester et al., 2005; ATNF Pulsar Catalogue ver.1., 38). As described in section 1, Suzaku source B would be a PWN if associated with a pulsar or AXP. The smaller size of Suzaku source A or source B compared to that of the VHE gamma-rays also appears in other PWNs because of synchrotron cooling (section 1).
We will discuss the PWN scenario and the associated pulsar which could supply enough particles to reproduce both the X-ray emission of Suzaku source A or source B and the VHE gamma-ray emission.
Stellar Wind Scenario: The young open cluster Pismis 22 is located towards the center of HESS J1614518 and is also a possible counterpart. Its age is yr and the distance is 10.4 kpc from the Earth. The coincidence between a young open cluster and a VHE gamma-ray source is also seen in Westerlund 2 and Cyg OB2 as described in section 1. Stellar winds from massive stars could form a shock front, accelerate charged particles, and produce the high energy radiation (Voelk & Forman, 1982; Bednarek, 2007).
Another possibility is an association between an SNR, PWN and the open cluster, since Pismis 22 is old enough for some massive stars to finish their life as supernovae. In addition, as described in section 1, binary systems that emit VHE gamma rays also have been discovered. However, HESS J1614518 does not seem to be associated with a binary system, since all sources of this type have point-like emission, which is in contrast to the results of CANGAROO-III and H.E.S.S. We discuss the above scenarios in detail in the following subsections.
5.1. SNR Scenario
In the SNR scenario, we assume that the X-rays from Suzaku source A and the VHE gamma rays are emitted by charged particles accelerated by the shock in the SNR shell, and Suzaku source B is an associated AXP which is positioned in the center of the SNR shell. Additionally, we will discuss the possible correlation between the SNR and Pismis 22.
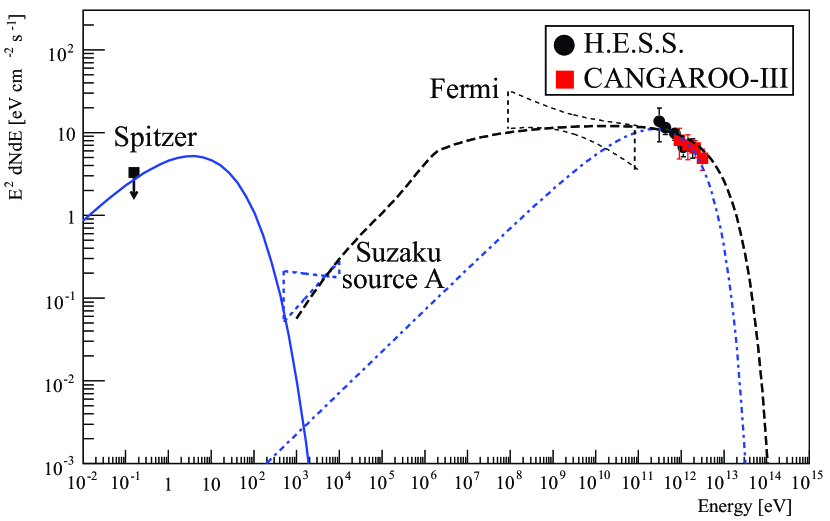
First we examine a leptonic model to explain the observed SED (Fig. 6). For the X-ray spectrum, we use the Suzaku spectrum of Suzaku source A correlated with the VHE gamma-ray peak, with a statistical error at the 90% confidence level. For the Fermi spectrum, we used a 2 statistical error and systematic errors of 1.8 in the flux and 1.2 in the photon index (Abdo et al., 2010a). Figure 6 shows the simple one-zone leptonic model curves for HESS J1614518. Here we calculated synchrotron, inverse Compton, and Bremsstrahlung model curves for a single power-law with an exponential cutoff electron spectrum, , where is the normalization factor, is the electron energy, is the spectral index of the electrons, and is the maximum accelerated electron energy. To calculate the IC radiation, we used cosmic-ray microwave background and an interstellar radiation field (ISRF) derived from the GALPROP package (v50p) (Porter & Strong, 2005; Strong & Moskalenko, 2006) to estimate the seed photon field around the HESS J1614518 region. Energy densities of 1.4 eV cm-3 and 5.5 eV cm-3 for IR and optical light were obtained, respectively. In addition, this radiation field changed by less than an order of magnitude when we varied the distance from 1 kpc to 10 kpc, with values in the range from 0.9 to 1.7 eV cm-3 and 1.1 to 5.5 eV cm-3 for IR and and optical light, respectively. We fixed the power-law index to and fitted the VHE gamma-ray spectrum by the IC emission. The maximum energy and total energy of the electrons obtained were 4.21.5 TeV and ergs. From comparison between the synchrotron model and the Spitzer upper limit, an upper limit of a magnetic field is determined to be 6 G. The harder and fainter spectrum in the X-ray band compared to the VHE gamma-ray spectrum did not allow the observed X-ray and VHE gamma-ray spectra to be produced with synchrotron and IC emission, respectively, by a single power law distribution of electrons. There is also the possibility that Bremsstrahlung produces both the X-ray and VHE gamma-ray emission (Uchiyama et al., 2002), as shown in Figure 6. This model gives a good reproduction for an ambient matter density of 600 p cm-3. However, Rowell et al. (2008) reported that they found no obvious overlapping molecular clouds across a range of inferred distances up to 6 kpc, with the NANTEN 12CO(J=1-0) survey data (Matsunaga et al., 2001). In addition, we estimated an ambient matter density from the velocity-integrated data of the CO survey (Dame et al., 2001) to be 80 or 8 p cm-3 for 10 kpc and 1 kpc, respectively. Thus, the Bremsstrahlung model that requires an ambient matter density of 600 p cm-3 was rejected. Furthermore, there is difficulty in explaining the morphological difference between the X-ray and the VHE gamma-ray emission because it requires an unlikely situation in which the relatively high energy (multi-TeV) electrons that are responsible for the VHE gamma-ray emission are distributed over a more extended region than the relatively low energy (multi-keV) electrons which are responsible for the X-ray emission.
We also checked that our estimate of the non-thermal synchrotron flux did not violate the thermal optical emission. The intrinsic optical background flux over the solid angle for the gamma-ray emission region eV cm-2s-1 is obtained from , where is the energy density of 5.5 eV cm-3 for the optical light, is the speed of the light, and sr is the solid angle for the region. The optical background radiation is 105 times larger than the optical synchrotron flux for a magnetic field of 6 G (Fig. 6).
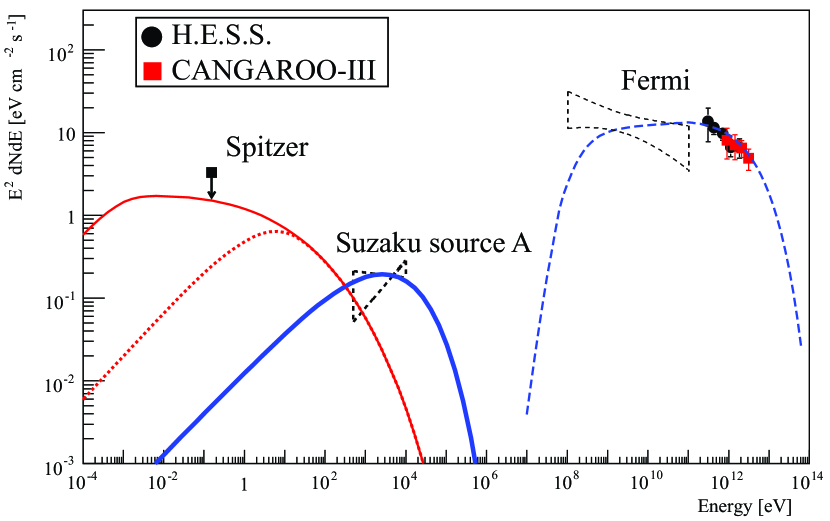
Second, we examined a neutral-pion decay model. Based on a model proposed by Yamazaki et al. (2006), only nucleonic particles remain in an old SNR with an age of yr, while primary electrons have already lost most of their energy by the synchrotron cooling. Figure 7 shows the SED with the assumption that the population of accelerated protons can be expressed by a single power-law with an exponential cutoff, . We set the power-law index to . The best-fit cutoff energy was obtained to be TeV. The total energy of high energy protons was calculated to be ergs. By setting cm-3, the efficiency of energy conversion to accelerate protons is 10% for a typical total supernova explosion kinetic energy of ergs. As described above, no obvious molecular cloud was found in the NANTEN 12CO(J=1-0) survey data. In addition, an ambient matter density from the velocity-integrated data of the CO survey (Dame et al., 2000) was estimated to be 80 or 8 p cm-3 for 10 kpc and 1 kpc, respectively. Thus, an assumption of 100 p cm-3 is likely for 10 kpc, but not for 1 kpc. Further observations are necessary to investigate the validity for such assumed density. Assuming the spectral index, , the maximum energy of primary electrons is determined to be . The turnover energy of synchrotron emission is determined from keV . Since the hard index of the X-ray spectrum required keV, a lower limit for the magnetic field of 200 G was determined from this equation. The model curve for this lower limit condition was shown in Figure 7. From this magnetic field value, we set a lower limit to the number ratio of protons to primary electrons, .
We also calculated the contribution of emissions from secondary electrons from p-p interactions between the same proton population as above and the ambient matter density of 100 cm-3. We followed the calculation in Kelner & Aharonian (2008) to derive the spectrum of the secondary electrons. Assuming a distance of 10 kpc from the Earth, the distance between Suzaku source A and source B was calculated to be 35 pc. Thus, we assumed that the radius of the SNR is 35 pc and roughly estimated the age of the SNR using the equation (2) in Yamazaki et al. (2006) to be yr. Thus, the emissions from the secondary electrons were derived by assuming continuous injection of electrons produced by a constant proton spectrum over yr with a magnetic field of 200 G (Atoyan & Aharonian, 1999). The obtained synchrotron curve is also shown in Figure 7. The obtained inverse Compton and Bremsstrahlung emissions were able to be neglected since the number of electrons is sufficiently small. Since the synchrotron emission from the secondary electrons was not able to explain the X-ray emission, the X-ray emission might originate in the synchrotron emission from the primary electrons, as shown in Figure 7, or other emission mechanisms. Since the synchrotron emission from the secondary electrons dominates below the infrared band, the detection of the emission in the radio to infrared bands could support the hypothesis that the VHE gamma-ray emission is produced by the neutral-pion decay. Because the Spitzer upper limit was above the predicted flux of synchrotron emission, more detailed observations are needed.
To discuss the possible association between the SNR and Pismis 22, we estimated the SNR age using the distance to Pismis 22 with the assumption that a supernova explosion occurred at the position of Pismis 22 and the shock front has now reached at the VHE gamma-ray peak position. By using the same equation (2) in Yamazaki et al. (2006), the age was obtained to be yr for a distance of 1 kpc. Since the lower limit of a magnetic field was obtained to be 200 G as above, the synchrotron cooling time of 100 TeV electrons decreased to 1 yr. For a distance of 1 kpc, the required total energy of protons could be reduced if the number density of ambient matter is the same as for a distance of 10 kpc. If the total energy of protons is fixed to be 1050 ergs, the required density of ambient matter is reduced to cm-3 for a distance of 1 kpc. This value was comparable with the typical number density in the interstellar field and does not contradict the fact that no obvious molecular cloud was found in the NANTEN 12CO(J=1-0) survey data. The contribution of emissions from secondary electrons was shown in Figure 7, assuming the injection time of yr with a magnetic field of 200 G. The synchrotron emission from the secondary electrons was not able to explain the X-ray spectrum of Suzaku source A. The X-ray emission might originate in the synchrotron emission from the primary electrons, or other emission mechanisms. Since the flux of synchrotron emission from the secondary electrons in the radio to infrared bands was lower than that of the case of a distance of 10 kpc, as shown in Figure 7, a determination of the spectrum below the infrared band is a key to reveal the origin of the SNR. Additionally, an observation of thin thermal plasma in the X-ray band will provide useful information such as plasma temperature or chemical abundances. For example, the detection of high abundance of -elements (O, Mg, Si, S, Ca, and Ti) compared to that of iron, which is expected in a massive star explosion (Kobayashi et al., 2006), may support the SNR scenario. In fact, a recent Suzaku observation of the open cluster Westerlund 2 detected metal-rich thermal emission, suggesting that the diffuse X-ray and VHE gamma-ray emission may have originated from a hypernova remnant (Fujita et al., 2009).
5.2. Stellar Wind Scenario
The VHE gamma-ray emission might have been produced by hadrons accelerated in winds from massive stars in Pismis 22 (Voelk & Forman, 1982; Bednarek, 2007). A fraction of the stellar wind energy can be transferred to relativistic particles. Assuming that the shock acceleration generates a single power-law spectrum of primary particles, we can apply the discussion made in the SNR scenario. We discuss the energetics for the hadronic origin here to produce the observed gamma-ray emission. A single O-type star loses mass at a rate of per year with a stellar wind velocity of km s-1 (Castor et al., 1975). The rate of kinetic energy emitted from the single star is erg s-1. If we assume an energy conversion efficiency to particle acceleration of 5 %, which is the maximum efficiency adopted for a hadronic model in Bednarek (2007), an ambient matter density of cm-3, a distance of 1 kpc, and an age of 40 Myr, two O-type stars are required in Pismis 22 to produce the observed VHE gamma-ray spectrum in the hadronic scenario. However, no obvious molecular cloud has been found at this distance in the NANTEN data, as described above.
5.3. PWN Scenario
PWNe are the largest class of identified Galactic VHE gamma-ray sources. We discuss the possibility of HESS J1614518 being a PWN in this subsection.
As calculated in Rowell et al. (2008), the spin-down luminosity of each of the five nearby pulsars (Fig. 5) is smaller than the TeV gamma-ray luminosity. Thus, none of already known pulsars can be associated with HESS J1614518. There is also the possibility that an undiscovered pulsar with a high spin-down power, sufficient to explain the observed gamma-ray luminosity, might be located in the vicinity of Suzaku source A or source B. We estimated the pulsar age to be 24 kyr and 23 kyr for Suzaku source A and B, respectively, using the correlation between pulsar age and the ratio of gamma-ray flux and X-ray flux from the PWN (Mattana et al., 2009). For this relatively old age, we should apply the time-evolving electron injection model (section 1). We applied this model to HESS J1614518, following the calculation in Higashi et al. (2008) applied to HESS J1804-216. Although this model can explain the large ratio between the X-ray and TeV gamma-ray fluxes assuming a single power-law electron distribution, the model showed a very large discrepancy with the sub-GeV flux observed with Fermi, the model curve is 30 times larger than the observed flux at 0.1 GeV. Thus, the time-evolving electron injection model with a single power-law electron distribution was rejected. The MeV/GeV component could arise from the different mechanism than the TeV emission.
Although the present sensitivity in the radio band may not be sufficient to detect this unknown pulsar, further observations in the GeV band could detect a radio quiet pulsar like Geminga, which was detected with CGRO EGRET (Bertsch et al., 1992), or sixteen previously unknown pulsars which were recently discovered with Fermi (Abdo et al., 2009). In addition, future X-ray observations could detect pulsed emission from Suzaku source A or source B. Given these detections, emission models for PWNs (e.g., Abdo et al., 2010b; Tanaka & Takahara, 2010; Slane et al., 2010; Bucciantini et al., 2011), using a broken power-law distribution of electrons, might be able to reveal that the VHE gamma-ray emission of this unidentified source originates from a PWN.
6. Conclusion
The observation of HESS J1614518 with the CANGAROO-III telescopes confirms the VHE gamma-ray emission reported by H.E.S.S. The differential energy spectrum can be fitted with a single power law:TeV cm-2s-1TeV-1 with a photon index of . We discuss the possible counterparts for this object using the results of observations with Suzaku and Fermi. For the SNR scenario, a one-zone leptonic model was not able to account for the observed SED. Hadronic models gave a good reproduction of the SED and the typical SNR explosion energy of ergs is able to supply the total energy of protons. Since the required number densities of the ambient matter were cm-3 and cm-3 for a distance to the SNR of 1 kpc and 10 kpc, respectively, detailed molecular observations could determine whether the SNR originated from Pismis 22 (d1 kpc) or a farther distance. As there were also differences in the spectrum of the emission from the secondary electrons, a determination of the spectrum below the infrared band would help determine the likelihood of an SNR origin. For the PWN scenario, the nearby known pulsars are not responsible since the spin-down powers are insufficient to produce the observed TeV gamma-ray luminosity. Further observations to search a pulsar are necessary to investigate the PWN scenario. For the stellar wind scenario, Pismis 22 was required to contain two O-type stars through its entire age from energetics considerations. However, the required number density of the ambient matter of cm-3 may not be consistent with the results of the NANTEN observations.
To identify HESS J1614518, more detailed multiwavelength observations are required. To discuss the stellar wind origin in more detail, a determination of the number of OB stars is necessary. For the SNR scenario, the ultra-high energy resolution of the SXS onboard Astro-H could detect line emissions with a high abundance of -elements compared to that of iron, which would indicate that HESS J1614518 is an SNR. To show that the Suzaku source B is an AXP, supporting the SNR or PWN scenario, a high time-resolution X-ray observation is needed to detect a pulsed signal from the source. More detailed gamma-ray spectroscopy with Fermi, and the Cherenkov Telescope Array (CTA, 2010) could determine the origin of the accelerated particles.
References
- Abdo et al. (2007) Abdo, A. A., et al. 2007, ApJ, 664, L91
- Abdo et al. (2010a) Abdo, A. A., et al. 2010a, ApJS, 188, 405
- Abdo et al. (2010b) Abdo, A. A., et al. 2010b, ApJ, 714, 927
- Abdo et al. (2009) Abdo, A. A., et al. 2009, arXiv:0910.1608
- Aharonian et al. (2002) Aharonian, F., et al. 2002, A&A, 393, L37
- Aharonian et al. (2004) Aharonian, F., et al. 2004, ApJ, 614, 897
- Aharonian et al. (2005a) Aharonian, F., et al. 2005a, A&A, 435, L17
- Aharonian et al. (2005b) Aharonian, F., et al. 2005b, Science, 307, 1938
- Aharonian et al. (2005c) Aharonian, F., et al. 2005c, A&A, 437, L7
- Aharonian et al. (2005d) Aharonian, F., et al. 2005d, A&A, 431, 197
- Aharonian et al. (2005e) Aharonian, F., et al. 2005e, A&A, 442, 1
- Aharonian et al. (2006a) Aharonian, F., et al. 2006a, ApJ, 636, 777
- Aharonian et al. (2006b) Aharonian, F., et al. 2006b, A&A, 448, L43
- Aharonian et al. (2006c) Aharonian, F., et al. 2006c, A&A, 449, 223
- Aharonian et al. (2006d) Aharonian, F., et al. 2006d, A&A, 460, 365
- Aharonian et al. (2007) Aharonian, F., et al. 2007, A&A, 467, 1075
- Aharonian et al. (2008) Aharonian, F., et al. 2008, A&A, 477, 353
- Aharonian et al. (2009) Aharonian, F., et al. 2009, ApJ, 692, 1500
- Albert et al. (2006) Albert, J., et al. 2006, Science, 312, 1771
- ATNF Pulsar Catalogue ver.1. (38) ATNF Pulsar Catalogue, http://www.atnf.csiro.au/research/pulsar/psrcat/
- Atoyan & Aharonian (1999) Atoyan, A. M., & Aharonian, F. A. 1999, MNRAS, 302, 253
- Bednarek (2007) Bednarek, W. 2007, MNRAS, 382, 367
- Bertsch et al. (1992) Bertsch, D. L., et al. 1992, Nature, 357, 306
- Bock et al. (1999) Bock, D. C.-J., Large, M. I., & Sadler, E. M. 1999, AJ, 117, 1578
- Bohlin et al. (1978) Bohlin, R. C., Savage, B. D., & Drake, J. F. 1978, ApJ, 224, 132
- Bucciantini et al. (2011) Bucciantini, N., Arons, J., & Amato, E. 2011, MNRAS, 410, 381
- Castor et al. (1975) Castor, J. I., David, C., & Klein, R. I. 1975, ApJ, 195, 157
- Chatterjee et al. (2005) Chatterjee, S., et al. 2005, ApJ, 630, L61
- CTA (2010) CTA consortium, arXiv:1008.3703
- Dame et al. (2001) Dame, T. M., Hartmann, D., and Thaddeus, P., 2001, ApJ, 547, 792
- Dickey & Lockman (1990) Dickey, J. M., & Lockman, F. J. 1990, ARA&A, 28, 215
- Dodson et al. (2003) Dodson, R., Legge, D., Reynolds, J. E., & McCulloch, P. M. 2003, ApJ, 596, 1137
- Enomoto et al. (2002a) Enomoto, R., et al. 2002a, Nature, 416, 823
- Enomoto et al. (2002b) Enomoto, R., et al. 2002b, Astroparticle Physics, 16, 235
- Enomoto et al. (2006a) Enomoto, R., et al. 2006a, ApJ, 638, 397
- Enomoto et al. (2006b) Enomoto, R., et al. 2006b, ApJ, 652, 1268
- Enomoto et al. (2009) Enomoto, R., et al. 2009, ApJ, 703, 1725
- Fazio et al. (2004) Fazio, G. G. et al. 2004, ApJS, 154, 10
- Fahlman & Gregory (1981) Fahlman, G. G., & Gregory, P. C. 1981, Nature, 293, 202
- Fisher (1936) Fisher, R. A. 1936, Annals of Eugenics, 7, 179
- Fujita et al. (2009) Fujita, Y., Hayashida, K., Takahashi, H., & Takahara, F. 2009, PASJ, 61, 1229
- Funk et al. (2007) Funk, S., et al. 2007, ApJ, 662, 517 2007
- Gaensler et al. (1999) Gaensler, B. M., Brazier, K. T. S., Manchester, R. N., Johnston, S., & Green, A. J. 1999, MNRAS, 305, 724
- Gaensler et al. (2002) Gaensler, B. M., Arons, J., Kaspi, V. M., Pivovaroff, M. J., Kawai, N., & Tamura, K. 2002, ApJ, 569, 878
- Higashi et al. (2008) Higashi, Y., et al. 2008, ApJ, 683, 957
- Hillas (1985) Hillas, A. M. 1985, Proc. 19th ICRC (La Jolla), 3, 445
- Hinton & Aharonian (2007) Hinton, J. A., & Aharonian, F. A. 2007, ApJ, 657, 302
- Kabuki et al. (2003) Kabuki, S., et al. 2003, Nucl. Inst. Meth. A, 500, 318
- Kabuki et al. (2007) Kabuki, S., et al. 2007, ApJ, 668, 968
- Katagiri et al. (2005) Katagiri, H., et al. 2005, ApJ, 619, L163
- Kawachi et al. (2001) Kawachi, A., et al. 2001, Astropart. Phys., 14, 261
- Kelner & Aharonian (2008) Kelner, S. R., & Aharonian, F. A. 2008, Phys. Rev. D, 78, 034013
- Kobayashi et al. (2006) Kobayashi, C., Umeda, H., Nomoto, K., Tominaga, N., & Ohkubo, T. 2006, ApJ, 653, 1145
- Kubo et al. (2001) Kubo, H., et al. 2001, Proc. 27th ICRC (Hamburg), 2900
- Kuiper et al. (2006) Kuiper, L., Hermsen, W., den Hartog, P. R., and Collmar, W. 2006, ApJ, 645, 556
- Landi et al. (2006) Landi, R., et al. 2006, ApJ, 651, 190
- Landi et al. (2007) Landi, R., et al. 2007, ATel, 1047
- Livingstone et al. (2006) Livingstone, M. A., Kaspi, V. M., Gotthelf, E. V., & Kuiper, L. 2006, ApJ, 647, 1286
- Malkov et al. (2005) Malkov, M. A., Diamond, P. H., & Sagdeev, R. Z. 2005, ApJ, 624, L37
- Manchester et al. (2005) Manchester, R. N., Hobbs, G. B., Teoh, A., & Hobbs, M. 2005, AJ, 129, 1993
- Manzali et al. (2007) Manzali, A., De Luca, A., & Caraveo, P. A. 2007, ApJ, 669, 570
- Markwardt & Ogelman (1995) Markwardt, C. B., & Ogelman, H. 1995, Nature, 375, 40
- Matsumoto et al. (2008) Matsumoto, H., et al. 2008, PASJ, 60, 123
- Matsunaga et al. (2001) Matsunaga, K., Mizuno, N., Moriguchi, Y., Onishi, T., Mizuno, A., & Fukui, Y. 2001, PASJ, 53, 1003
- Mattana et al. (2009) Mattana, F., et al. 2009, ApJ, 694, 12
- Montmerle (1979) Montmerle, T. 1979, ApJ, 231, 95
- Muno et al. (2006) Muno, M. P., Law, C., Clark, J. S., Dougherty, S. M., de Grijs, R., Portegies Zwart, S., & Yusef-Zadeh, F. 2006, ApJ, 650, 203
- Muraishi et al. (2000) Muraishi, H., et al. 2000, A&A, 354, L57
- Murphy et al. (2007) Murphy, T., Mauch, T., Green, A., Hunstead, R. W., Piestrzynska, B., Kels, A. P., & Sztajer, P. 2007, VizieR Online Data Catalog, 8082, 0
- Nakamori et al. (2008) Nakamori, T., et al. 2008, ApJ, 677, 297
- Ohm et al. (2009) Ohm, S., et al. 2009, arXiv:0906.2637
- Ohm et al. (2010) Ohm, S., et al. 2010, Astronomical Society of the Pacific Conference Series, 422, 265
- Piatti et al. (2000) Piatti, A. E., Claria, J. J., and Bica, E. 2000, A&A, 360, 529
- Porter & Strong (2005) Porter, T. A., & Strong, A. W. 2005, Proc. 29th ICRC (Pune), 4, 77
- Rowell et al. (2008) Rowell, G., Horns, D., Fukui, Y., & Moriguchi, Y. 2008, AIP Conf. Series, 1085, 241
- Slane et al. (2010) Slane, P., Castro, D., Funk, S., Uchiyama, Y., Lemiere, A., Gelfand, J. D., & Lemoine-Goumard, M. 2010, ApJ, 720, 266
- Strong & Moskalenko (2006) Strong, W.S., & Moskalenko, I.V., 2006, GALPROP project, http://galprop.stanford.edu/web_galprop/galprop_home.html
- Sturner et al. (1997) Sturner, S. J., Skibo, J. G., Dermer, C. D., & Mattox, J. R. 1997, ApJ, 490, 619
- Tanaka et al. (2008) Tanaka, T., et al. 2008, ApJ, 685, 988
- Tanaka & Takahara (2010) Tanaka, S. J., & Takahara, F. 2010, ApJ, 715, 1248
- TeVCAT ver.3.400 (2011) TeVCAT, http://tevcat.uchicago.edu/
- Uchiyama et al. (2002) Uchiyama, Y., Takahashi, T., Aharonian, F. A., & Mattox, J. R. 2002, ApJ, 571, 866
- Uchiyama et al. (2009) Uchiyama, H., Matsumoto, H., Tsuru, T. G., Koyama, K., & Bamba, A. 2009, PASJ, 61, 189
- Uchiyama et al. (2007) Uchiyama, Y., Aharonian, F. A., Tanaka, T., Takahashi, T., & Maeda, Y. 2007, Nature, 449, 576
- Vasisht & Gotthelf (1997) Vasisht G. & Gotthelf E.V. 1997, ApJ, 486, L129
- Voelk & Forman (1982) Voelk, H. J., & Forman, M. 1982, ApJ, 253, 188
- Yamazaki et al. (2006) Yamazaki, R., et al. 2006, MNRAS, 371, 1975
- Yamazaki et al. (2009) Yamazaki, R., Kohri, K., & Katagiri, H. 2009, A&A, 495, 9
- Watanabe et al. (2003) Watanabe, S., et al. 2003, Proc. 28th ICRC (Tsukuba), 4, 2397
- Weekes et al. (1989) Weekes, T. C., et al. 1989, ApJ, 342, 379
- Willingale et al. (2001) Willingale, R., Aschenbach, B., Griffiths, R. G., Sembay, S., Warwick, R. S., Becker, W., Abbey, A. F., & Bonnet-Bidaud, J.-M. 2001, A&A, 365, L212