A Search for Young Stars in the S0 Galaxies
of a Super-Group
at
Abstract
We analyze GALEX UV data for a system of four gravitationally-bound groups at , SG1120, which is destined to merge into a Coma-mass cluster by , to study how galaxy properties may change during cluster assembly. Of the 38 visually-classified S0 galaxies, with masses ranging from –, we detect only one in the NUV channel, a strongly star-forming S0 that is the brightest UV source with a measured redshift placing it in SG1120. Stacking the undetected S0 galaxies (which generally lie on or near the optical red-sequence of SG1120) still results in no NUV/FUV detection (). Using our limit in the NUV band, we conclude that for a rapidly truncating star formation rate, star formation ceased at least to Gyr ago, depending on the strength of the starburst prior to truncation. With an exponentially declining star-formation history over a range of time-scales, we rule out recent star-formation over a wide range of ages. We conclude that if S0 formation involves significant star formation, it occurred well before the groups were in this current pre-assembly phase. As such, it seems that S0 formation is even more likely to be predominantly occurring outside of the cluster environment.
Subject headings:
Galaxies: Groups: General — Galaxies: evolution1. Introduction
S0 galaxies are more common in denser environments than in the field (Dressler, 1980), and the fraction of S0 galaxies increases over time (Dressler et al., 1997; Fasano et al., 2000; Desai et al., 2007), such that groups/clusters at have S0 fractions times greater than at . Due to the commensurate decline in the spiral fraction, these findings have been interpreted as arising from the transformation of spirals into S0’s. Further observations have refined the model to suggest that over this redshift range groups are the primary site of S0 formation (e.g., Wilman et al., 2009; Just et al., 2010), i.e. the galaxies are “preprocessed” in groups prior to accretion into the cluster (e.g., Zabludoff et al., 1996).
However, the correlation between groups and clusters, and the uncertainty in determining whether one is observing a group that will soon fall into a cluster, complicate the interpretation of environmentally dependent evolution. After all, galaxy properties begin to change well outside of what is typically referred to as a cluster (i.e., 2 to 3 virial radii; Lewis et al., 2002; Gómez et al., 2003). The question then becomes whether S0 formation occurs in isolated groups or only when a group enters this meta-cluster environment. Is S0 formation related to the changes in star formation properties observed in the far outskirts of clusters?
Super Group 1120-1202 (hereafter SG1120) provides a unique opportunity to address these questions. It is a bound collection of four galaxy groups at that is in the process of assembling into a cluster. The four groups will merge by to form a cluster one-third the mass of Coma or greater (Gonzalez et al., 2005), yet they are clearly independent groups as observed. Spectroscopic redshifts and morphological classifications exist, allowing detailed analysis of its constituent galaxies. The fraction of S0 galaxies in SG1120 is already as high as that of clusters at similar redshift (Kautsch et al., 2008), demonstrating that the high-density, massive cluster environment is not the primary site of S0 formation. The question of whether these S0’s formed recently, in the pre-assembly epoch, is that which we now consider.
To determine whether the S0’s formed recently, we measure their recent star formation history (SFH). A host of different mechanisms have been suggested for the transformation, including mergers and galaxy-galaxy interactions (Toomre & Toomre, 1972; Icke, 1985; Lavery & Henry, 1988; Byrd & Valtonen, 1990; Mihos, 2004; Bekki & Couch, 2011), ram pressure stripping (Gunn & Gott, 1972; Abadi et al., 1999; Quilis et al., 2000), strangulation (Larson et al., 1980; Bekki et al., 2002), and harassment (Richstone, 1976; Moore et al., 1998). The different mechanisms have their own strengths and weaknesses. A difficulty with ram-pressure stripping as the primary mechanism lies with accounting for the large fraction of S0’s in the field (e.g., Dressler, 1980, 2004), although ram-pressure stripping has been clearly observed in clusters (e.g., Irwin et al., 1987; Kenney & Koopmann, 1999) and could account for the deficiency of HI gas observed in cluster spirals (e.g., van den Bergh, 1976; Giovanelli & Haynes, 1983; van Gorkom, 1996, 2004). On the other hand dynamical interactions (i.e. mergers and tidal effects) are consistent with groups as the primary site of S0 formation (e.g., Wilman et al., 2009; Just et al., 2010), although in this scenario it is unclear why a comparable star-formation quenching efficiency is observed in both groups and clusters (Poggianti et al., 2009). For an excellent review of these different mechanisms and their ability to explain observations across different environments and redshift, we refer the reader to Boselli et al. (2006). These processes all involve the halting of star formation, but operate on different timescales and affect the SFH differently. By focusing on the SFH’s of the S0’s in SG1120 we can constrain these mechanisms acting in a currently assembling cluster.
Some measures of the SFH’s of the S0’s in SG1120 are already available. Nearly all the S0’s lie on or near the optical red sequence (Figure 1) and inspection of their optical spectra reveal no emission lines, suggesting no significant ongoing star formation. Strong Balmer absorption indicative of star-formation within the past Gyr (so-called EA galaxies; initial work by Dressler & Gunn (1983) and recent work, e.g., Yang et al. (2008)) is also absent in their spectra. However, all of these signatures are primarily sensitive to significant bursts of recent star formation ( tens of percents by stellar mass). If the S0 formation process involves more modest bursts (or just a truncation of a low level of star formation), and if this happened recently ( Gyr ago), then detection in the UV may be the best way to identify it. With these goals in mind, we have obtained GALEX (Martin et al., 2005; Morrissey et al., 2005) imaging of SG1120.
Our paper is organized as follows. In §2 we describe the data that appear in this study. In §3 we present our results, which we then discuss and summarize in §4. We adopt a cosmology with km Mpc-1, , and . Optical magnitudes are in the Vega system while UV magnitudes are in the AB system; one can convert the and magnitudes to the AB system by adding and , respectively.

2. Data
Our analysis utilizes a combination of new and previously published data, including GALEX, optical, and mid-infrared (MIR) imaging, spectroscopy, and morphological classifications from high resolution imaging.
In February 2009 we obtained GALEX imaging of SG1120 in both the NUV and FUV bands111The NUV and FUV bands have effective wavelengths of Å and Å, respectively., with exposure times of 31.5 ks and 33.0 ks, respectively. We generate photometric catalogs using SEXtractor v2.8.6 (Bertin & Arnouts, 1996) with matched apertures on the NUV and FUV images. We apply a detection threshold on the NUV image of per pixel, with a minimum of 5 adjacent pixels required for a detection, and fix aperture radii at 5″ (approximately twice GALEX’s FWHM). We identify UV sources by cross-correlating the detections to galaxy optical locations using a 1″ matching threshold. We correct for foreground galactic extinction with the Schlegel et al. (1998) dust maps and the O’Donnell (1994) Milky Way extinction curve.
We utilize and band VLT/VIMOS photometry (Le Fèvre et al., 2003) from Tran et al. (2009, hereafter T09). Galactic extinction is corrected for similarly as above (O’Donnell, 1994; Schlegel et al., 1998). For the optical data, we quote MAG_AUTO magnitudes from SExtractor, which are similar to Kron magnitudes (Kron 1980). While ideally one would want to use PSF- and aperture-matched magnitudes when computing colors, we only use the color for an estimate of stellar mass and to determine whether a galaxy is blue or red. Stellar masses are determined following the prescription of Bell et al. (2003), with the mass-to-light ratios estimated using
| (1) |
assuming the diet Salpeter IMF defined in Bell & de Jong (2001) and rest-frame Vega magnitudes. Using a blue absolute magnitude of for the Sun, a galaxy with and has a stellar mass of . Tracks of constant stellar mass are overplotted in the color-magnitude diagram of Figure 1.
Spitzer imaging from MIPS (Rieke et al., 2004) that appears in T09 is used for estimating MIR SFR’s. T09 calculated by determining the total IR luminosity (–) from the luminosity using a family of IR spectral energy distributions (SEDs) from Dale & Helou (2002). Then, focusing on the SEDs representative of the Spitzer Infrared Nearby Galaxies Survey (Dale et al., 2007), a median conversion factor was chosen at where the SEDs give essentially the same values and the error is limited to –.
Spectroscopy for SG1120 come from VLT/VIMOS (in 2003; Le Fèvre et al., 2003), Magellan/LDSS3 (in 2006), and VLT/FORS2 (in 2007; Appenzeller et al., 1998), with resolutions of 2.5 Å pix-1, 0.7 Å pix-1, and 1.65 Å pix-1, respectively. Further details of the spectroscopic reduction can be found in Tran et al. (2005)
Morphological classifications exist for 143 of the spectroscopically-confirmed SG1120 galaxies (T09) based on images obtained with the Hubble Space Telescope/Advanced Camera for Surveys (HST/ACS) in F814W (/pixel). Although with high-resolution HST imaging it is possible to distinguish between elliptical and S0 galaxies (Postman et al., 2005), some level of uncertainty in the classifications exists regarding orientation angle (Rix & White, 1990), surface brightness dimming, and the “morphological -correction” (Windhorst et al., 2002; Papovich et al., 2003). The latter two effects tend to present more difficulty for classifications of galaxies over a broad range of redshifts, which is not the case for this study. The classification scheme used by T09 assigns galaxies the average T-type visually determined independently by four of the authors. We define our classes as elliptical (), S0 (), and spiralirregular (). Thus, our definition of S0 spans S0/E to S0/a. We require that at least one author classify a galaxy as S0 before it is included in our S0 sample; a combination of elliptical and spiral classifications that average out to numerically meet our S0 criterion will not qualify as an S0. This definition results in 38 SG1120 galaxies classified as S0. This classification scheme is different than that of Desai et al. (2007) for the EDisCS sample (White et al., 2005), which can be used as a comparison sample, although the primary difference is that for a given galaxy they assigned the -type most frequently assigned by their classifiers while we use the average -type. Adopting their classification scheme does not change the results presented below.
3. Results
3.1. UV Analysis
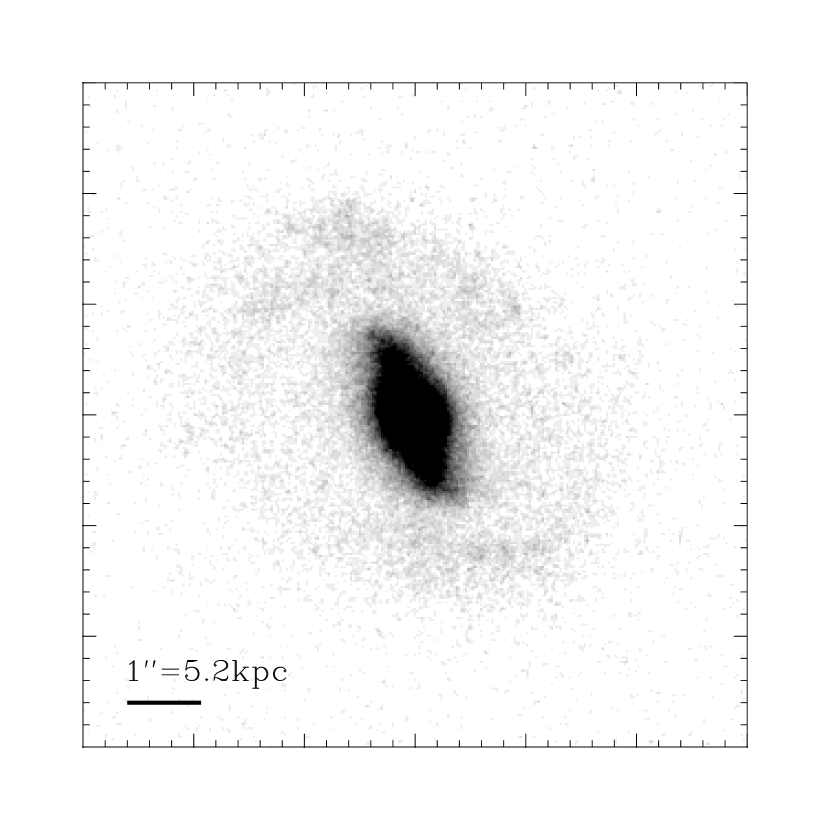
Of the 38 galaxies classified as S0, we detect one in the UV; it is the brightest UV source among the spectroscopically identified galaxies in SG1120, with and ( detection in each band). This galaxy lies off the optical red sequence as well and is detected at 24 m (T09). Based on its MIR and UV detections it has a significant amount of star-formation, yr-1 and yr-1, the latter of which is calculated from its NUV magnitude without an intrinsic extinction correction using the star-formation law of Kennicutt (1998). There is structure apparent in the disk of the galaxy (an HST/ACS F814W image of this galaxy appears in Figure 2), and given its strong SFR it is possible that this is a misclassified spiral. While it could be possible that we are missing a substantial population of blue S0’s by classifying such galaxies with disk structure as spirals, given the already high S0 fraction in SG1120 it is unlikely that this is the case.
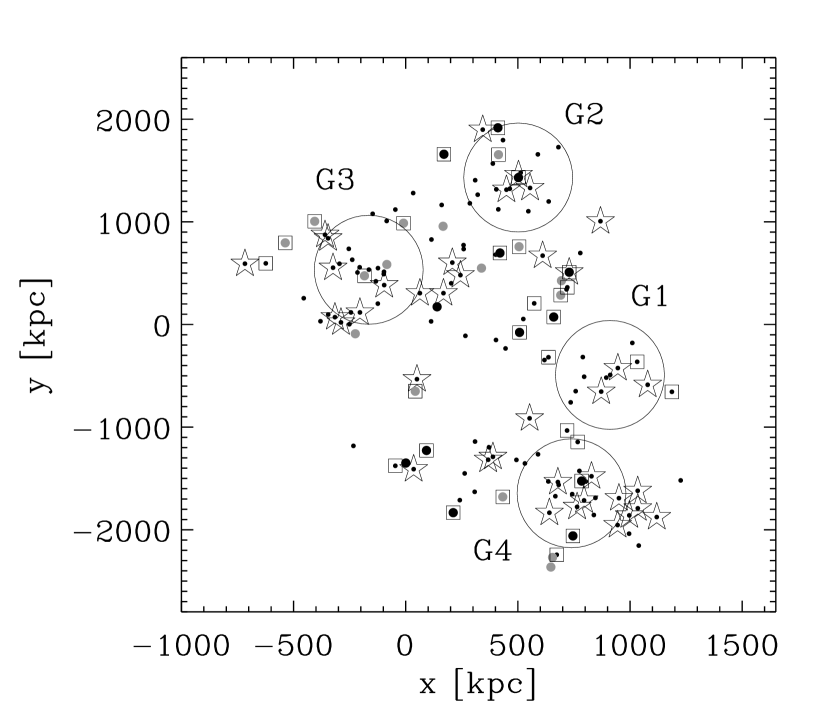
The remaining 37 S0 galaxies are not detected in either the NUV or FUV. Converting our UV detection limits to a SFR limit is not as straightforward as above, since Kennicutt (1998) assumes a flat spectrum from –Å due to continuous star-formation for longer than Myr, which need not be the case when we only have upper limits on the UV emission. Therefore, we estimate the SFR upper limit from the rest-frame Å flux (which is less contaminated from evolved stars than at Å) after fitting the UV and optical photometry of the S0’s with KCORRECT (Blanton & Roweis, 2007). This results in a SFR limit of yr-1 for the individual galaxies. While dust could suppress NUV emission from star-formation, none of these S0’s are detected at 24 m, although the MIR limit is weaker ( yr-1; T09). A spatial plot showing the location of the S0’s, as well as the UV and MIR detections, appears in Figure 3.
To look deeper for signs of recent or ongoing star-formation, we stack the non-UV detected S0 galaxies. One of the S0’s lies near the core of Group 2, within 4″ of a bright UV source (a star-forming elliptical also detected at 24 m with a SFR of 4.35 yr-1; T09). Given the size of the GALEX PSF (), we exclude this source from the stacking analysis, although its inclusion does not affect our results. We median stack 300 by 300 pixel thumbnails and compare the flux at the central location to the distribution of fluxes in non-overlapping -radius apertures arranged such that they do not touch the edge of the stacked image or the galaxy position. The flux of the stacked S0 is above the random fluctuations in both the NUV and FUV, which corresponds to and magnitude, and a SFR of yr-1 (estimated using the above method), an order of magnitude lower than the constraint placed from the individual non-detections alone (see above).222To derive a complementary SFR limit, we perform a similar stacking analysis with the MIPS data. However, given the crowded MIPS field half of the S0 positions are contaminated with emission from nearby sources, making the interpretation of this result more difficult. In any event the limit inferred from this stacking is more than an order of magnitude weaker than the limit derived from the UV stacking.
Early-type galaxies are known to have some UV emission, i.e. “UV-upturn” galaxies (e.g., Greggio & Renzini, 1999; O’Connell, 1999; Brown et al., 2003; Yi & Yoon, 2004, and references therein), which comes from evolved stars. We compare our NUV detection limit with the model of Han et al. (2007), who treat their model galaxy as a simple stellar population with . The expected NUV flux from evolved stars for a galaxy (typical of the S0’s in our sample) is magnitudes fainter than our stacked detection limit.
3.2. Modeling
The lack of detectable NUV emission from all but one of the S0 galaxies shows there are not even traces of star formation in at least 97% of SG1120 S0 galaxies. We proceed to investigate how these limits constrain when the most recent episode of star-formation took place, and what effect a burst of star-formation places on the constraints.
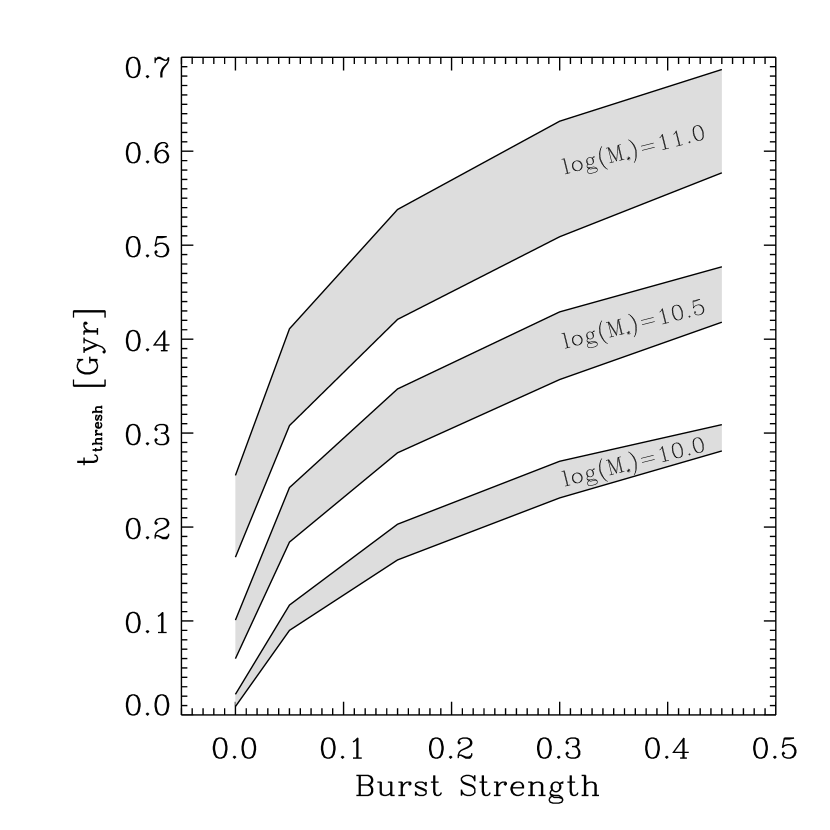
We model the S0’s using the population synthesis code PEGASE (v2.0; Fioc & Rocca-Volmerange, 1997), and first consider a scenario in which a galaxy has its star-formation halted completely. Our model galaxy forms stars at a constant rate for 9.5 Gyr, roughly the age of the Universe at , and then undergoes an instantaneous burst of star formation, after which the SFR is zero. We vary the strength of the burst, with the models forming between 0% to 45% of the final stellar mass in the burst. These burst strengths span a range from a purely truncated disk to one that matches the median bulge-to-total ratio found in S0’s, i.e. the entire bulge forms in the burst (Christlein & Zabludoff, 2004). The SFR during the pre-burst phase varies from – yr-1, typical for galaxies at similar stellar masses (see below) and redshift (see Figure 1 of Noeske et al., 2007). Within each model we set the gas fraction just prior to the burst to be between –50%; the upper limit is set by the need to convert 45% of the gas into stars for the strongest burst models. These SFR’s and gas fractions result in pre-burst metallicities ranging from . We use a Salpeter IMF (Salpeter, 1955) and an inclination-averaged extinction for a disk geometry. We perform this modeling with masses of , , and , spanning the range of stellar masses of our S0 galaxies (see Figure 1). We measure the time () after the burst at which the NUV emission falls below our detection limit for the full S0 sample, , for ; is an estimate of the minimum time since the last significant star forming event. We also investigate adding an additional burst (of varying strength) earlier in the model, but its effect on is negligible. This is not unexpected, since the NUV emission from older stars is well below our detection limit (see §3.1). We show the results of this analysis in Figure 4. As expected, increases with burst strength and stellar mass, with a range over all models from to Myr.
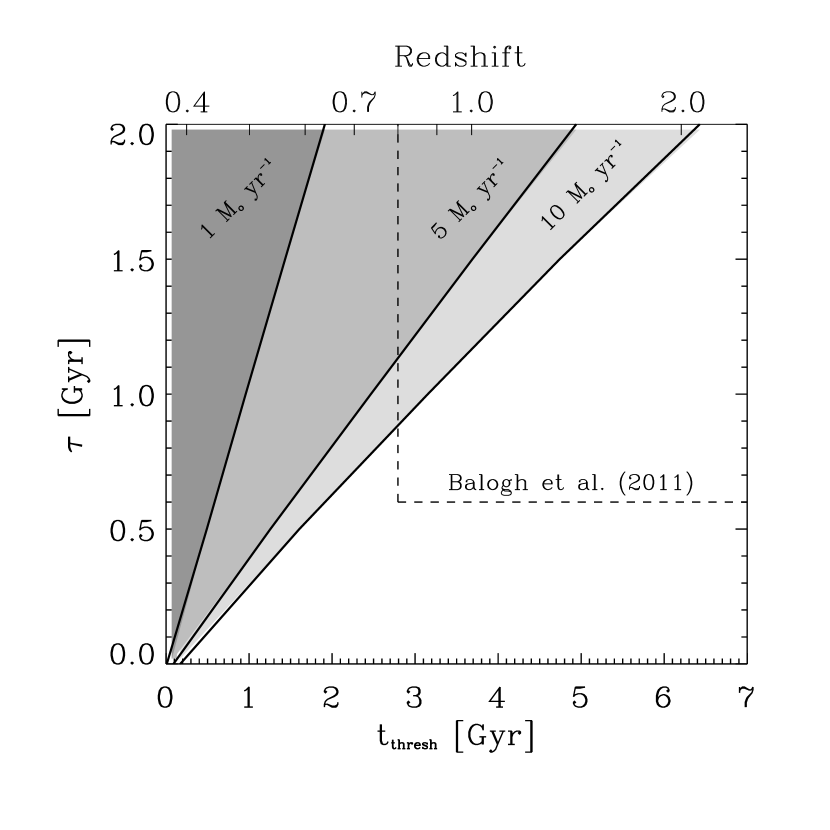
We next investigate star-forming histories with a more gradual reduction of star formation. Our model galaxy forms stars at a constant rate ranging from – yr-1 and then once it reaches has its SFR decline exponentially with e-folding times () ranging from – Gyr. We then measure the time required for the NUV emission to fall below our detection threshold, . From this analysis we are able to rule out large portions of the - parameter space (Figure 5); as the halting of star-formation becomes more gradual (i.e., increasing ), the limits we place on recent star-formation quickly exceed 1 Gyr.
4. Discussion and Conclusion
Our chief finding is a lack of NUV emission in the S0 galaxies in SG1120, down to , or yr-1. Evidently the S0’s with masses from – are not forming many new stars, but the time since their last significant star forming episode depends on their SFH. Generally, if star formation shut off rapidly, then they could have formed stars more recently. Conversely, if their star formation turned off gradually, or if they experienced a significant burst of star-formation prior to the shut-off, then more time must have passed for them to drop below our detection threshold. We investigate both possibilities.
In the rapid truncation scenario (Figure 4), our models show that the minimum time since the burst ranges from to Gyr, depending on the mass of the galaxy and the strength of the burst. While these models are consistent with the S0’s having formed at much earlier times ( Gyr), in the “no-burst” model the S0’s could have stopped forming stars as recently as – Gyr ago, depending on the mass. In other words, if the formation of an S0 involves a morphological transformation and a halting of star formation, but no additional star formation, we cannot use UV photometry to constrain meaningfully the time since that event. However, if their formation involved an episode of significant star formation, as one might expect in a merger, then they must have stopped forming stars Gyr prior to the time at which we are observing them. Given the lack of E+A spectra among our S0’s, which indicate star-formation within the past Gyr, it is likely that the S0’s formed at even earlier times. While the strength of the absorption will be weaker for galaxies with no burst of star-formation, Yang et al. (2008) find E+A galaxies with burst fractions as low as are consistent with their observations, demonstrating that low burst strengths can still yield measurable E+A spectra.
We next consider the limits we can place on a gradual reduction in SFR. Moran et al. (2007) find evidence for newly-formed S0’s in groups at the outskirts of two massive clusters at . In the process of forming, the SFR’s of these S0’s is interpreted to consist of a gradual decline over a Gyr timescale, consistent with strangulation. In Figure 5, we model the S0’s in SG1120 with similarly extended SFH’s. Our S0’s are consistent with a similar slow conversion, provided that they started this decline at earlier times. The current phase in SG1120’s evolution, as the four groups merge, is therefore unlikely to play the dominant role in S0 formation. Interestingly, a population of galaxies that lie in the so-called “green valley” have been identified in groups at – (Balogh et al., 2011), and have been interpreted as those moving from the blue cloud to the red sequence due to an exponentially declining SFR with –. These galaxies are candidate S0 progenitors given (1) their presence in groups, and (2) their intermediate colors, since (red) S0’s forming from (blue) spirals must traverse a similar path in color space. Our models in Figure 5 have stellar masses typical of these transition candidates. Models with an initial SFR of yr-1 over the full range of – are consistent both with these high redshift objects and our UV limits. Models with higher initial SFR’s begin to violate our limits for certain combinations of and . Galaxies similar to these “green valley” group galaxies could be the progenitors of the S0’s in SG1120, but this would again imply that the cluster assembly process is not associated with the S0 transformation phase.
A similar picture appears to unfold at . Hughes & Cortese (2009) find locally that “green valley” galaxies in color are predominantly HI-deficient spirals with quenched star formation found in higher-density environments. Further analysis has shown that these galaxies are consistent with migration from the blue cloud to the red sequence over at least a Gyr timescale due to ram-pressure stripping (Cortese & Hughes, 2009). A concordant result is also found over a wider range of density (Gavazzi et al., 2010). While these results at low redshift cannot be directly applied to higher , they demonstrate that a slow process of migration across the “green valley” is a viable physical mechanism for quenching star formation, which for SG1120 would require S0 formation prior to the cluster assembly phase.
Although the S0 fraction of SG1120 is already sufficiently large to match that of Coma within the uncertainties and the scatter in S0 fractions, one could envision the S0 fraction of SG1120 growing by as much as a factor of two between its current redshift and today. If so, then S0’s should be added at a rate of –10 per Gyr. For models with a gradual halting in the SFR, this implies that a significant number of S0’s should be in the process of forming. However, the likely progenitors candidates are not seen: there are non-star-forming “passive spirals”, and at most one star-forming S0. Hence, if strangulation is chiefly responsible for S0 formation, then SG1120 has finished forming S0’s. Conversely, if S0 formation is ongoing in this system, then the S0’s are forming without a gradual reduction in SFR (e.g., van den Bergh, 2009).
We find that nearly all of the S0’s in SG1120 show no trace of star-formation, and by modeling their star-formation histories with both a rapid truncation and a gradual reduction in SFR, are able to place limits on the time since their last significant star-forming episode. Our constraints are weaker in the rapid reduction scenario, particularly if S0 formation does not involve a significant burst of star formation; from our models, the S0’s could have formed stars as recently as Gyr ago and be consistent with our NUV limit. In models where a burst of star-formation occurs, forming at least of the stellar mass, our limits imply that this occurred at least Gyr ago. If a more gradual reduction in star-formation occurred, modelled as an exponentially declining SFR from a level of – yr-1, then our limits increase to several Gyr. This scenario is incompatible with SG1120 continuing to form new S0’s, as a significant number of transition galaxies would be expected that are not observed. Evidently, the formation of S0’s occurred prior to the assembly phase of the cluster.
References
- Abadi et al. (1999) Abadi, M. G., Moore, B., & Bower, R. G. 1999, MNRAS, 308, 947
- Appenzeller et al. (1998) Appenzeller, I., et al. 1998, The Messenger, 94, 1
- Balogh et al. (2011) Balogh, M. L., et al. 2011, MNRAS, 412, 2303
- Bekki et al. (2002) Bekki, K., Couch, W. J., & Shioya, Y. 2002, ApJ, 577, 651
- Bekki & Couch (2011) Bekki, K., & Couch, W. J. 2011, arXiv:1105.0531
- Bell & de Jong (2001) Bell, E. F., & de Jong, R. S. 2001, ApJ, 550, 212
- Bell et al. (2003) Bell, E. F., McIntosh, D. H., Katz, N., & Weinberg, M. D. 2003, ApJS, 149, 289
- Bertin & Arnouts (1996) Bertin, E., & Arnouts, S. 1996, A&AS, 117, 393
- Blanton & Roweis (2007) Blanton, M. R., & Roweis, S. 2007, AJ, 133, 734
- Boselli et al. (2006) Boselli, A., & Gavazzi, G. 2006, PASP, 118, 517
- Brown et al. (2003) Brown, T. M., Ferguson, H. C., Smith, E., Bowers, C. W., Kimble, R. A., Renzini, A., & Rich, R. M. 2003, ApJ, 584, L69
- Byrd & Valtonen (1990) Byrd, G., & Valtonen, M. 1990, ApJ, 350, 89
- Christlein & Zabludoff (2004) Christlein, D., & Zabludoff, A. I. 2004, ApJ, 616, 192
- Cortese & Hughes (2009) Cortese, L., & Hughes, T. M. 2009, MNRAS, 400, 1225
- Dale & Helou (2002) Dale, D. A., & Helou, G. 2002, ApJ, 576, 159
- Dale et al. (2007) Dale, D. A., et al. 2007, ApJ, 655, 863
- Desai et al. (2007) Desai, V., et al. 2007, ApJ, 660, 1151
- Dressler (1980) Dressler, A. 1980, ApJ, 236, 351
- Dressler & Gunn (1983) Dressler, A., & Gunn, J. E. 1983, ApJ, 270, 7
- Dressler et al. (1997) Dressler, A., et al. 1997, ApJ, 490, 577
- Dressler (2004) Dressler, A. 2004, Clusters of Galaxies: Probes of Cosmological Structure and Galaxy Evolution, 206
- Fasano et al. (2000) Fasano, G., Poggianti, B. M., Couch, W. J., Bettoni, D., Kjærgaard, P., & Moles, M. 2000, ApJ, 542, 673
- Fioc & Rocca-Volmerange (1997) Fioc, M., & Rocca-Volmerange, B. 1997, A&A, 326, 950
- Gavazzi et al. (2010) Gavazzi, G., Fumagalli, M., Cucciati, O., & Boselli, A. 2010, A&A, 517, A73
- Giovanelli & Haynes (1983) Giovanelli, R., & Haynes, M. P. 1983, AJ, 88, 881
- Gómez et al. (2003) Gómez, P. L., et al. 2003, ApJ, 584, 210
- Gonzalez et al. (2005) Gonzalez, A. H., Tran, K.-V. H., Conbere, M. N., & Zaritsky, D. 2005, ApJ, 624, L73
- Greggio & Renzini (1999) Greggio, L., & Renzini, A. 1999, Mem. Soc. Astron. Italiana, 70, 691
- Gunn & Gott (1972) Gunn, J. E., & Gott, J. R., III 1972, ApJ, 176, 1
- Han et al. (2007) Han, Z., Podsiadlowski, P., & Lynas-Gray, A. E. 2007, MNRAS, 380, 1098
- Hughes & Cortese (2009) Hughes, T. M., & Cortese, L. 2009, MNRAS, 396, L41
- Icke (1985) Icke, V. 1985, A&A, 144, 115
- Irwin et al. (1987) Irwin, J. A., Seaquist, E. R., Taylor, A. R., & Duric, N. 1987, ApJ, 313, L91
- Just et al. (2010) Just, D. W., Zaritsky, D., Sand, D. J., Desai, V., & Rudnick, G. 2010, ApJ, 711, 192
- Kautsch et al. (2008) Kautsch, S. J., Gonzalez, A. H., Soto, C. A., Tran, K.-V. H., Zaritsky, D., & Moustakas, J. 2008, ApJ, 688, L5
- Kenney & Koopmann (1999) Kenney, J. D. P., & Koopmann, R. A. 1999, AJ, 117, 181
- Kennicutt (1998) Kennicutt, R. C., Jr. 1998, ARA&A, 36, 189
- Larson et al. (1980) Larson, R. B., Tinsley, B. M., & Caldwell, C. N. 1980, ApJ, 237, 692
- Lavery & Henry (1988) Lavery, R. J., & Henry, J. P. 1988, ApJ, 330, 596
- Le Fèvre et al. (2003) Le Fèvre, O., et al. 2003, Proc. SPIE, 4841, 1670
- Lewis et al. (2002) Lewis, I., et al. 2002, MNRAS, 334, 673
- Martin et al. (2005) Martin, D. C., et al. 2005, ApJ, 619, L1
- Mihos (2004) Mihos, J. C. 2004, Clusters of Galaxies: Probes of Cosmological Structure and Galaxy Evolution, 277
- Moore et al. (1998) Moore, B., Lake, G., & Katz, N. 1998, ApJ, 495, 139
- Moran et al. (2007) Moran, S. M., Ellis, R. S., Treu, T., Smith, G. P., Rich, R. M., & Smail, I. 2007, ApJ, 671, 1503
- Morrissey et al. (2005) Morrissey, P., et al. 2005, ApJ, 619, L7
- Noeske et al. (2007) Noeske, K. G., et al. 2007, ApJ, 660, L43
- O’Connell (1999) O’Connell, R. W. 1999, ARA&A, 37, 603
- O’Donnell (1994) O’Donnell, J. E. 1994, ApJ, 422, 158
- Papovich et al. (2003) Papovich, C., Giavalisco, M., Dickinson, M., Conselice, C. J., & Ferguson, H. C. 2003, ApJ, 598, 827
- Patel et al. (2011) Patel, S. G., Kelson, D. D., Holden, B. P., Franx, M., & Illingworth, G. D. 2011, arXiv:1104.0934
- Poggianti et al. (2009) Poggianti, B. M., et al. 2009, ApJ, 693, 112
- Postman et al. (2005) Postman, M., et al. 2005, ApJ, 623, 721
- Quilis et al. (2000) Quilis, V., Moore, B., & Bower, R. 2000, Science, 288, 1617
- Richstone (1976) Richstone, D. O. 1976, ApJ, 204, 642
- Rieke et al. (2004) Rieke, G. H., et al. 2004, ApJS, 154, 25
- Rix & White (1990) Rix, H.-W., & White, S. D. M. 1990, ApJ, 362, 52
- Salpeter (1955) Salpeter, E. E. 1955, ApJ, 121, 161
- Schlegel et al. (1998) Schlegel, D. J., Finkbeiner, D. P., & Davis, M. 1998, ApJ, 500, 525
- Toomre & Toomre (1972) Toomre, A., & Toomre, J. 1972, ApJ, 178, 623
- Tran et al. (2005) Tran, K.-V. H., van Dokkum, P., Illingworth, G. D., Kelson, D., Gonzalez, A., & Franx, M. 2005, ApJ, 619, 134
- Tran et al. (2009) Tran, K.-V. H., Saintonge, A., Moustakas, J., Bai, L., Gonzalez, A. H., Holden, B. P., Zaritsky, D., & Kautsch, S. J. 2009, ApJ, 705, 809
- van den Bergh (1976) van den Bergh, S. 1976, ApJ, 206, 883
- van den Bergh (2009) van den Bergh, S. 2009, ApJ, 702, 1502
- van Gorkom (1996) van Gorkom, J. 1996, Cold Gas at High Redshift, 206, 145
- van Gorkom (2004) van Gorkom, J. H. 2004, Clusters of Galaxies: Probes of Cosmological Structure and Galaxy Evolution, 305
- White et al. (2005) White, S. D. M., et al. 2005, A&A, 444, 365
- Wilman et al. (2009) Wilman, D. J., Oemler, A., Mulchaey, J. S., McGee, S. L., Balogh, M. L., & Bower, R. G. 2009, ApJ, 692, 298
- Windhorst et al. (2002) Windhorst, R. A., et al. 2002, ApJS, 143, 113
- Yang et al. (2008) Yang, Y., Zabludoff, A. I., Zaritsky, D., & Mihos, J. C. 2008, ApJ, 688, 945
- Yi & Yoon (2004) Yi, S. K., & Yoon, S.-J. 2004, Ap&SS, 291, 205
- Yi et al. (2005) Yi, S. K., et al. 2005, ApJ, 619, L111
- Zabludoff et al. (1996) Zabludoff, A. T., Zaritsky, D., Lin, H., Tucker, D., Hashimoto, Y., Shectman, S. A., Oemler, A., & Kirshner, R. P. 1996, ApJ, 466, 104