The formation of fullerenes: clues from new C60, C70, and (possible) planar C24 detections in Magellanic Cloud Planetary Nebulae
Abstract
We present ten new Spitzer detections of fullerenes in Magellanic Cloud Planetary Nebulae, including the first extragalactic detections of the C70 molecule. These new fullerene detections together with the most recent laboratory data permit us to report an accurate determination of the C60 and C70 abundances in space. Also, we report evidence for the possible detection of planar C24 in some of our fullerene sources, as indicated by the detection of very unusual emission features coincident with the strongest transitions of this molecule at 6.6, 9.8, and 20 m. The infrared spectra display a complex mix of aliphatic and aromatic species such as hydrogenated amorphous carbon grains (HACs), PAH clusters, fullerenes, and small dehydrogenated carbon clusters (possible planar C24). The coexistence of such a variety of molecular species supports the idea that fullerenes are formed from the decomposition of HACs. We propose that fullerenes are formed from the destruction of HACs, possibly as a consequence of shocks driven by the fast stellar winds, which can sometimes be very strong in transition sources and young PNe. This is supported by the fact that many of our fullerene-detected PNe show altered [NeIII]/[NeII] ratios suggestive of shocks as well as P-Cygni profiles in their UV lines indicative of recently enhanced mass loss.
1 Introduction
Fullerenes had been predicted since the 70s (Osawa et al. 1970) as a possible carbon assemblage in the Universe, but have remained elusive in the astrophysical context until recently, when C60 and C70 were detected in the young Planetary Nebula (PN) Tc 1 (Cami et al. 2010) under conditions which were claimed to be in agreement with the original laboratory studies on the formation of fullerenes (Kroto et al. 1985; Kratschmer et al. 1990; de Vries et al. 1993), this is under hydrogen-poor conditions. More recently, García-Hernández et al. (2010, 2011) have challenged our understanding of the fullerene formation in space, showing that, contrary to general expectation, fullerenes (usually accompanied by polycyclic aromatic hydrocarbon (PAH) emission) are efficiently formed in H-rich circumstellar environments. The suggestion was made that both fullerenes and PAHs can be formed by the photochemical processing of hydrogenated amorphous carbon grains (HACs), which should be a major constituent in the circumstellar envelope of C-rich evolved stars. The detection of fullerenes in a larger sample of PNe is essential to answer key questions about fullerene formation in space. In this context, we must note that C60 has also been detected in the interstellar medium (Sellgren et al. 2010), and in a proto-PN (Zhang & Kwok 2011). The latter raises the exciting possibility that considerable gas-phase physical and chemical processing of dust occurs just after the Asymptotic Giant Branch (AGB) phase, during which most of the circumstellar dust is formed (e.g., Wallerstein & Knapp 1998). Fullerenes, being relatively hardy molecules (Cataldo et al. 2009), may survive indefinitely in space playing an important role in circumstellar/interstellar chemistry.
From the experimental point of view, it is important to know the temperature dependence of the wavelength (and width) and of the strength (e.g., molar absorptivity) of the C60 and C70 infrared bands. Very recent laboratory spectroscopy of C60 and C70 (Iglesias-Groth et al. 2011) has provided this detailed information. Moreover, PNe in the Magellanic Clouds (MCPNe hereafter) offer the opportunity of obtaining an accurate determination of the fullerene abundances in space. In this letter, we report ten new Spitzer detections of C60 and C70 fullerenes in MCPNe together with the first possible detection of planar C24 in space, which provide us with crucial information about fullerene formation in PNe.
2 Infrared spectra of fullerene-containing MCPNe
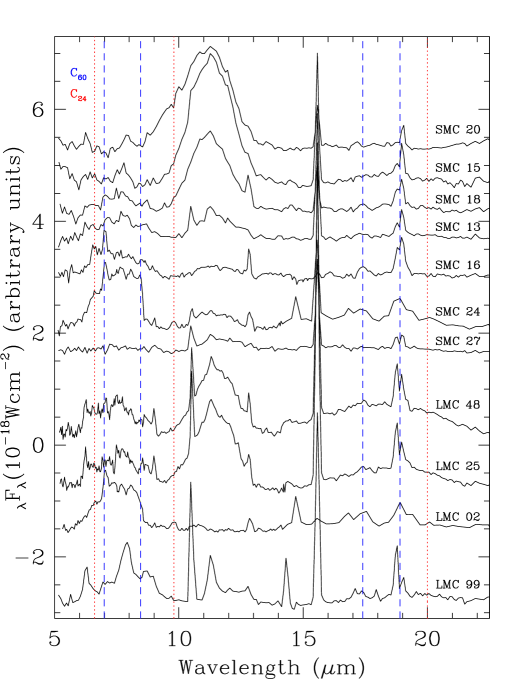
García-Hernández et al. (2010) reported that SMP-SMC 16 showed obvious C60 bands in its Spitzer/IRS spectrum, acquired by Stanghellini et al. (2007) within a sample of 41 MCPNe. Here we have re-analized in more detail the full sample of IRS spectra mentioned above and those from an additional sample of 25 MCPNe also observed with Spitzer/IRS (Bernard-Salas et al. 2009). We have obtained the corresponding residual spectra by subtracting the dust continuum emission between 5 and 38 m, which is represented by 3-7 order polynomials fitted at spectral locations free from any dust or gas feature. A careful inspection of the residual spectra reveals the fullerene signatures in 10 additional objects (6 SMC and 4 LMC PNe, see Table 1). Flux measurements (errors 3040%) were done in the residual spectra by subtracting a local baseline and fitting gaussians (García-Hernández et al., in preparation; hereafter, GH2011). We list our targets in Table 1, where we also provide the central star temperatures, the Hβ fluxes, carbon abundances, electron temperatures and densities, total hydrogen and carbon masses of the nebulae. Most of these newly detected C60-containing MCPNe also show broad dust emission features at 11.5 and 30 m, which sometimes are accompanied by other broad dust features at 6-9 and 15-20 m (see Stanghellini et al. 2007; Bernard-Salas et al. 2009). Bernard-Salas et al. (2009) found that the strength of the 11.5 m feature decreases with increasing [NeIII]/[NeII]111The ratio of the flux from [Ne III] m to that of [Ne II] m (hereafter, [Ne III]/[Ne II]). ratio (taken as an indicator of the radiation field hardness). However, SMC 16 and LMC 02 display the lowest [NeIII]/[NeII] ratios (Table 2) in our sample and the 11.5m feature is barely detected in SMC 16 and completely absent in LMC 02. A low [NeIII]/[NeII] ratio may be explained if the [NeII] 12.8m line is excited by shocks (see Sect. 3).
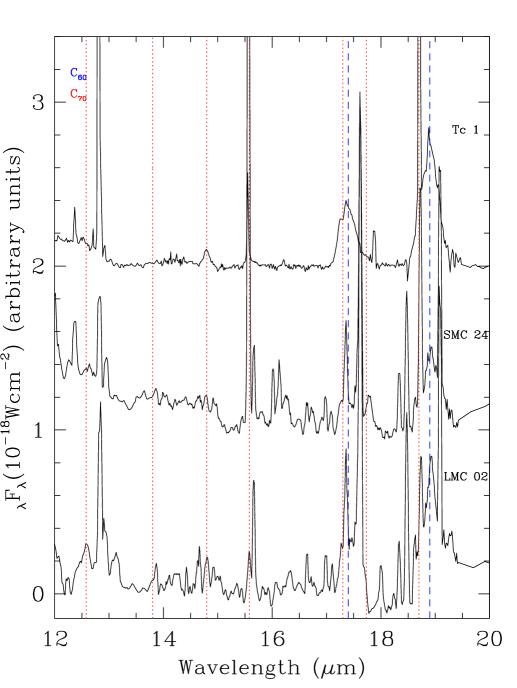
In Fig. 1 we display the residual spectra, where the expected positions of the four C60 bands are marked with dashed vertical lines. A few of the C60 sources also display relatively strong and isolated C70 features at 12.6, 13.8, 14.9, 15.6, 17.3, 17.6, and 18.7 m. In particular, C70 is clearly detected in SMC 24 and LMC 02 for which high-resolution (R600) Spitzer spectra are available (Fig. 2). We can neither confirm nor exclude the presence of C70 in other sources because of the much lower resolution of their Spitzer spectra, similarly to what we discovered for SMC 16 (García-Hernández et al. 2010). SMC 24 and LMC 02 display an infrared spectrum richer than Tc 1 (Fig.2) with several unidentified features such as those at 16.0, 16.1, 16.6, 18.0, 18.3, and 18.4 m. The identification of these features will be studied elsewhere
The Spitzer spectra of fullerene MCPNe show that a complex mixture of aliphatic and aromatic species is usually present. A broad 69 m emission, which can be attributed to HACs, large PAH clusters or very small grains (Tielens 2008), is seen with different strengths in most of our sources (Fig. 1). The 69 m feature is more intense in SMC 16, 24, and LMC 02222Bernard-Salas et al. (2009) identified the 69 m emission in SMC 24 and LMC 02 with HACs. and displays a shape different to the other sources. Narrower features at 6.3 and 7.87.9 m are also detected (e.g., SMC 20, 13, LMC 25, 48, 99). The latter features are seen in a few Galactic post-AGB stars and can be attributed to large PAHs or to hydrocarbons (as a relatively unprocessed mixture of aliphatics and aromatics; Sloan et al. 2007). Additional weak features at 6.9 and 7.3 m that have been identified with aliphatic hydrocarbons and/or HACs (Sloan et al. 2007 and references therein) are also detected in SMC 24.
Interestingly, some of our sources (SMC 13, 16, 24, LMC 48, 02) display an unidentified infrared feature (UIR) at 6.6 m. This feature is accompanied by other unidentified features at 9.8 and 20 m in SMC 24 and LMC 02 (see Fig. 1). The wavelength position of the three UIR features seen in SMC 24 and LMC 02 agree very well with the strongest transitions of planar C24 as recently reported by Kuzmin & Duley (2011) from calculated infrared spectra using first principles density functional techniques. In SMC 24, the observed flux ratios are F(6.6)/F(9.8)=3.3 and F(6.6)/F(20.0)=1.5, which compare well with the theoretical integrated intensity (km/mole) ratios of 3.8 and 2, respectively (Kuzmin & Duley 2011). However, the 6.6 m feature is not clearly distinguised from the 69m emission in LMC 02 and the observed 9.8 m feature is 3 times more intense than that at 20 m. As in the case of the C60 and C70 fullerenes (Iglesias-Groth et al. 2011), one expects the intensity, width, and position of the infrared features of planar C24 to be temperature dependent. Planar C24 is a very stable molecule (more than the C24 fullerene although Jones & Seyfert (1997) show that other C24 conformations may be more stable than planar C24). The detection of these very unusual 6.6, 9.8, and 20 m features in fullerene sources represents the first possible detection of planar C24 in space. However, this can only be confirmed through laboratory infrared spectroscopy at different temperatures, which is extremely difficult because of the high reactivity of C24.
3 CLOUDY simulations
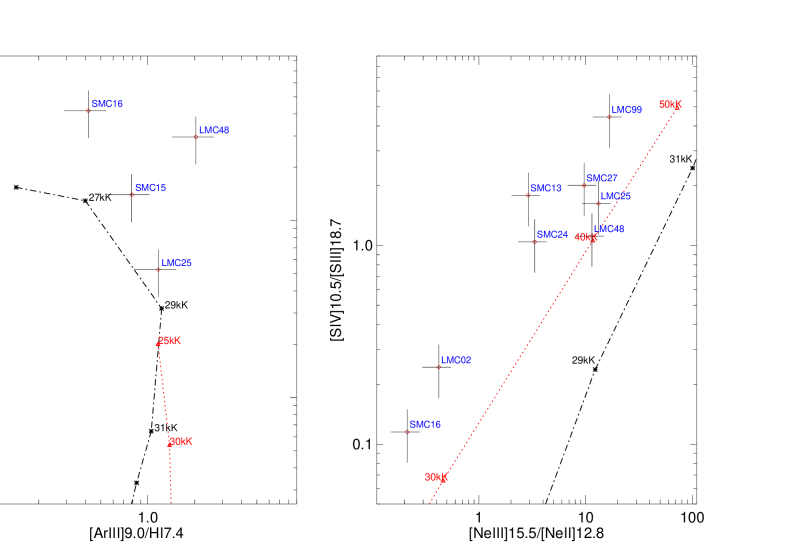
Recent laboratory spectroscopy of C60 and C70 fullerenes show that C70 displays a strong transition at 7.0 m (Iglesias-Groth et al. 2011). The 7.0m C70 transition is one of the strongest (with a strength very similar to the other 15.6 and 18.7m C70 transitions). The 7.0m C60 band is, however, less intense (a factor of 3) than that at 18.9 m. Indeed, the 7.0m line intensity observed in fullerene PNe cannot be explained by C60 alone and it has been assumed to be strongly contaminated by [ArII]6.99m (Cami et al. 2010; García-Hernández et al. 2010). We show here that the 7.0m emission seen in our sample can not be assigned to [ArII] only, rather, it should be attributed to a combination of C60 and C70, in agreement with the recent laboratory data. To this end, we have used a photoionization code to model the relative intensity of the mid-infrared lines observed in the Spitzer/IRS spectra. Calculations were performed with CLOUDY (Ferland et al. 1998). We do not intend to find the best solution for each of the observed PNe but to make general predictions using the models. As ionizing continuum we assumed blackbody and synthetic stellar spectra (Rauch 2003) with temperatures from 25,000 to 50,000 K. Typical PN values for the bolometric luminosity (104 L⊙) and for the radius of the photoionized region (0.1 pc) are adopted (Mendez et al. 1992; Villaver et al. 2002, 2007). There is no way to explain the extremely low [NeIII]/[NeII] ratios observed in some of our sources (see below), even taking into account large variations of these parameters (GH2011). We also assumed a density of 1800 cm-3 at r=0.1 pc, which varies as r-2 along the nebula and the chemical abundances by Shaw et al.(2010).
Our model predictions are compared with the observed line intensity ratios ([ArIII]/[HI] vs. [ArII/HI] and [SIV]/[SIII] vs. [NeIII]/[NeII]) in Fig. 3. The 7.0m feature cannot be explained by [ArII]6.99m emission (even taking into account maximum errors of 40% in the observed line flux ratios) and the observed 7.0m emission is much higher than expected from photoionization from the central stars (Teff31,000 K; Table 1). Assuming that the 7.0m emission is due to the Ar lines, the Ar abundances for these PNe would be unrealistically high. Another important conclusion can be extracted from the plot [SIV]/[SIII] vs. [NeIII]/[NeII] (Fig.3). The low [NeIII]/[NeII] ratios333Note that the [SIV]/[SIII] ratio in LMC 02 is much lower than expected for its Teff because the observed 18.7m emission is dominated by C70. observed in many of our PNe cannot be explained by photoionization. This discrepancy can be explained if the [NeII] 12.8m line is shock-excited by the fast stellar winds from the central stars (e.g., Hartigan et al. 1987; Molinari & Noriega-Crespo 2002; van Boekel et al. 2009). A [NeII] shock-excited origin is also suggested from the common detection of P-Cygni profiles in the UV lines of our PNe (see Sect.5); a clear indication of recently enhanced mass loss and thus, of possible shocks.
4 Excitation mechanism and abundances
Previous works suggest that the fullerene emission in PNe does not originate from free gas-phase fullerene molecules, but from molecular carriers attached to solid material (Cami et al. 2010; García-Hernández et al. 2010). However, the fullerene emission seen in sources with cooler stars (Teff25,000 K) such as reflection nebulae (Sellgren et al. 2010), RCB stars (García-Hernández et al. 2011), and proto-PNe (Zhang & Kwok 2011) may be explained by UV-excited C60 molecules in the gas phase. Sellgren et al.’s (2010) calculations indicate that the intensities of the C60 7.0 and 8.5 m bands versus the 18.9 m band are very sensitive to the energy of the absorbed UV photons; with the C60 F(17.4)/F(18.9) ratio being not sensitive to the absorbed photon energy. Assuming a solid-state origin for the observed C60 bands instead, we have determined the fluxes that are actually due to the 7.0 and 8.5 m C60 transitions444The observed 8.5m fluxes cannot be completely explained by C60 in four PNe (SMC 13, 24, LMC 02, 99). from the corresponding excitation diagrams (see below). The C60 F(7.0)/F(18.9) and F(8.5)/F(18.9) ratios are listed in Table 2 for a proper comparison with Sellgren et al.’s (2010) predictions. Interestingly, the C60 F(7.0)/F(18.9) and F(8.5)/F(18.9) ratios indicate typical photon energies of 5 eV for all sources in our sample independently of the effective temperature (31,000 K, when available) of the central star (see Sect.5).
We determine the fullerene temperatures for each PN from the flux measurements of the C60 and C70 transitions and adopting the temperature dependence of the absorptivity for each C60 and C70 transition (Iglesias-Groth et al. 2011). We developed an iterative process to find the best correlation coefficient of the linear relation in the Boltzmann excitation diagram, from which the temperature and the total number of emitting fullerene molecules can be estimated (GH2011). The initial temperatures were assumed in the range 1001000 K and a few iterations were required for a quick convergence. The four mid-IR transitions of C60 were considered, allowing the fraction of the flux of the 7m C60 transition as a free parameter. In the case of C70, we considered the 3 or 4 transitions less contaminated by other species, obtaining also the fraction of the 7m C70 flux. We found very good correlation coefficients (0.890.99) for the C60 and C70 fullerenes. The temperatures and the C60 and C70 contributions to the observed 7m flux are listed in Table 2. The derived fullerene excitation temperatures are in the range 200600 K and the emission may come from solid-state fullerenes (e.g., molecules attached to dust grains). Our excitation temperatures indicate that C70 is cooler than C60.
The fullerene-sources in the MCs provide a reliable estimate of the C60 and C70 abundances in PNe because the distances to the SMC (61 kpc; Hilditch 2005) and LMC (48.5 kpc; Freedman & Madore 2010) are accurately known, and because reliable C atomic abundances from UV spectra are available for many of these sources in the literature (Table 1). By using the above distances and following García-Hernández et al. (2010)555The H masses are estimated from the available electronic temperatures and densities and the observed Hβ fluxes (Table 1)., the C60/C and C70/C abundances were estimated. We find C60/C0.0030.29 (average of 0.07) and C70/C0.0010.07 (average of 0.03). Our average C60/C0.07 is consistent with the C60 abundance recently derived in a proto-PN (Zhang & Kwok 2011). By assuming a distance of 2 kpc for Tc 1 (as Cami et al. 2010), we estimate C60/C=0.04 and C70/C=0.005.
5 Formation of fullerenes
Laboratory studies show that the C70/C60 ratio can tell us whether the formation of fullerenes is “bottom-up” or “top-down”, meaning growth from smaller to larger, or decay from larger to smaller units, respectively (e.g., Mansurov 2011). In combustion, one can get a high ratio (0.268.8), while in carbon vapor condensation the ratio is usually low (0.020.18) (e.g., Mansurov 2011). In addition, vapor carbon condensation experiments under H-poor conditions indicate that C60 fullerenes are more than 50% of total large carbon clusters (Kroto et al. 1985). The low C70/C60 of 0.020.2 (Table 2) seems to indicate that fullerenes are formed from vapor carbon condensation. However, the fact that all known fullerene-containing PNe are H-rich and that C60 only represents a very small percentage of the total carbon in these stars is against the idea that fullerenes are formed under H-poor conditions. García-Hernández et al. (2010, 2011) have suggested that fullerenes can be formed from the decomposition of HACs in order to explain the simultaneous detection of C60 and PAHs in H-rich circumstellar envelopes. Unfortunately, the C70/C60 ratio cannot be measured in the laboratory when fullerenes are produced from laser vaporization of HACs films. This is because it is common to see variations in the relative intensities of the C60 and C70 mass peaks even in mass spectra recorded on the same sample and under the same experimental conditions (W. Duley 2011, private communication).
Laboratory experiments show that the decomposition of HACs is sequential with small dehydrogenated PAH molecules released first, and then fullerenes and large PAH clusters (Scott et al. 1997). We have shown here that fullerene MCPNe show a complex mixture of aliphatic and aromatic species such as HACs, PAH clusters, fullerenes, and small dehydrogenated carbon clusters (possible planar C24). The coexistence of this large variety of molecular species in PNe with fullerenes is strongly supported by the laboratory results obtained by Scott and colleagues, indicating that fullerenes (and PAHs) are formed from the vaporization of HACs.
However, the excitation mechanism of the fullerene emission is still not clear. Neutral fullerenes in MCPNe seem to be not excited by the bulk of UV photons coming from the central star (Teff31,000 K, when available); the photon energies involved to explain the observed C60 intensity ratios (Table 2) should be 5 eV according to Sellgren et al. (2010). Our results are not consistent with Sellgren et al. (2010) who concluded that the fullerene emission observed in the reflection nebula NGC 7023 is due to gas-phase C60 molecules excited by UV photons of 10 eV, in agreement with the bulk of UV photons coming from the exciting star with Teff=21,000 K. An alternative explanation may be that fullerenes are collisionally excited during the HACs vaporization process (i.e., grain-grain collisions) and emit even when they are still attached to the HACs surface. Other possibilities are the dehydrogenation of the molecules present in the HACs surface, before they are released to the gas phase or even shock-excited gas-phase fullerenes666Possibly this is also the case for the planar C24 emission observed..Presumably shocks are not energetic enough to ionize the fullerenes, but this is an open question and the shock-excited hypothesis needs further more detailed modeling work. The lack of mid-IR C60+ features in fullerene-containing sources, may imply that fullerenes are either quickly destroyed in the gas phase or never leave the grains as free molecules. This ambiguity arises because fullerenes may be created in the vaporization process, rather than being pre-existing molecules in the original HACs sample. Indeed, the laboratory experiments use a laser at 4 eV to simulate HACs vaporization by interstellar shocks. Our Fig. 3. show that the observed [NeIII]/[NeII] ratios in many of the circumstellar shells of fullerene-containing PNe cannot be explained by photoionization and they may be strongly altered by shocks. Five fullerene-containing sources (SMC 15, 16, 20, LMC 25, 48) display P-cygni profiles in their UV lines, which are indicative of on-going mass loss with high-velocity (1000 kms-1) strong winds, as confirmed by HST UV spectroscopy (Stanghellini et al. 2005, 2009). Furthermore, given the low S/N in the HST ACS spectra, the presence of P-cygni profiles in SMC 24 and SMC 18 is hinted although could not be confirmed. LMC 99 and LMC 02 lack the necessary diagnostics to determine the presence of P-Cygni profiles in the UV. SMC 13, which does not show any P-Cygni profiles, displays the lowest C60/C abundance, suggesting that fullerene formation is less efficient. On the other hand, fullerene production seems to be more efficient in SMC 16 and LMC 02777SMC 24 with intense 69m emission also displays a [NeIII]/[NeII] ratio lower than expected for its Teff of 37,800 K with the stronger outflows (as indicated by their extremely low [NeIII]/[NeII] ratios) and this is the subset of sources which display as well the more intense 69 m emission that may be attributed to HACs or PAH clusters.
In summary, we propose that shocks (i.e., grain-grain collisions) driven by the strong stellar winds are triggering the HACs processing and that fullerenes (as well as other complex aromatic and aliphatic species like possibly planar C24 molecules that may have been detected for the first time) evolved from the vaporization of HACs. Our interpretation can be observationally tested through high-resolution (R30,000) observations around [Ne II]12.8m, which will confirm/refute the possible [Ne II] shock-excited origin in fullerene-containing PNe.
References
- Bernard-Salas et al. (2009) Bernard-Salas, J. et al. 2009, ApJ, 699, 1541
- De Vries et al. (1993) De Vries, M. S. et al. 1993, Geochim. Cosmochim. Acta 57, 933
- Cahn, Kaler & Stanghellini (1992) Cahn, J. H., Kaler, J. B., & Stanghellini, L. 1992, A&AS, 94, 399
- Cami et al. (2010) Cami, J. et al. 2010, Science, 329, 1180
- Cataldo et al. (2009) Cataldo, F., Strazzulla, G., & Iglesias-Groth, S. 2009, MNRAS, 394, 615
- Dopita et al. (1988) Dopita, M. A. et al. 1988, ApJ, 327, 639
- Ferland et al. (1998) Ferland, G. J. et al. 1998, PASP, 110, 761
- Freedman & Madore (2010) Freedman, W. L., & Madore, B. F. 2010, ARA&A, 48, 673
- García-Hernández et al. (2010) García-Hernández, D. A. et al. 2010, ApJ, 724, L39
- García-Hernández et al. (2011) García-Hernández, D. A., Rao, N. K., & Lambert, D. L. 2011, ApJ, 729, 126
- Hartigan et al. (1987) Hartigan, P. et al. 1987, ApJ, 316, 323
- Herald & Bianchi (2004) Herald, J. E., & Bianchi, L. 2004, ApJ, 611, 294
- Hilditch (2005) Hilditch, R. W. 2005, MNRAS, 357, 304
- Iglesias-Groth et al. (2011) Iglesias-Groth, S., Cataldo, F., & Manchado, A. 2011, MNRAS, 413, 213
- Jones & Seyfert (1997) Jones, R. O., & Seifert, G. 1997, Phys.Rev.Lett. 79, 443
- Kuzmin & Duley (2011) Kuzmin, S., & Duley, W. W. 2011 (in press; astro-ph/1103.2989)
- Kratschmer et al. (1990) Kratschmer, W. et al. 1990, Nature, 347, 354
- Kroto et al. (1985) Kroto, H. W. et al. 1985, Nature, 318, 162
- Leisy & Dennefeld (1996) Leisy, P. & Dennefeld, M. 1996, A&AS, 116, 95
- Leisy & Dennefeld (2006) Leisy, P. & Dennefeld, M. 2006, A&A, 456, 451
- Mansurov (2011) Mansurov, Z. A., 2011, J.E.P.&T., 84, 1
- Mendez et al. (1992) Mendez, R. et al. 1992, A&A, 260, 329
- Milanova & Kholtygin (2009) Milanova, Yu. V. & Kholtygin, A. F. 2009, Astron. Let. 35, 518
- Molinari & Noriega-Crespo (2002) Molinari, S., & Noriega-Crespo, A. 2002, AJ, 123, 2010
- Osawa (1970) Osawa, E. 1970, Kagaku 25, 854
- Preite-Martínez et al. (1989) Preite-Martínez, A. et al. 1989, A&AS, 81, 309
- Rauch (2003) Rauch, T. 2003, A&A, 403, 709
- Scott et al. (1997) Scott et al. 1997, ApJ, 489, L193
- Sellgren et al. (2010) Sellgren, K. et al. 2010, ApJ, 722, L54
- Shaw et al. (2006) Shaw, R. A. et al. 2006, ApJS, 167, 201
- Shaw et al. (2010) Shaw, R. A. et al. 2010, ApJS, 717, 562
- Sloan et al. (2007) Sloan, G. C. et al. 2007, ApJ, 664, 1144
- Stanghellini et al. (2002) Stanghellini, L. et al. 2002, ApJ, 575, 178
- Stanghellini et al. (2003) Stanghellini, L. et al. 2003, ApJ, 596, 997
- Stanghellini et al. (2005) Stanghellini, L. et al. 2005, ApJ, 622, 294
- Stanghellini et al. (2007) Stanghellini, L. et al. 2007, ApJ, 671, 1669
- Stanghellini et al. (2009) Stanghellini, L. et al. 2009, ApJ, 702, 733
- Tielens (2008) Tielens, A. G. G. M. 2008, ARA&A, 46, 289
- van Boekel et al. (2009) van Boekel, R. et al. 2009, A&A, 497, 137
- Villaver et al. (2002) Villaver, E. et al. 2002, ApJ, 561, 1204
- Villaver et al. (2003) Villaver, E. et al. 2003, ApJ, 597, 298
- Villaver et al. (2004) Villaver, E. et al. 2004, ApJ, 614, 716
- Villaver et al. (2007) Villaver, E. et al. 2007, ApJ, 656, 831
- Wallerstein & Knapp (1998) Wallerstein, G., & Knapp, G. R. 1998, ARA&A, 36, 369
- Williams et al. (2008) Williams, R. et al. (2008), ApJ, 677, 1100
- Zhang & Kwok (2011) Zhang, Y. & Kwok, S. 2011, ApJ, 730, 126
| Object | Teff | log(F(H)) | A(C) | Te | Ne | Ref.a | MH | MC |
|---|---|---|---|---|---|---|---|---|
| (K) | log(C/H)+12 | (104 K) | (cm-3) | (M⊙) | (10-3 M⊙) | |||
| SMC 13 | 31,300 | -12.59 | 8.73 | 1.28 | 2900 | (1,2,3,4,4) | 0.702 | 4.520 |
| SMC 15 | -12.45 | 8.26 | 1.41 | 7500 | (,5,3,6,7) | 0.270 | 0.588 | |
| SMC 16 | -12.74 | 8.19 | 1.18 | 4400 | (,5,3,6,7) | 0.210 | 0.392 | |
| SMC 18 | -12.66 | 8.31 | 1.18 | 3600 | (,2,3,4,4) | 0.381 | 0.934 | |
| SMC 20 | -12.47 | 8.25 | 1.38 | 3900 | (,2,3,4,4) | 0.497 | 1.061 | |
| SMC 24c | 37,800 | -12.66 | 8.18 | 1.16 | 2800 | (1,2,3,4,4) | 0.411 | 0.747 |
| SMC 27 | 43,300 | -12.51 | 1.27 | 3650 | (1,2,,4,4) | 0.471 | ||
| LMC 02c | 39,000 | -13.18 | 8.14 | 1.21 | 5000 | (8,7,9,6,8) | 0.048 | 0.079 |
| LMC 25 | 33,700 | -12.39 | 8.29 | 1.56 | 3300 | (10,11,12,13,13) | 0.626 | 1.465 |
| LMC 48 | -12.48 | 8.40 | 1.00b | 1900 | (,5,12,,6) | 0.844 | 2.540 | |
| LMC 99 | -12.54 | 8.77 | 1.22 | 3600 | (,14,15,6,6) | 0.434 | 3.040 | |
| Tc 1d | 34,100 | -10.73 | 8.59 | 0.90 | 3000 | (16,17,18,18,18) | 0.0535 | 0.250 |
References. — (1) Villaver et al. (2004); (2) Stanghellini et al. (2003); (3) Stanghellini et al. (2009); (4) Shaw et al. (2010); (5) Shaw et al. (2006); (6) Leisy & Dennefeld (2006); (7) Dopita et al. (1988); (8) Herald & Bianchi (2004); (9) Milanova & Kholtygin (2009); (10) Villaver et al. 2003; (11). Stanghellini et al. (2002); (12) Stanghellini et al. (2005); (13) Shaw et al. (2011, in prep.); (14) R. Shaw (2011, priv. comm.); (15) Leisy & Dennefeld (1996); (16) Preite-Martínez et al.(1989; (17) Cahn et al. (1992); (18) Williams et al. (2008).
| Object | F(7.0)/F(18.9)a | F(8.5)/F(18.9)a | F(17.4)/F(18.9)a | [NeIII]/[NeII] | C60/C | fC60b | TC60 | C70/C | fC70b | TC70 | C70/C60 |
|---|---|---|---|---|---|---|---|---|---|---|---|
| (%) | (%) | (K) | (%) | (%) | (K) | ||||||
| SMC 13 | 0.16 | 0.32 | 0.21 | 2.89 | 0.003 | 1510 | 45350 | ||||
| SMC 15 | 0.20 | 0.30 | 0.30 | 0.49 | 0.07 | 1510 | 29020 | ||||
| SMC 16 | 0.24 | 0.33 | 0.45 | 0.21 | 0.12 | 3010 | 41450 | ||||
| SMC 18 | 0.16 | 0.52 | 0.44 | 1.16 | 0.03 | 1510 | 36535 | ||||
| SMC 20 | 0.05 | 0.13 | 0.41 | 0.03 | 1010 | 22830 | |||||
| SMC 24 | 0.47 | 0.18 | 0.53 | 3.33 | 0.07 | 6020 | 51430 | 0.001 | 2010 | 38360 | 0.02 |
| SMC 27 | 0.58 | 0.48 | 0.50 | 9.69 | 5010 | 55340 | |||||
| LMC 02 | 0.48 | 0.37 | 0.71 | 0.42 | 0.29 | 3010 | 50220 | 0.07 | 1010 | 32410 | 0.21 |
| LMC 25 | 0.08 | 0.26 | 0.69 | 13.19 | 0.02 | 5020 | 30025 | ||||
| LMC 48 | 0.07 | 0.22 | 1.13 | 11.46 | 0.01 | 2010 | 27020 | ||||
| LMC 99 | 0.30 | 0.56 | 0.72 | 16.82 | 0.02 | 5010 | 44625 | ||||
| Tc 1 | 0.26 | 0.36 | 0.53 | 0.05 | 0.04 | 2510 | 41530 | 0.005 | 4010 | 31430 | 0.10 |