First observations of CN(2-1), HCO+(3-2) and C2H(3-2) emission lines in the Perseus cluster: constraints on heating mechanisms in the cluster gas.
Abstract
We present the first observations of emission lines of CN(2-1), HCO+(3-2) and C2H(3-2) in the Perseus cluster. We observed at two positions: directly at the central galaxy, NGC 1275 and also at a position about 20′′ to the east where associated filamentary structure has been shown to have strong CO emission. Clear detections in CN and HCO+ transitions and a weak detection of the C2H transition were made towards NGC 1275, while weak detections of CN and HCO+ were made towards the eastern filamentary structure. Crude estimates of the column densities and fractional abundances (mostly upper limits) as functions of an unknown rotational temperature were made to both sources. These observational data were compared with the outputs of thermal/chemical models previously published by Bayet et al. (2011) in an attempt to constrain the heating mechanisms in cluster gas. We find that models in which heating is dominated by cosmic rays can account for the molecular observations. This conclusion is consistent with that of Ferland et al. (2009) in their study of gas traced by optical and infrared radiation. The cosmic ray heating rate in the regions probed by molecular emissions is required to be at least two orders of magnitude larger than that in the Milky Way.
keywords:
Astrochemistry - ISM:abundances - galaxies: intergalactic medium - Galaxies: clusters: individual:Perseus - galaxies: individual: NGC 1275 - Galaxies: cooling flows1 Introduction
The Perseus Cluster is one of the nearest galaxy clusters and is the brightest X-ray cluster in the sky. The cluster and its central galaxy NGC 1275 have been the focus of intense study for many years, at X-ray, optical, IR and millimetre wavelengths. The first molecular detections were of CO rotational emission towards the centre of NGC 1275 (Lazareff et al., 1989; Mirabel, Sanders & Kazes, 1989; Reuter et al., 1993; Braine et al., 1995; Inoue et al., 1996; Bridges & Irwin, 1998; Lim, Ao & Dinh-V-Trung, 2008). Observations have now demonstrated that CO emission also extends to some tens of kpc from the central galaxy (Salomé et al., 2006, 2008a, 2008b, 2011) and is strongly correlated with the filamentary structure observed in H (Hu et al., 1983; Cowie et al., 1983; Conselice, Gallagher & Wyse, 2001) within the hot gas detected in X-rays at 0.5 keV (Fabian et al., 2008). The H structure is also correlated with warm H2 emission (Edge et al., 2002; Wilman et al., 2002). Some of the molecular gas towards the cluster must be at high density ( cm-3). Salomé et al. (2008a) have made the first detection of the high density tracer HCN(3-2) emission towards the centre of NGC 1275.
The nature of the filamentary structure is the subject of current discussion. Salomé et al. (2011) note two possibilities: either that the CO filaments form far from the galaxy’s centre from uplifted warm gas, eventually falling back (Revaz, Combes & Salomé, 2008), or that the molecular gas is entrained and dragged out of the galaxy by rising hot gas. Evidently, further observations of molecular gas may help to determine its origin. In this paper, we present observations of emission lines of CN(2-1), HCO+(3-2) and C2H(3-2) towards the central galaxy and also towards a position 20′′ to the east where there is strong CO emission in the associated filamentary structure.
These three species were identified in a theoretical study (Bayet et al., 2011) as tracers of regions influenced by the dissipation of turbulence and waves, heating the gas and accelerating cosmic rays (see also Crawford & Fabian 1992; Pope, Hartquist & Pittard 2008). Ferland et al. (2009) developed models of the optical and infrared emission filamentary regions in order to infer the rate at which mechanical energy is dissipated, and to determine the cosmic ray background produced by the interaction. Ferland et al. (2009) concluded that the heating rate per hydrogen nucleus due to dissipation or cosmic ray induced ionisation must be 300 times higher in the optical emission filaments than in the local interstellar medium.
In their work, (Bayet et al., 2011) identified the species CN, C2H and HCO+ as sensitive to changes in cosmic ray ionisation rate or to an additional source of heating such as dissipation. Meijerink et al. (2011) came to a similar conclusion. Here, we present the observational follow-up to that theoretical study; we aim to determine whether dissipation or cosmic ray induced ionisation dominates the heating.
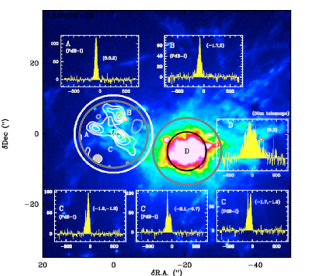
The paper is organised as follows: in Section 2 we present the first observations of CN(2-1), C2H(3-2) and HCO+(3-2) emissions in both NGC 1275 and a position 20′′ to the east where emission in the CO filamentary structure is known to be strong (see Figure 1). In Section 3 we analyse the data and provide rough estimates of column densities and fractional abundances of the three molecules in NGC 1275 and in the filamentary region. Section 4 compares the results of the observations with the models of Bayet et al. (2011) to try to identify whether cosmic ray heating or dissipation is the dominant heating mechanism, or whether a combination of both is required. Section 5 discusses the results and gives our conclusions.
2 Observations
The observations were performed using the James Clerk Maxwell Telescope (JCMT) for the detection of the CN(2-1) line ( 226.874 GHz), C2H(3-2) transition ( 262.004 GHz) and HCO+(3-2) line ( 267.557 GHz). In this first attempt of detection, we did not seek to resolve the fine structure line emission of the CN nor of the C2H but rather observe the emission coming from the whole (2-1) and (3-2) group, respectively. Every two or three hours the pointing, focus and calibration were performed carefully on planets (Mars and Jupiter) and on evolved stars. The pointing error was estimated to be 3′′.
The JCMT observations were made between August and December 2010 under medium weather conditions ( 0.08-0.15). We employed a beam switch mode with a throw of 95′′ and used the RxA3 receiver on JCMT for detecting these three molecular emissions, coupled with the ACSIS digital autocorrelation spectrometer with a bandwidth of 1000MHz because the lines were expected to be broad (see Figures 1 and 3). The HPBW and the main beam efficiencies of the JCMT at 250 GHz are 20′′ and 0.69111See JCMT website: http://www.jach.hawaii.edu/JCMT/ instruments/, respectively (see the projected JCMT beam on Figure 1 as compared to the one corresponding to the published data from IRAM-30m and IRAM-Plateau de Bure Interferometer). The system temperatures ranged between 200 K and 450 K, depending on the source (either NGC 1275 or the filament) and on the wavelength. The data pre-reduction was done using Starlink software (KAPPA, SMURF and STLCONVERT packages) and subsequently translated to CLASS format for final reduction. The reduced spectra for NGC 1275 and the filamentary region are seen respectively in Figures 2 and 3 and their resulting Gaussian fitting parameters are displayed in Table 1.
The C2H(3-2) line in NGC 1275 and the three lines observed in the filamentary region show a signal-to-noise ratio below the usual extragalactic cutoff of 3. For clear detections in the filamentary region, one would require more on-source integration time. These observations are thus to be considered all as upper limits, even though in the case of the C2H(3-2) line in NGC 1275 and of the HCO+(3-2) and CN(2-1) transitions in the filament, Gaussian line profiles could be fitted to the observations (see Figures 2 and 3). Where fits could be obtained, the fitting parameters are shown in Table 1. However, note that for the lines of low signal-to-noise the values should be regarded, with caution, as indicative; these values are shown in italic in Table 1.
| NGC 1275 | Filament | |
| RA(J2000) (h:m:s) | 03:19:48.20 | 03:19:50.00 |
| DEC(J2000) (∘ : ’ : ”) | 41:30:42.0 | 41:30:47.0 |
| Position in Figure 1 | D | A, B & C |
| HCO+(3-2), 267.557 GHz | ||
| Tsys (K) | 253 | 315 |
| Integration timea (mins) | 20 | 18 |
| (Tmb dv) (K km s-1) | 18.30.4 | 4.20.4 |
| Vpeak (km s-1) | 5178.75.0 | 5185.711.1 |
| FWHM (km s-1) | 437.510.0 | 372.134.2 |
| Tpeak (mK) | 39.4 | 10.5 |
| rms (mk) | 7.9 | 8.6 |
| CN(2-1), 226.874 GHz | ||
| Tsys (K) | 197 | 252 |
| Integration timea (mins) | 27 | 20 |
| (Tmb dv) (K km s-1) | 5.90.2 | 0.70.2 |
| Vpeak (km s-1) | 5197.34.3 | 5248.933.5 |
| FWHM (km s-1) | 275.99.5 | 214.291.0 |
| Tpeak (mK) | 20.2 | 3.0 |
| rms (mk) | 4.8 | 2.8 |
| C2H(3-2), 262.004 GHz | ||
| Tsys (K) | 306 | 442 |
| Integration timea (mins) | 18 | 18 |
| (Tmb dv) (K km s-1) | 3.10.2 | - |
| Vpeak (km s-1) | 5126.87.4 | - |
| FWHM (km s-1) | 180.817.3 | - |
| Tpeak (mK) | 16.3 | 23.4 |
| rms (mk) | 8.3 | 7.8 |
a The integration time listed here is the ON-SOURCE time only.
To correct the integrated line intensities for beam dilution effects, we have assumed optically thin emission (antennae temperature proportional to the column density in the upper level of the observed transition) and source sizes of 20′′ and 11′′ for NGC 1275 and the filament regions, respectively. These source sizes have been derived from the CO single-dish and interferometric maps from Salomé et al. (2006, 2008a, 2008b) (see also Figure 1). We have applied this correction before estimating the column densities and fractional abundances (but note that the data in Table 1 do not include any correction for beam dilution).
We note that the HCO+(3-2) line in NGC 1275 is significantly broader than other lines presented here, and is broader than the CO(1-0) and CO(2-1) line widths (of about 380 km s-1) reported in Bridges & Irwin (1998); Salomé et al. (2006, 2008a). The cause of this broadening is unclear. The range of frequencies covered by the spectrum seen in Figure 2 (i.e. 267.093-268.036 GHz), includes only one group of lines potentially strong enough to blend with the HCO+(3-2) emission and cause this broadening: this is the methanol emission located around 267.5 GHz. However, since methanol (in any frequency range) has not been detected in NGC 1275, nor has it been found in any central galaxy of a cluster, this possible explanation remains hypothetical.
Using previously published Perseus cluster molecular line data, we have listed in Table 2 some line ratios corrected for beam dilution effects. We have included additional molecular lines known to be reliable tracers of relatively high density gas from Bridges & Irwin (1998); Salomé et al. (2008a). For the filamentary region, we have used the CO(3-2) integrated line intensity from Bridges & Irwin (1998) at the position closest to ours ((+7′′;+7′′) as compared to (+20′′;+5′′)), without finding a better match.
We briefly compare our results for the Perseus Cluster with the results of other molecular line studies of galaxies. Gao & Solomon (2004) give integrated line intensities (K km s-1) for CO in nearby galaxies ranging from a few to a few hundred, while for HCN the values range from a few tenths to a few tens (see also Aalto et al. 2002). Our results (in the same units) for CN(2-1), C2H(3-2) and HCO+(3-2) are 5.9, 3.1 and 18.3. So, in NGC 1275 these three molecular species are typically as bright as HCN in many other galaxies, though not as bright as CO.
| NGC 1275 | Filament | |
|---|---|---|
| HCO+(3-2)/CO(3-2) | 2.12 | 0.53 |
| HCO+(3-2)/HCN(3-2) | 13.46 | - |
| CN(2-1)/CO(3-2) | 0.68 | 0.09 |
| CN(2-1)/HCN(3-2) | 4.31 | - |
| C2H(3-2)/CO(3-2) | 0.36 | - |
| C2H(3-2)/HCN(3-2) | 2.28 | - |
3 Column density and fractional abundance estimates
To convert the integrated line intensities into column densities and fractional abundances, the hypothesis of a Local Thermodynamical Equilibrium (LTE) has been assumed such as, for a species , we have:
| (1) |
where is defined by:
| (2) |
where corresponds to the integrated line intensities listed in Table 1, corrected from beam dilution effect, where is the partition function at the rotational temperature , where is the energy of the upper level of the studied transition, where is the Planck constant, and where is can be found, similarly to values, in the Cologne Database for Molecular Spectroscopy (CDMS222See the website: http://www.astro.uni-koeln.de/cgi-bin/cdmssearch.).
Any more sophisticated treatment at this stage of the observations has been considered as meaningless since only one transition per molecule has been obtained per source. Since the current dataset of observations does not allow us to estimate the rotational temperature i. e. rotational diagrams could not be constructed, we present in Table 3 values of the total column densities for CN, C2H and HCO+ as functions of . The values listed have been chosen to be consistent with the range of kinetic temperatures computed self-consistently in the various models explored by Bayet et al. (2011).
To estimate the fractional abundance of a molecule from its estimated total column density, we have assumed the canonical gas:dust ratio for the Milky Way. This value may not be appropriate for the Perseus Cluster. We have selected to be equal to either 3 mag or 8 mag. This allows the direct comparison with results presented in Bayet et al. (2011). Though we cannot be certain that the material is at either of these visual extinctions. However, we have selected them as the lower value is representative of translucent regions and the higher corresponds to a dark region that does not have such a high column density that its lifetime would necessarily be significantly limited by gravitational collapse. We recognize that the whole procedure that we have used is necessarily very crude, but it does allow rough estimates of fractional abundances to be made, to compare with models (see Section 4). The derived column densities and fractional abundances, for both NGC 1275 and the filamentary region, are presented in Tables 3 and 4, respectively.


4 Comparison with model predictions: constraints on the origin of the heating mechanisms in the Perseus cluster
We have extracted from Bayet et al. (2011), the values of the fractional abundances of CN, C2H and HCO+ from five models that may be appropriate for reproducing the observations presented here in both NGC 1275 and in the filament region. We present these values in Table 5. They offer five distinct combinations of cosmic ray ionisation rate (hereafter in s-1), of additional source of heating, , (in erg cm-3 s-1) accounting for the effect of dissipation, and of FUV radiation field, , (expressed in units of Habing - see Habing 1968).
More precisely, Model A has high values of both and with a low value of . Model B has low values of , and . Model C has low values of and with a high value of . Model D has a high value of and low values of and . Model E has a low value of , a high value of and a low value of (See Table 5). Each model explored thermal and chemical properties at two values of , i.e. 3 and 8 mag. These values are intended to represent conditions near the edge and in the dark interior of a molecular region.
By comparing directly the observed fractional abundances values presented in Table 4 with those modelled listed in Table 5, for the same temperature range (i.e. here, we compare only observed and modelled fractional abundances at ), we may be able to identify which heating process may be present and consistent with the observed emissions of both NGC 1275 and the filamentary region. A summary of our conclusions is presented in Table 6. As one can see, there are actually a relatively limited number of models which can reproduce the observations well. Here we arbitrarily considered that a model reproduces well an observation when there is a factor of 5 or less between the modelled and observed fractional abundances. This factor has been selected such as taking into account possible uncertainties on the detections (e.g. pointing, calibration, etc) as well as uncertainties in the gas:dust ratio that affect the column densities and fractional abundances; also, the model results for abundances scale with the unknown metallicity.
Inspection of Table 6 suggests that the radiation field has little effect on the resulting chemistry, whatever values are attained by and . We shall ignore the FUV radiation field parameter in the following discussion, and focus on the effects of varying and . Note that where the observations supply only upper limits, we have assumed that the actual value is close to the upper limit. Further, we note that the success or failure of the models to match observations appears to be the same for both the centre, i.e. towards NGC 1275, and the eastern filamentary position.
Table 6 shows that individual species may have a match with observation for several models. For example, CN gives a match to observations for Models B, E (at 3 mag), Model D and Model C, while C2H could match the observations for Models E and A. However, if all the molecules are assumed to share the same space and physical conditions, then we require a single model to account for all the species considered. Table 6 shows that there is such a model, Model E. It can account for CN and HCO+ at 3 mag (though not at 8 mag), and for C2H. The values of associated with all three molecules is 50 K. It is encouraging that the same value of applies to all three species. We discuss the implication of this finding in Section 5.
5 Discussion and Conclusions
The comparison in Section 4 between the molecular abundances obtained from the observations and from the models of Bayet et al. (2011) suggests that we can identify one model, Model E, that produces results consistent with the observations. This model has a low FUV radiation field, a low rate of heating by dissipation, but a high cosmic ray ionization rate. Unpublished data from the Bayet et al. (2011) calculations show that cosmic ray heating accounts for 85% of all heating at either 3 or 8 mag.
The enhanced cosmic ray flux may arise in a dynamical interaction, as suggested by Ferland et al. (2009). Those authors also found that an enhanced cosmic ray ionization rate was required to account for the observations of the optical and infrared emitting components of the filaments. It is interesting, therefore, that the results from the present work also suggest that the regions of cluster gas probed by millimetre and sub-millimetre emissions also require a similarly enhanced cosmic ray ionization rate. A second inference is that a high heating rate from energy dissipation is not required; in fact, as Table 6 indicates, a high heating rate from sources other than cosmic rays appears to inhibit a match between models and observations.
In the observations, we have detected only one line in each of three molecular species, so a reliable analysis of the observational data cannot be made. It would be useful for the further study of galaxy cluster gas to make confirmed detections of several lines of each of the three molecular tracers used in this work. In the modelling of the chemistry of the gas in and around NGC 1275 (Bayet et al. 2011), some important physical parameters (e.g. gas:dust ratio and metallicity) are poorly known and undoubtedly have an impact on the model predictions. Nevertheless, the present work shows the value of molecular line observations of cluster gas, and it is interesting that the results reported here for the molecular gas are reasonably consistent with the results for regions probed by the optical and infrared. The main conclusions of this work are that a cosmic ray ionization rate enhanced by a factor of at least one hundred in the cluster gas is required to establish the observed molecular abundances, and that a high heating rate from other causes appears to mitigate against that chemistry. In these circumstances, the HCO+ emission is strong.
| K | K | K | K | K | K | K | |
| NGC 1275 | |||||||
| HCO+ | |||||||
| CN | |||||||
| C2H | |||||||
| Filament | |||||||
| HCO+ | |||||||
| CN | |||||||
| C2H |
| K | K | K | K | K | K | K | |
| NGC 1275 | |||||||
| mag | |||||||
| HCO+ | |||||||
| CN | |||||||
| C2H | |||||||
| mag | |||||||
| HCO+ | |||||||
| CN | |||||||
| C2H | |||||||
| Filament | |||||||
| mag | |||||||
| HCO+ | |||||||
| CN | |||||||
| C2H | |||||||
| mag | |||||||
| HCO+ | |||||||
| CN | |||||||
| C2H |
| Model | Frac. abun. | Frac. abun. | Frac. abun. | |||||
|---|---|---|---|---|---|---|---|---|
| (mag) | (K) | (ergcm-3 s-1) | (s-1) | (Habing) | CN | C2H | HCO+ | |
| A | 3 | 43.8 | 10 | |||||
| A | 8 | 47.5 | 10 | |||||
| B | 3 | 13.8 | 10 | |||||
| B | 8 | 14.9 | 10 | |||||
| C | 3 | 25.3 | 100 | |||||
| C | 8 | 14.5 | 100 | |||||
| D | 3 | 74.8 | 10 | |||||
| D | 8 | 63.3 | 10 | |||||
| E | 3 | 51.0 | 10 | |||||
| E | 8 | 60.2 | 10 |
| Model | C2H | C2H | CN | CN | HCO+ | HCO+ |
| Parameters | centre | filament | centre | filament | centre | filament |
| Model A: low, high, high | - | - | (3) | - | ||
| Model B: low, low, low | - | - | (8) | (8) | ||
| Model C: high, low, low | - | - | (8) | (8) | ||
| Model D: low, high, low | - | - | (3) | (3) | ||
| Model E: low, low, high | (3) | (3) | (3) | (3) |
Acknowledgments
EB, TWH and SV acknowledges financial support from STFC. We thank Alastair Edge for his constructive referee’s report, which helped us improve the paper.
References
- Aalto et al. (2002) Aalto S., Polatidis A. G., Hüttemeister S., Curran S. J., 2002, A&A, 381, 783
- Bayet et al. (2011) Bayet E., Williams D. A., Hartquist T. W., Viti S., 2011, MNRAS, 639
- Braine et al. (1995) Braine J., Wyrowski F., Radford S. J. E., Henkel C., Lesch H., 1995, A&A, 293, 315
- Bridges & Irwin (1998) Bridges T. J., Irwin J. A., 1998, MNRAS, 300, 967
- Conselice, Gallagher & Wyse (2001) Conselice C. J., Gallagher, III J. S., Wyse R. F. G., 2001, Aj, 122, 2281
- Cowie et al. (1983) Cowie L. L., Hu E. M., Jenkins E. B., York D. G., 1983, ApJ, 272, 29
- Crawford & Fabian (1992) Crawford C. S., Fabian A. C., 1992, MNRAS, 259, 265
- Edge et al. (2002) Edge A. C., Wilman R. J., Johnstone R. M., Crawford C. S., Fabian A. C., Allen S. W., 2002, MNRAS, 337, 49
- Fabian et al. (2008) Fabian A. C., Johnstone R. M., Sanders J. S., Conselice C. J., Crawford C. S., Gallagher, III J. S., Zweibel E., 2008, Nature, 454, 968
- Ferland et al. (2009) Ferland G. J., Fabian A. C., Hatch N. A., Johnstone R. M., Porter R. L., van Hoof P. A. M., Williams R. J. R., 2009, MNRAS, 392, 1475
- Gao & Solomon (2004) Gao Y., Solomon P. M., 2004, ApJ, 606, 271
- Habing (1968) Habing H. J., 1968, Bul. of the Astron. Inst. of the Netherland, 19, 421
- Hu et al. (1983) Hu E. M., Cowie L. L., Kaaret P., Jenkins E. B., York D. G., Roesler F. L., 1983, ApJ Letter, 275, L27
- Inoue et al. (1996) Inoue M. Y., Kameno S., Kawabe R., Inoue M., Hasegawa T., Tanaka M., 1996, Aj, 111, 1852
- Lazareff et al. (1989) Lazareff B., Castets A., Kim D.-W., Jura M., 1989, ApJ Letter, 336, L13
- Lim, Ao & Dinh-V-Trung (2008) Lim J., Ao Y., Dinh-V-Trung, 2008, ApJ, 672, 252
- Meijerink et al. (2011) Meijerink R., Spaans M., Loenen A. F., van der Werf P. P., 2011, A&A, 525, A119+
- Mirabel, Sanders & Kazes (1989) Mirabel I. F., Sanders D. B., Kazes I., 1989, ApJ Letter, 340, L9
- Pope, Hartquist & Pittard (2008) Pope E. C. D., Hartquist T. W., Pittard J. M., 2008, MNRAS, 389, 1259
- Reuter et al. (1993) Reuter H. P., Pohl M., Lesch H., Sievers A. W., 1993, A&A, 277, 21
- Revaz, Combes & Salomé (2008) Revaz Y., Combes F., Salomé P., 2008, A&A, 477, L33
- Salomé et al. (2006) Salomé P. et al., 2006, A&A, 454, 437
- Salomé et al. (2011) Salomé P., Combes F., Revaz Y., Downes D., Edge A. C., Fabian A. C., 2011, ArXiv e-prints
- Salomé et al. (2008a) Salomé P., Combes F., Revaz Y., Edge A. C., Hatch N. A., Fabian A. C., Johnstone R. M., 2008a, A&A, 484, 317
- Salomé et al. (2008b) Salomé P., Revaz Y., Combes F., Pety J., Downes D., Edge A. C., Fabian A. C., 2008b, A&A, 483, 793
- Wilman et al. (2002) Wilman R. J., Edge A. C., Johnstone R. M., Fabian A. C., Allen S. W., Crawford C. S., 2002, MNRAS, 337, 63