High-ion absorption in the proximate damped Ly- system toward Q0841+129††thanks: Based on observations taken under proposal IDs 65.O-0063(B), 70.B-0258(A), and 383.A-0376(A) with the Ultraviolet and Visual Echelle Spectrograph (UVES) on the Very Large Telescope (VLT) Unit 2 (Kueyen) operated by the European Southern Observatory (ESO) at Paranal, Chile.
We present VLT/UVES spectroscopy of the quasar Q0841+129, whose spectrum shows a proximate damped Ly- (PDLA) absorber at =2.47621 and a proximate sub-DLA at =2.50620, both lying close in redshift to the QSO itself at =2.495100.00003. This fortuitous arrangement, with the sub-DLA acting as a filter that hardens the QSO’s ionizing radiation field, allows us to model the ionization level in the foreground PDLA, and provides an interesting case-study on the origin of the high-ion absorption lines Si iv, C iv, and O vi in DLAs. The high ions in the PDLA show at least five components spanning a total velocity extent of 160 km s-1, whereas the low ions exist predominantly in a single component spanning just 30 km s-1. We examine various models for the origin of the high ions. Both photoionization and turbulent mixing layer models are fairly successful at reproducing the observed ionic ratios after correcting for the non-solar relative abundance pattern, though neither model can explain all five components. We show that the turbulent mixing layer model, in which the high ions trace the interfaces between the cool PDLA gas and a hotter phase of shock-heated plasma, can explain the average high-ion ratios measured in a larger sample of 12 DLAs.
Key Words.:
quasars: absorption lines – galaxies: high-redshift – galaxies: halos – galaxies: ISM1 Introduction
In the process of galaxy assembly and evolution, interstellar and circumgalactic gas clouds play a key role, representing both the fuel for future star formation and the metal-enriched by-products of past star formation. Absorption-line spectroscopy is a powerful way to study these gas reservoirs, to characterize their kinematic and chemical properties, and to investigate their link to star formation. Of particular interest for probing interstellar gas are the damped Ly- systems (DLAs), the highest column density absorbers defined by log (H i)20.3 (Wolfe et al. 1986). Their high neutral gas content ensures they select over-dense regions, including galaxies and their halos. DLAs contain the majority of the neutral gas in the Universe in the range =0–5 (Wolfe et al. 2005), and serve as luminosity-independent indicators of cosmic chemical enrichment.
Despite being known for their neutrality, DLAs frequently show high-ion absorption overlapping in velocity space with the neutral lines yet tracing a separate phase (or phases) of gas. The first high ions detected in DLAs were C iv and Si iv (Wolfe et al. 1994; Lu et al. 1995, 1996; Wolfe & Prochaska 2000a, b), which almost always show a different (though overlapping) component structure than the low ions. We have recently been surveying high-ion absorption in DLAs at =2–4 at high resolution using the VLT/UVES spectrograph, finding the high ions are ubiquitous. In data with S/N30 per pixel, we report detection rates of 34% for O vi (Fox et al. 2007a), 100% for C iv and Si iv (Fox et al. 2007b), and 13% for N v (Fox et al. 2009). High-ion absorption is also seen in a composite SDSS spectrum of several hundred DLAs (Rahmani et al. 2010). In Fox et al. (2007a) we favored the interpretation that the O vi absorption components in DLAs trace warm-hot ( K) collisionally-ionized plasma, rather than cool ( K) photoionized plasma, based on two observational findings: first, a tendency for the individual O vi components in DLAs to be broader than the C iv components (suggesting higher temperatures in the O vi phase), and second, the failure of photoionization models to reproduce the O vi column densities measured in a particular DLA studied in detail (the =2.076 DLA toward Q2206–199) without recourse to unreasonably large path lengths. Lehner et al. (2008) investigated the =2.377 DLA toward J1211+0422, and similarly found that photoionization cannot reproduce the observed O vi column, although they also found that single-phase collisional ionization models (equilibrium or non-equilibrium) cannot explain the high-ion column densities in that system.
The origin of O vi absorption in DLAs demands further investigation, since the observational characterization of warm-hot gas in galaxy halos at redshifts 2–3 would provide useful constraints on models of galaxy formation and evolution. Unfortunately, observations of O vi absorption at these redshifts are not straightforward, since the O vi resonance doublet (1031,1037) lies in the Ly- forest and so often suffers from severe contamination from foreground H i absorbers (e.g. Burles & Tytler 1996; Frank et al. 2010). With a large enough DLA sample, one occasionally comes across a case where the O vi doublet lines are only partially (rather than completely) blended, and where information on portions of the O vi line profiles can be recovered (Fox et al. 2007c; Lehner et al. 2008; Simcoe et al. 2002). Such a case (the DLA at =2.47621 toward Q0841+129) is discussed in this paper. This system has another advantage: although it lies at only 1 630 km s-1 from the background QSO (classifying it as a proximate DLA or PDLA), it is shielded from the QSO’s ionizing radiation by a second absorber, a sub-DLA at =2.50620, very close in redshift to the QSO at =2.495100.00003. The H i column in the sub-DLA, log (H i)=19.000.15, is high enough that the system is optically thick at the Lyman Limit, but not at high photon energies ( eV, i.e. Å). Therefore the sub-DLA acts to harden the ionizing radiation field incident on the PDLA.
PDLAs are defined as those DLAs lying within 5 000 km s-1 (or sometimes 3 000 km s-1) of the redshift of the background QSO (Ellison et al. 2002, 2010, 2011; Russell et al. 2006; Rix et al. 2007; Prochaska et al. 2008). They are frequently excluded from studies of intervening DLAs, due to their potentially unusual ionization conditions and environmental effects (such as galaxy clustering near quasars). However, the fact that the (enhanced) ionizing radiation field in PDLAs is calculable can be turned to our advantage, and allows them to be used as case-studies for the origin of high-ionization plasma in DLAs. That is the approach followed in this paper.
2 Observations and Data Handling
Q0841+129 has been observed with VLT/UVES (Dekker et al. 2000) under three ESO programs, each time with different dichroic settings and wavelength coverage. These data were taken in 2000 (Dic2 412+860 setting, program P65.O-0063), in 2002 (Dic2 390+860, 70.B-0258), and in 2009 (Dic1 390+580, 383.A-0376), all with a 1.0″ slit (except the red-arm P70 observations, which used a 0.9″ slit). We downloaded these data and their associated calibration files from the ESO archive, and reduced them using the UVES pipeline (Ballester et al. 2000) in MIDAS, co-adding the individual exposures after weighting by signal-to-noise. This produced a final spectrum with 6.6 km s-1 resolution (FWHM) in 2 km s-1 pixels covering the range 3 286 to 10 429 Å (with a gap between 5 756 and 5 837 Å).
Three DLAs are present along the Q0841+129 sight line, at =1.8639, 2.3745, and 2.47621 (Ledoux et al. 2006) in the vacuum heliocentric frame. In addition, a sub-DLA is detected at =2.50620, with all the hallmarks of an intrinsic absorber (see §6). The proximity (1 630 km s-1) of the =2.47621 DLA to the QSO redshift =2.495100.00003 (derived in §4) classifies it as a PDLA. The system has log (H i)=20.800.10 and [Zn/H]=[Zn ii/H i]=1.600.10 (Ledoux et al. 2006), a good indication of the true metallicity since Zn is typically undepleted onto dust grains (e.g. Pettini et al. 1997). In a WMAP 7-year cosmology (=71 km s-1 Mpc-1, =0.27, =0.73; Jarosik et al. 2011), the Hubble parameter at =2.5 is =250 km s-1 Mpc-1 (using the relation given in Phillipps et al. 2002). Therefore, assuming the relative motion between the QSO and PDLA is purely due to Hubble flow (i.e., assuming peculiar velocities are negligible, though see Ellison et al. 2010), we find the PDLA lies at 6.5 proper Mpc from the quasar.
3 H i column densities in proximate DLA and sub-DLA
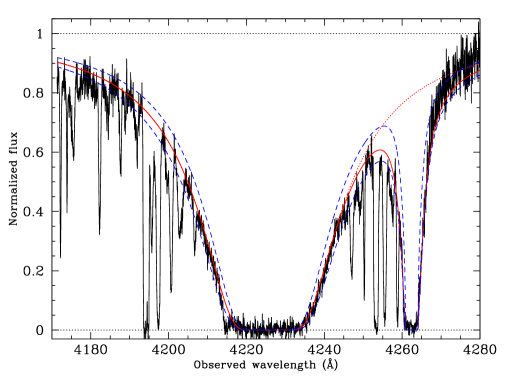
In Figure 1 we show the Ly- profiles of the two proximate absorbers. Ly- absorption from the sub-DLA at =2.50620 lies in the red wing of the Ly- absorption from the DLA at =2.47621. The sub-DLA is far-enough separated from the DLA that its own damping wings are well-defined and can be fit to determine its H i column density. These wings are visible in Figure 1 at observed wavelengths of 4250–4260 and 4265–4270Å. Voigt-profile fits to the two absorbers yield log (H i)=20.800.10 in the PDLA and log (H i)=19.000.15 in the proximate sub-DLA.
4 Emission-line redshift and specific luminosity of Q0841+129
No precise measurement of the redshift of Q0841+129 currently exists in the literature. We used a flux-bisecting algorithm to measure the observed emission-line wavelengths of Ly- 1025.722, O i 1304.460 (multiplet), Si iv 1393.755, Si iv 1402.770, N v 1240.14 (doublet), C iv 1548.195, He ii 1640.42, C iii] 1908.73, and Mg ii 2798.74. A weighted average of the redshifts determined from each of these nine lines gives =2.495100.00003, the value we adopt for the rest of this paper. Although it is common practice to apply velocity offsets to each line before averaging (e.g. Vanden Berk et al. 2001), we found no need to do this. The Mg ii redshift (considered a good measure of the true value; Hewett & Wild 2010) is 2.495120.00001.
We derived the specific luminosity of Q0841+129 at the Lyman Limit, , following Guimarães et al. (2007). The method uses the QSO’s observed -magnitude (18.5) and emission-line redshift , assumes an intrinsic QSO spectral slope of 0.5 (where ), and corrects for Galactic extinction using the value =0.048 found toward Q0841+129 from the maps of Schlegel et al. (1998). This gives =8.86erg s-1 Hz-1. Assuming the QSO-PDLA distance is Hubble-Flow dominated (6.5 Mpc), we derive a specific flux of QSO radiation at 912 Å at the PDLA of erg cm-2 s-1 Hz-1, a factor of 6 lower than the calculated flux of the UV background (UVB) at this redshift erg cm-2 s-1 Hz-1 (Haardt & Madau 2001; Faucher-Giguère et al. 2009)111A recent measurement of the UVB at =2.73 using the proximity effect is erg cm-2 s-1 Hz-1 (Dall’Aglio et al. 2008), several times lower than the Haardt & Madau (2001) value, but still higher than the flux incident on the PDLA from the background QSO.. Based on this calculation of , the PDLA is outside the proximity zone of the quasar, although for higher photon energies, we find the PDLA does lie inside the proximity zone (see §6). Despite these complications in how to define proximity, we still refer to the absorber as a PDLA, following convention.
5 Absorption in PDLA
In Figure 2 we show the normalized profiles of 36 absorption lines of both high and low ions in the PDLA. The low-ion profiles show a simple component structure; S ii 1259 shows a single unsaturated component spanning =30 km s-1 (where is the width containing the central 90% of the optical depth; Prochaska & Wolfe 1997). An additional weak low-ion component is seen in C ii and Si ii near 50 km s-1 in the PDLA rest-frame. Integrated column densities for the low ions were measured using the apparent optical depth (AOD) technique (Savage & Sembach 1991), using atomic data from Morton (2003), and are presented in Table 1.
| Line | ,222Velocity range used in AOD integration, relative to =2.47621. The default is 30 to 30 km s-1, but this is reduced when necessary to avoid blends. | 333Rest-frame equivalent width, with error that includes statistical and continuum-placement contributions combined in quadrature with a 2.5 mÅ error accounting for the uncertainties in the velocity integration range. | log 444Apparent column density. Lower limit given if line is saturated. Errors include statistical and continuum-placement contributions combined in quadrature with a 0.01 dex error accounting for the uncertainties in the velocity integration range. Entries marked ∗ are potentially blended and should be treated with caution. |
|---|---|---|---|
| ( km s-1) | (mÅ) | ( in cm-2) | |
| N i 1134.2 | 30, 30 | 133 | 13.960.03 |
| N i 1134.4 | 30, 30 | 263 | 13.990.01 |
| N ii 1083 | 30, 30 | 443 | 13.690.01∗ |
| S ii 1250 | 30, 30 | 223 | 14.510.02 |
| S ii 1253 | 30, 30 | 493 | 14.570.01 |
| S ii 1259 | 30, 30 | 593 | 14.530.01 |
| C ii 1036 | 30, 30 | 1803 | 14.72 |
| C ii 1334 | 30, 30 | 2433 | 14.65 |
| C iii 977 | 30, 30 | 2003 | 14.17 |
| Ar i 1048 | 30, 30 | 243 | 13.050.02∗ |
| Si ii 1260 | 30, 30 | 2413 | 13.85 |
| Si ii 1193 | 30, 30 | 2073 | 14.06 |
| Si ii 1190 | 30, 30 | 1794 | 14.27 |
| Si ii 1526 | 30, 30 | 2203 | 14.52 |
| Si ii 1304 | 30, 30 | 1733 | 14.59 |
| Si ii 1808 | 30, 30 | 543 | 14.990.01∗ |
| Mg ii 2796 | 30, 30 | 5053 | 13.60 |
| Mg ii 2803 | 30, 30 | 4944 | 13.92 |
| Zn ii 2026 | 30, 30 | 123 | 11.830.04 |
| Cr ii 2056 | 15, 15 | 213 | 12.760.02 |
| Cr ii 2062 | 15, 15 | 203 | 12.870.02 |
| Cr ii 2066 | 15, 15 | 103 | 12.740.03 |
| Fe ii 1144 | 30, 30 | 1193 | 14.34 |
| Fe ii 1608 | 30, 30 | 1613 | 14.51 |
| Fe iii 1122 | 5, 22 | 213 | 13.580.01∗ |
| Al iii 1854 | 20, 20 | 563 | 12.590.01 |
| Al iii 1862 | 20, 20 | 303 | 12.600.01 |
| Si iii 1206 | 30, 30 | 2493 | 13.75 |
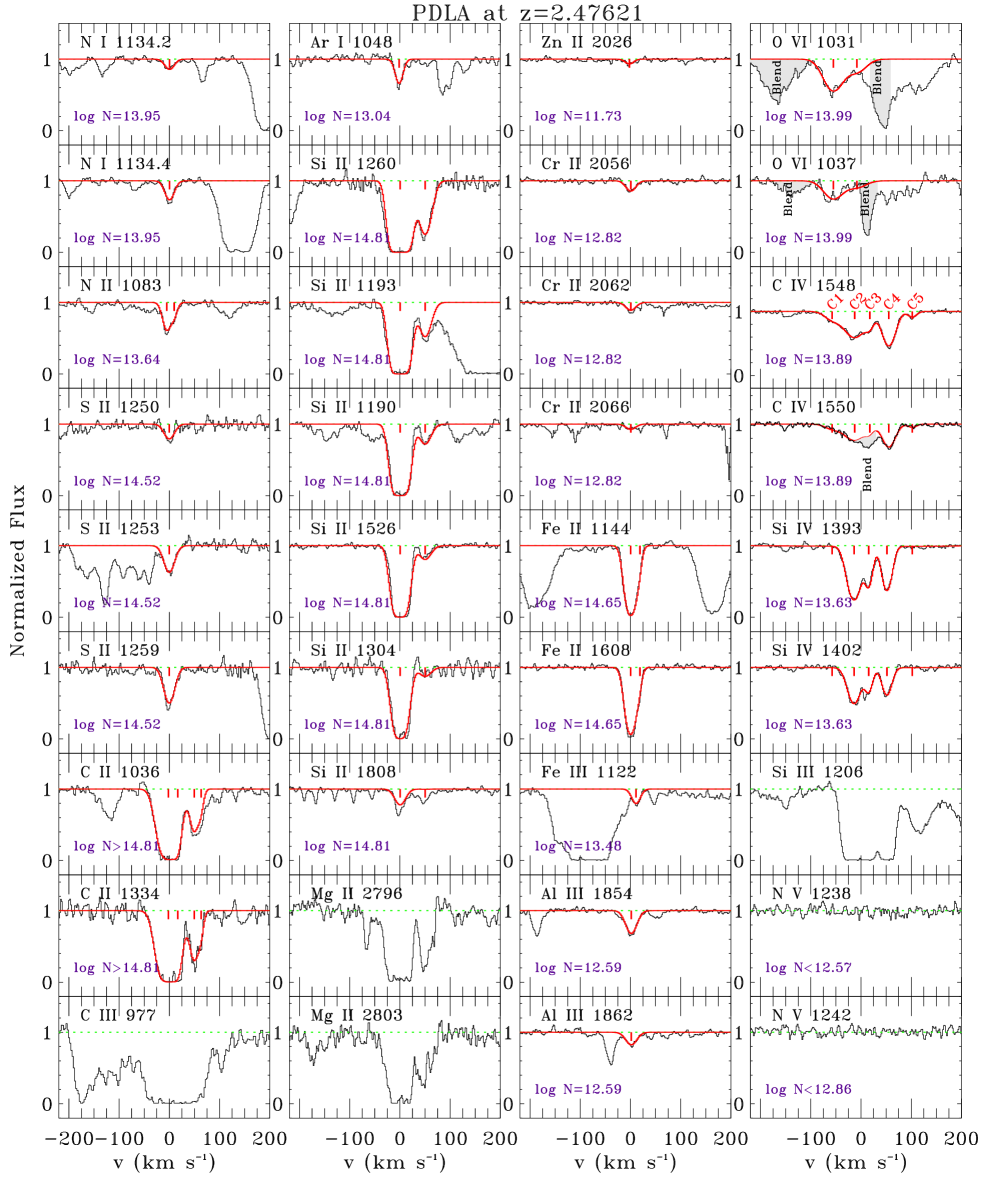
In the high ions, multi-component absorption is observed in the PDLA in Si iv, C iv, and O vi, though the O vi profiles are partly blended. N v is not detected. Voigt-profile fits were conducted to the high-ion absorption using the VPFIT software package555See http://www.ast.cam.ac.uk/rfc/vpfit.html. These fits are over-plotted on Figure 2 as red lines and detailed in Table 2, where we also present AOD measurements of the high ions. We chose not to tie the C iv and Si iv component centroids during the fit process, since several differences between the profiles suggest the two ions are not fully co-spatial.
The high-ion component structure in the PDLA differs from the low-ion structure. This is illustrated in Figure 3, where the apparent column density profiles of several high ions and Fe ii 1608 (chosen as an unsaturated low-ion line) are compared. The high ions are contained in several components extending over 160 km s-1, in sharp contrast to the narrowness of the Fe ii line covering just 30 km s-1. Based on the C iv profile we identify five high-ion components in the PDLA, named as follows: C1 centered at 60 km s-1, C2 at 15 km s-1, C3 at 15 km s-1, C4 at 55 km s-1, and C5 at 102 km s-1 (all defined relative to ). Although C iv and Si iv show similarities in their component structure, there are clear differences: Si iv is detected in C2, C3, and C4, but not in C1 and C5. The relative strength of Si iv to C iv changes substantially between C2, C3, and C4. Furthermore, C2 and C4 are broader in C iv than in Si iv (see -values reported in Table 2).
| Ion | Comp. | 666Velocity centroid relative to =2.47621. | log | log 777Total VPFIT column density, summed over all components, with errors added in quadrature. | log (strong)888Apparent column density measured from strong and weak doublet lines in velocity interval indicated. | log (weak)c | ,999Velocity range used in AOD integration, relative to . | |
|---|---|---|---|---|---|---|---|---|
| ( km s-1) | ( km s-1) | ( in cm-2) | ( in cm-2) | ( in cm-2) | ( in cm-2) | ( km s-1) | ||
| Si iv | C1 | … | … | 11.72 | 13.630.01 | 13.600.01 | 13.630.01 | 50,80 |
| … | C2 | 131 | 16.70.4 | 13.340.01 | … | 13.280.01 | 13.280.01 | 100, 0 |
| … | C3 | 151 | 9.90.6 | 12.880.02 | … | … | … | |
| … | C4 | 511 | 12.50.3 | 13.060.01 | … | … | … | |
| … | C5 | … | … | 11.86 | … | … | … | |
| C iv | C1 | 573 | 19.23.2 | 12.780.13 | 13.890.03 | 13.890.01 | (blended) | 100,120 |
| … | C2 | 121 | 27.33.1 | 13.530.04 | … | 13.490.01 | 13.490.01 | 100, 0 |
| … | C3 | 171 | 8.81.8 | 12.690.14 | … | … | … | |
| … | C4 | 551 | 15.80.3 | 13.480.01 | … | … | … | |
| … | C5 | 1021 | 9.41.5 | 12.400.05 | … | … | … | |
| O vi101010Voigt fit for O vi only possible in components C1 and C2. O vi AOD measurements made over velocity region where the profiles of the two doublet lines overlap. The C iv, Si iv, and N v measurements are repeated over this interval so the ionic ratios can be derived. | C1 | 553 | 25.02.5 | 13.870.06 | 13.990.11 | 13.970.01 | 13.930.01 | 100, 0 |
| … | C2 | 85 | 24.317.5 | 13.390.32 | … | … | … | |
| N v111111No detection in either N v line. Upper limits are 3. | C1 | … | … | … | … | 12.57 | 12.86 | 100, 0 |
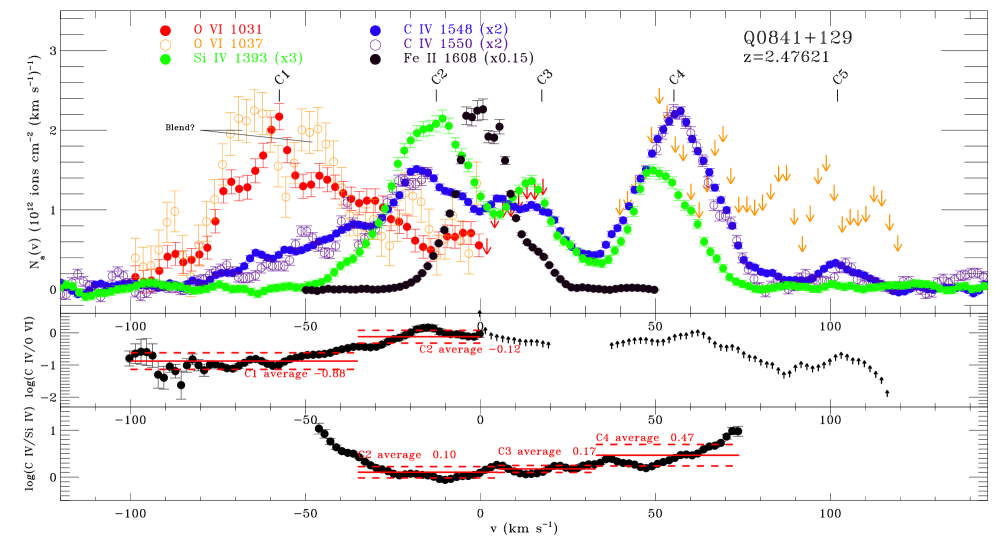
Partial blending complicates the measurement of O vi. We report an O vi detection in the range 100 to 0 km s-1 (corresponding to components C1 and C2; see Figure 3), because the two lines of the O vi doublet show largely consistent optical depth profiles at these velocities (although small differences are observed at 70 to 40 km s-1). Furthermore, the integrated AOD column densities of the two O vi lines made over the interval 100 to 0 km s-1 agree to within 0.04 dex (see Table 2). Apparent features in O vi 1031 and O vi 1037 follow C iv components C3 and C4, respectively, but in each case the data are noisy, and the other O vi line is blended, so we cannot confirm the detection in those components. We therefore only report upper limits on O vi in C3, C4, and C5. For each of these three components the upper limit was derived from whichever of the two O vi lines gave the stronger constraint. These upper limits are used to constrain the high-ion ratios in each component.
The probability that the O vi detections we report in C1 and C2 are genuine can be roughly estimated using the known line density of the Ly- forest, a major contaminant. The data presented by Kim et al. (1997) indicate a mean separation of 500 km s-1 for Ly- forest lines with (H i)=13.1–14.3 at =2.5, indicating that the probability of a forest line falling in a 20 km s-1 interval around a given redshift is (ignoring clustering). The probability of two forest lines falling at that redshift, one in each line of O vi, is . However, the observed density of blends is far higher than one per 500 km s-1, indicating that other contaminants (metal lines and higher-order Lyman lines) are also present. We minimize the chance of these contaminants mimicking O vi by relying on intervals where both O vi lines agree.
6 Absorption in proximate sub-DLA
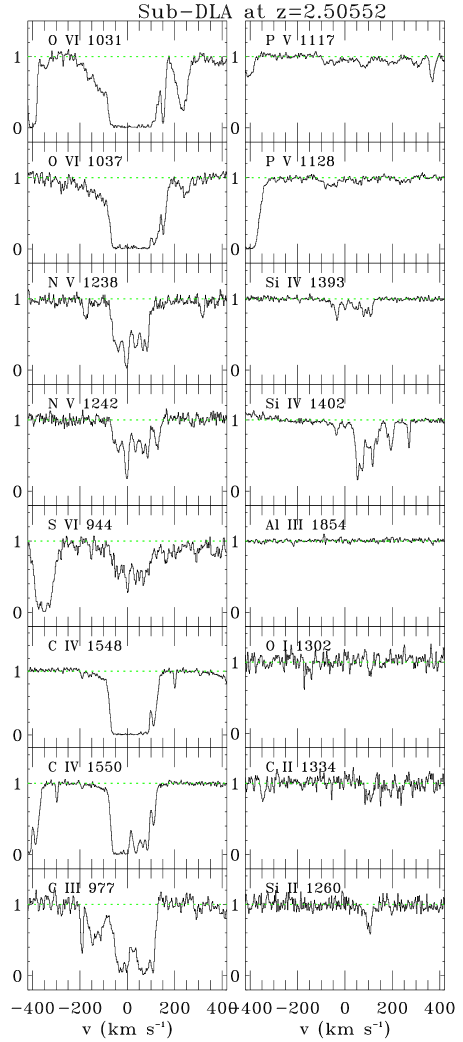
Absorption-line profiles from the proximate sub-DLA at =2.50620 are shown in Figure 4. This system has log (H i)=19.000.15 and shows strong high-ion absorption and weak low-ion absorption. In particular, it exhibits strong multi-component N v absorption, which is usually absent from intervening DLAs, multi-component S vi 944 absorption, also unknown in intervening DLAs, and fully saturated O vi absorption. It has an unusually low ratio [O i/H i]=2.430.05, indicating unusual ionization conditions given that intrinsic sub-DLA metallicities are rarely that low (e.g Kulkarni et al. 2007; Dessauges-Zavadsky et al. 2009). All these properties identify the sub-DLA as an intrinsic system arising close to the central engine of the AGN. The intrinsic nature of the sub-DLA supports our interpretation that it lies between the PDLA and the QSO, as is suggested (but not necessarily required) by the sub-DLA having a higher redshift than the PDLA.
The intrinsic sub-DLA could be used to study the physical conditions and abundances in the gas immediately surrounding the AGN. However, in our case, the system is of principal interest as a blocking filter, serving to attenuate the background QSO radiation incident upon the foreground PDLA. The attenuating effect of the sub-DLA on the QSO’s ionizing radiation can be calculated from the following equations, which relate the H i and He ii optical depths to the H i and He ii columns and wavelengths:
| (1) |
| (2) |
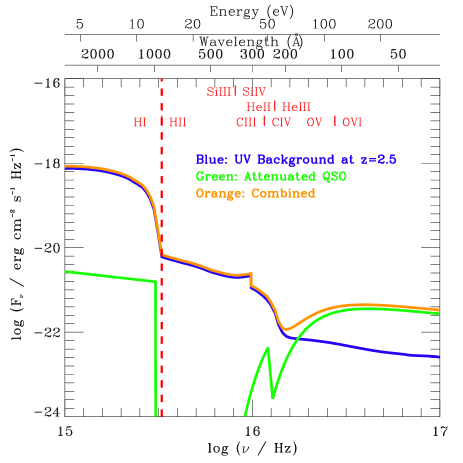
where =6.3 cm2 and =/4 are the photoionization cross sections for H i and He ii, respectively. These expressions are evaluated using the measured sub-DLA H i column log (H i)=19.00, assuming He/H=0.0823 by number (equivalent to a He mass fraction of 0.24), and assuming all the He is in the form of He ii, giving log (He ii)=17.9. The total optical depth is then =+ (we do not consider metal-line opacity). The effect of the H i and He ii opacity from the sub-DLA is to remove photons with energies eV from the radiation field, with the H i providing the opacity at eV and the He ii at eV. Thus the sub-DLA hardens the ionizing radiation field incident on the PDLA, by preferentially transmitting photons at eV. This is shown in Figure 5, where the total radiation field incident on the PDLA is derived. The radiation field is calculated as the sum of: (1) the quasar spectrum attenuated by the sub-DLA, assuming an intrinsic power-law spectrum with =0.5, a normalization from the value of derived in §4, and attenuated using the sub-DLA optical depths described above, and (2) the extragalactic UVB at =2.5, which is built into CLOUDY and is based on Haardt & Madau (1996, 2001). We do not consider internal sources of radiation within the PDLA (e.g. any star-forming regions), nor do we consider any attenuation of the radiation field from the PDLA itself. Figure 5 shows that the UVB is stronger than the QSO radiation field at energies eV, but above this energy, the QSO radiation dominates. The QSO radiation is therefore important to include when investigating the origin of O vi (which requires 114 eV for its creation). The combined radiation field is used as an input for the CLOUDY modelling described in §8.
7 PDLA ionization level: the low-ion phase
The ionization level in the low-ion phase of DLAs can be diagnosed with the Ar i/Si ii, Ar i/S ii, Fe iii/Fe ii, and N ii/N i ratios (Prochaska et al. 2002; Howk & Sembach 1999; Vladilo et al. 2001). In the PDLA, we measure log (Ar i)/(Si ii)=1.770.15, log (Ar i)/(S ii)=1.470.03, log (Fe iii)/(Fe ii)=1.170.05 (or 1.020.05 when considering the strongest component only), and log (N ii)/(N i)=0.310.07, using the integrated VPFIT column densities. Each of these four ratios indicates the low-ion gas is predominantly (but not completely) neutral with a hydrogen ionization fraction (H i)=0.1–0.5 (Prochaska et al. 2002); a value (H i)0.5 is ruled out since that would lead to log (N ii)/(N i)–0.2 and log (Fe iii)/(Fe ii)–1.0; a value (H i)0.1 is excluded since that would lead to log (Ar i)/(Si ii)–0.2 (Sofia & Jenkins 1998) and log (Ar i)/(S ii)–0.2 (neglecting any possible dust or nucleosynthesis effects). The Prochaska et al. (2002) model predictions were based on CLOUDY calculations that used the UV background as the incident radiation field. They are applicable to the PDLA since, for the energies of interest for the low ions ( eV), the radiation field incident on the PDLA is UV-background dominated (Figure 5). Note that the measured Fe iii/Fe ii ratio in the PDLA is technically an upper limit as Fe iii 1122 is detected at low significance close to several blends, and there is an 10 km s-1 offset between the Fe ii and Fe iii velocity centroids. However, if the feature we fit as Fe iii is a blend, then the true Fe iii column and Fe iii/Fe ii ratio will be lower, thus strengthening the conclusion that the low-ion gas is predominantly neutral. Likewise, any contamination of N ii 1083 would lower the true N ii column and the N ii/N i ratio, again reinforcing the finding that the low-ion gas has (H i)0.5.
8 PDLA ionization level: the high-ion phase
In this section we use the observed high-ion column densities and their ratios to test various models of the origin of the high-ion plasma. The C iv/Si iv, C iv/O vi, and N v/O vi ratios measured by Voigt profile fitting in each PDLA component are given in Table 3, with limits given where appropriate. We also list the average PDLA high-ion ratios integrated over velocity, and for comparison, the high-ion ratios measured in a range of other galaxy-halo environments. Considerable variation in the ratios is seen between components, indicating variable ionization conditions; the C iv/Si iv ratio varies from 0.650.25 in C3 to 11.5 in C1. The C iv/O vi ratio varies by over a factor of ten between the two components where we detect O vi, from 0.080.03 in C1 to 1.41.0 in C2.
| Component (velocity) | 121212Component ratios derived from VPFIT columns, with limits given for components with Si iv and N v non-detections, or potential O vi blending. | ||
|---|---|---|---|
| C1 ( 57 km s-1) | 11.5 | 0.080.03 | 0.049 |
| C2 ( 12 km s-1) | 1.540.17 | 1.41.0 | 0.194 |
| C3 ( 17 km s-1) | 0.650.25 | 0.25 | … |
| C4 ( 55 km s-1) | 2.640.07 | 0.56 | … |
| C5 ( 102 km s-1) | 3.4 | 0.06 | … |
| PDLA average131313PDLA average ratios derived from AOD integrations. The C iv/Si iv ratio is measured over the full interval 100 to 120 km s-1. The C iv/O vi and N v/O vi ratios are measured over the (unblended) velocity interval 100 to 0 km s-1. | 1.950.09 | 0.350.02 | 0.042 |
| DLA average141414Average and standard deviation of ratio among 12 DLAs with O vi absorption at =2–3 (Fox et al. 2007a). The N v/O vi average is an upper limit since N v is only detected in 3 of these 12 DLAs. | 5.372.20 | 0.560.28 | 0.046 |
| Milky Way disk average151515Taken from Lehner et al. (2011). Based on measurements made along 38 Galactic disk sight lines. | 3.32.5 | 0.600.47 | 0.120.07 |
| Milky Way halo average161616Taken from Wakker et al. (2011). Based on measurements made along 58 extragalactic sight lines. | 4.191.47 | 0.710.36 | 0.140.04 |
| LMC average171717Range observed in four LMC sightlines (not including H ii regions; Lehner & Howk 2007). | 1.5–2.5 | 0.09–0.59 | 0.33 |
8.1 Photoionization models
The first high-ion origin scenario we examine is photoionization (PI), which is often considered the ionization mechanism for the C iv and Si iv absorption in DLAs (Lu et al. 1995; Mo & Miralda-Escudé 1996; Maller et al. 2003; Wolfe et al. 2005; Lehner et al. 2008), but which has been unable to explain the DLA O vi observations presented by Fox et al. (2007a) and Lehner et al. (2008). This model is of particular interest in the case of the PDLA given the enhanced EUV radiation field incident on the absorber. We used the CLOUDY PI code (last described in Ferland et al. 1998) to generate models for PDLA components C1 and C2, the only two with O vi measurements. The CLOUDY models assume the gas has uniform density and plane-parallel geometry, and use the two-component (QSO+UVB) radiation field shown in Figure 5. The model uses the measured metallicity [Zn/H]=1.60 and a DLA relative abundance pattern with [C/O]=0.5, [Si/O]=0, and [N/O]=1.0, typical for DLAs with O/H (Pettini et al. 2008; Petitjean et al. 2008). Solar abundances were taken from Asplund et al. (2009). No constraint on (H i) in each high-ion component is available, since any H i lines would be hidden underneath the strong H i lines from the neutral phase. In a given component, there are two unknowns, the ionization parameter and the total (neutral plus ionized) hydrogen column density (H). We ran a grid of CLOUDY models at different values of and (H), with log varied from 3.4 to 0.0 in 0.2 dex intervals, and log (H) varied from 18.0 to 21.0 in 0.1 dex intervals, and used a two-step iterative technique to solve for the best-fit values of the two variables. In the first step, we found the value of that best reproduces the observed Si iv/C iv ratio or C iv/O vi ratio, depending on which ions are detected. In the second step, we found the value of (H) that reproduces the observed absolute C iv and Si iv (or C iv and O vi) column densities, given the value of . The best-fit results for C1 and C2 are shown in Figure 6.
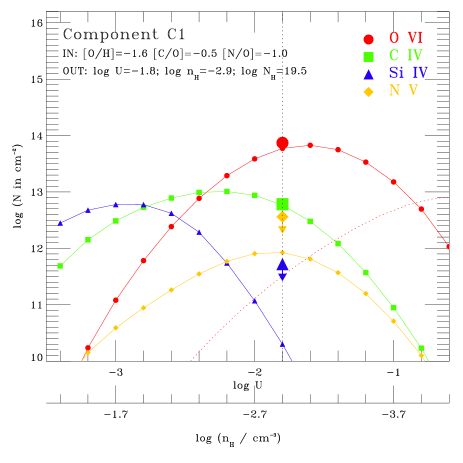
In C1, the strongest O vi component where (O vi)10(C iv) and where Si iv is not detected, a PI solution can be found at log =1.8 and log (H)=19.5, assuming [C/O]=0.5. In this model the derived cloud density log is and the line-of-sight cloud size () is 8 kpc. This solution, found by matching the C iv/O vi ratio, is consistent with the non-detections of Si iv and N v, and is only possible when the EUV enhancement from the background quasar are included. UVB-only CLOUDY models do not produce enough O vi, as shown by the dotted red line on Figure 6.
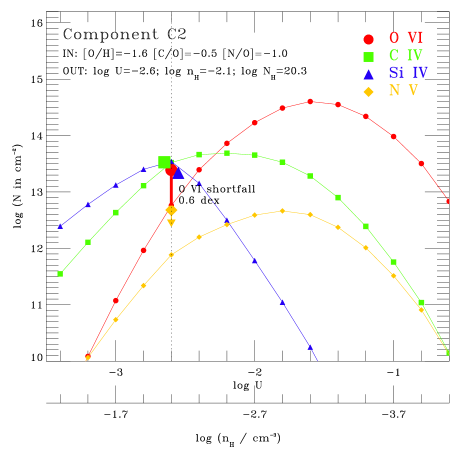
In C2, C iv, Si iv, and O vi are all detected. In this component the C iv profile more closely follows Si iv than O vi. Therefore we use C iv and Si iv as the inputs to the CLOUDY model, finding log =2.60.1, log 2.1, and log (H)20.3, but this model under-predicts the observed O vi column by 0.6 dex (a factor of 4). This is marked on the lower panel of Figure 6 as the “O vi shortfall”. Therefore there is no single-phase PI solution to the high-ion columns in this component. Explaining the three ions in component C2 by PI alone would require a two-phase (or multi-phase) solution, with some fraction of the C iv arising with the Si iv, and the remainder arising with the O vi. However, such two-phase PI models are ad hoc, non-unique, and without a clear physical motivation. Indeed, any combination of three ions (in this case O vi, C iv, and Si iv) can be reproduced with a two-phase or multi-phase PI model, so although we cannot rule out such models, we have no clear reason to favor them.
We do not discuss PI models to C3, C4, and C5 since O vi measurements are unavailable in these components, and hence the ionization state is poorly constrained. If these components are photoionized, the implied gas densities log derived from the C iv/Si iv ratios are 1.9, 2.1, and 2.3, respectively, assuming [C/Si]=0.5.
To summarize this sub-section, PI from the background quasar is a viable explanation for the high ions in C1, the PDLA component with the strongest O vi, so long as [C/O]=0.5 and we include the EUV radiation from the background QSO. This model gives a gas density log 2.9. No single-phase PI solution is found for C2, since the observed O vi is four times stronger in that component than the PI model predicts, but the C iv and Si iv in C2 (and in C3 and C4) can be explained by PI in plasma at gas densities log if [C/Si]=0.5. To explore other possibilities, we now turn to collisional ionization (CI) models.
8.2 Collisional ionization models
In this section several CI models are evaluated in their ability to reproduce the high-ion observations in the PDLA: single-phase collisional ionization equilibrium (CIE) and non-equilibrium models (Sutherland & Dopita 1993; Gnat & Sternberg 2007), conductive interfaces (INT; Böhringer & Hartquist 1987; Borkowski et al. 1990; Gnat et al. 2010)181818We use the abbreviation INT to refer to conductive interfaces, since CI is already used to refer to collisional ionization., and turbulent mixing layers (TML; Begelman & Fabian 1990; Slavin et al. 1993; Esquivel et al. 2006; Kwak & Shelton 2010; Kwak et al. 2011). The common element uniting these models is that they place the high ions in warm-hot, collisionally-ionized plasma rather than cool photoionized plasma. In the INT and TML models, the high ions trace the radiatively cooling boundary layers between cool (104 K) clouds and hot (106 K) plasma; they differ in whether conduction or turbulent mixing is the dominant energy transport mechanism from the hot to the cool phase. To test the models, we compare the high-ion column density ratios they predict with the observations. This is shown in Figure 7, with C iv/O vi vs N v/O vi plotted on the left and C iv/O vi vs C iv/Si iv on the right. These ratio-ratio plots, first used by Savage & Sembach (1994), allow observed ratios to be compared with those measured in other environments.
Before comparing to the observations, the model predictions for the high-ion ratios have to be corrected for the sub-solar C/O, C/Si, and N/O abundance ratios typical for DLAs, because the models are computed for gas with solar relative abundances. When making this correction, we neglect any changes in radiative cooling that result from changing the relative elemental abundances, so we assume that the ionic ratios scale linearly with the relative abundance of the two elements, e.g. we assume that (C iv)/(O vi)(C/O), following Fox et al. (2004). Our adopted DLA abundances [C/O]=0.5, [C/Si]=0.5, and [N/O]=1.0 are typical for the neutral phase of DLAs (Pettini et al. 2008; Petitjean et al. 2008) and are assumed to apply in the high-ion phase(s) as well. The effect of these abundance corrections on the predicted ionic ratios is shown by the solid arrows on Figure 7 (hereafter we refer to these new regions of ratio-ratio space as the “corrected predictions” of the models).
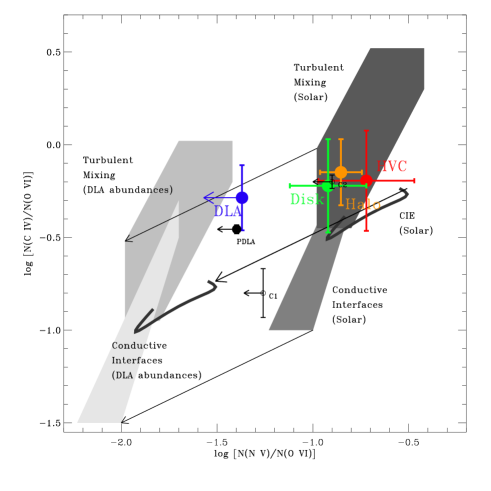
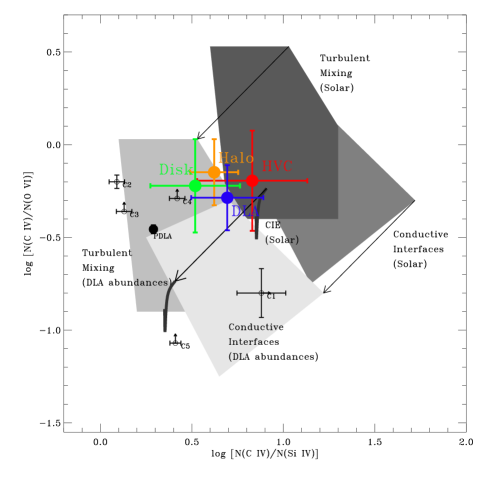
Our chosen TML models are those presented by Kwak & Shelton (2010). We consider the full range of ionic ratios predicted by their non-equilibrium Model A (the reference model, described in their Table 1). The ratios were calculated as a function of time in 1 Myr intervals up to a maximum mixing layer age of 80 Myr, and the range shown on Figure 7 reflects the variation in the ratios as the mixing layers evolve with time. Our chosen INT models are those of Gnat et al. (2010). We consider the full range of column density ratios from both the “Maximal” and “Central” cases, covering all parameter choices given in their Table 4. We show the model predictions as continuous regions of ratio-ratio space, rather than discrete points, to account for the possibility that the actual values of the model parameters (coronal gas temperature, density, etc) lie between the round-number values chosen when the models were compiled.
Using the CIE models of Gnat & Sternberg (2007), we find there is no single-temperature CIE solution to the O vi, C iv, and Si iv column densities, nor is there a single-temperature non-equilibrium CI solution in either the isobaric or isochoric cases (not shown on Figure 7). The CIE and non-equilibrium CI predictions in ratio-ratio space do not overlap with the observed ratios – they miss both the PDLA average and the individual component ratios.
On Figure 7a, inspection of the y-axis shows that the average PDLA C iv/O vi ratio lies within the corrected range predicted by the TML models, and toward the upper end of the corrected range predicted by the INT models. On the x-axis, the PDLA average N v/O vi ratio is an upper limit since N v is not detected, but this is consistent with the corrected predictions of the TML and INT models. Only two individual PDLA components (C1 and C2) are shown on this figure, since both O vi and N v are undetected in C3, C4, and C5 so the ratio N v/O vi is undefined in those components.
On Figure 7b, the average PDLA C iv/Si iv ratio also lies within the corrected range predicted by the INT and TML models, although the ratios in the five individual PDLA components show a large scatter around the average value. Only two of the five individual components show C iv/O vi and C iv/Si iv predictions that are both matched by the corrected INT prediction. The corrected TML model fares better, matching both ratios in four of the five PDLA components (all apart from C1, which may be photoionized; see §8.1).
The TML model of Kwak & Shelton (2010) also explains the absolute high-ion column densities, at least for three of the components: the maximum C iv column produced per mixing layer corrected to [C/O]=0.5 is log (C iv)=13.27, and we observe values in the five PDLA components of 12.40, 12.69, 12.78, 13.48, and 13.53. The final two columns are marginally higher than the TML model can explain. The absolute high-ion columns are harder to explain in the INT models of Gnat et al. (2010), which predict, when corrected to [C/O]=0.5, a maximum C iv column per interface of log (C iv)=12.48, lower than the C iv columns observed in all PDLA components except C1. Therefore, for the INT model to apply, unresolved multiple interfaces would have to exist within each component, in order to build up the observed C iv columns. Altogether, we conclude that the TML model is more successful.
It is instructive to compare the model-predicted ionic ratios to those measured in other DLAs. The average DLA high-ion ratios in the Fox et al. (2007a) sample, which consists of 12 DLAs with O vi, are shown as large blue points on Figure 7. These averages are successfully reproduced by both the corrected TML and the corrected INT predictions, although only just: the TML model cleanly reproduces the average DLA C iv/O vi ratio (0.25 in the log), but the average DLA C iv/Si iv ratio (0.73 in the log) is at the upper end of the TML prediction; conversely, the INT model explains the average C iv/Si iv ratio but the average C iv/O vi ratio is at the upper end of the INT prediction. Given the uncertainties involved in correcting the model predictions to the non-solar DLA abundance pattern, we judge these models to be fairly successful at reproducing the average DLA ionic ratios.
Based on the above discussion, we conclude that boundary layers are a viable explanation for the C iv and O vi absorption, both in this PDLA and in DLAs in general, and that turbulent mixing is the most successful of the models examined here, explaining the high-ion ratios in four of the five PDLA components. The boundary-layer explanation is supported by the finding that the average C iv/O vi and C iv/Si iv ratios observed in DLAs are similar to those measured in the disk, halo, and high-velocity clouds (HVCs) of the Milky Way (a DLA itself), where interfaces and turbulent mixing are widely invoked to explain the high ions (e.g. Savage et al. 1994, 2003; Spitzer 1996; Sembach et al. 2003; Collins et al. 2004, 2005; Fox et al. 2004, 2005; Lehner et al. 2011; Wakker et al. 2011), although inspection of Figure 7b shows that the Galactic disk and halo average C iv/Si iv ratios are marginally lower than the predictions of the solar-abundance TML and INT models shown. The DLA average N v/O vi ratio is at least 0.5 dex lower than the Galactic disk and halo average N v/O vi ratios, but this can be explained by the sub-solar N/O ratio present in DLAs, i.e. as an abundance effect (Fox et al. 2009).
The boundary-layer scenario, in which the high ions are cooling rather than photoionized, has other advantages: it explains the metallicity-independence of the strength of O vi absorption in galaxy halos (Heckman et al. 2002; Fox 2011), and fits naturally into the established picture of galaxy formation where cold streams pass through hot plasma, since boundary layers will naturally arise between the two phases. Indeed, in this picture, the O vi and C iv detections in DLAs indicate (without tracing directly) the presence of a hot (106 K) phase of surrounding plasma in the host galaxies. Such hot galactic coronae are predicted to arise by shock heating of gas falling into potential wells (hot-mode accretion; Rees & Ostriker 1977; Birnboim & Dekel 2003; Kereš et al. 2005, 2009), and by feedback from stellar activity (supernovae) within the galaxies themselves (e.g. Rasmussen et al. 2009; Crain et al. 2010; Henley et al. 2010). If this boundary layer scenario is correct, then the larger significance of O vi observations in DLAs at =2–3 would then be that feedback and/or hot-mode accretion are already active at this epoch and have created hot galactic coronae. Further studies of intervening DLAs where the high-ion ratios can be measured component-by-component, and where the ionizing radiation field and the influence of photoionization are expected to be lower, will confirm whether this picture is correct.
Finally, we note that neither the boundary-layer scenario nor the photoionization scenario explains the high-ion kinematics, which are considerably more extended than the low-ion kinematics, both in the PDLA and in DLAs in general (Wolfe & Prochaska 2000a; Fox et al. 2007b). This indicates that an energetic mechanism (e.g. a galactic wind or galaxy-galaxy encounter) has dispersed the high ions over a large velocity interval. Simulations of the high-ion velocity fields in DLAs are needed to investigate the nature of this mechanism.
9 Summary
In order to explore the processes that generate high-ion plasma in high-redshift galaxy halos, we have presented new VLT/UVES high-resolution observations of the PDLA at =2.47621 toward Q0841+129, focusing on the origin of the high-ion absorption. This system lies at 1 630 km s-1 from the background QSO, has log (H i)=20.800.10, a metallicity [Zn/H]=1.600.10, a low-ion velocity width =30 km s-1, and a hydrogen ionization fraction in the low-ion phase of 0.1–0.5 as determined from the Ar i/Si ii, Ar i/S ii, N ii/N i and Fe iii/Fe ii line ratios. The high ions in the PDLA show a multi-component structure; at least five C iv components are seen spanning a total velocity extent of 160 km s-1 with -values ranging from 8.81.8 km s-1 to 27.33.1 km s-1. Si iv is detected in three of these components; O vi is detected in two, and blended in the others.
The PDLA is (partly) shielded from the QSO’s ionizing radiation by an intrinsic sub-DLA at =2.50620, very close to the QSO emission-line redshift of =2.495100.00003. This filtering arrangement hardens the ionizing radiation field incident on the PDLA, allowing us to test whether photoionization (PI) is a viable origin mechanism. We find that a single-phase PI model at log can successfully explain one of the two components showing O vi (C1), so long as [C/O]=0.5, but no single-phase PI model is found for the other component showing O vi (C2), since the O vi in this component is a factor of four stronger than the model predicts. The C iv and Si iv profiles in C2, C3, and C4, are consistent with PI at log if [C/Si]=0.5. Single-phase collisional ionization models (equilibrium or non-equilibrium) are unable to reproduce the high-ion observations.
An alternative model, where the high ions trace the turbulent mixing layers between the warm DLA gas and a hot exterior medium (Kwak & Shelton 2010), can successfully reproduce the ionic ratios in four of the five components (C2, C3, C4, and C5). This model can also explain the average high-ion ratios C iv/O vi, N v/O vi, and C iv/Si iv observed in a larger sample of 12 DLAs. Turbulent mixing layers are often invoked (along with conductive interfaces) to explain high-ion observations in the halo of the Milky Way (itself a DLA). If correct, this model provides indirect evidence for the existence of a hot phase of coronal plasma in and around DLA galaxies. Further observations of high-ion absorption in individual intervening DLAs are needed to test this model.
Acknowledgements.
AJF acknowledges support from an ESO Fellowship, useful conversations with Bob Carswell, Paul Hewett, and Sara Ellison, and constructive comments from the anonymous referee. He is grateful to Kyujin Kwak for providing his Myr-by-Myr TML predictions, and to Bart Wakker for advice on CLOUDY models. PPJ and RS gratefully acknowledge support from the Indo-French Center for Promotion of Advanced Research (Center Franco-Indien pour la Promotion de la Recherche Avancée) under contract No. 4303.References
- Asplund et al. (2009) Asplund, M., Grevesse, N., Sauval, A. J., & Scott, P. 2009, ARA&A, 47, 481
- Ballester et al. (2000) Ballester, P., Modigliani, A., Boitquin, O., et al. 2000, The Messenger, 101, 31
- Begelman & Fabian (1990) Begelman, M. C., & Fabian, A. C. 1990, MNRAS, 244, 26
- Birnboim & Dekel (2003) Birnboim Y., Dekel A. 2003, MNRAS, 345, 349
- Böhringer & Hartquist (1987) Böhringer, H., & Hartquist, T. W. 1987, MNRAS, 228, 915
- Borkowski et al. (1990) Borkowski, K. J., Balbus, S. A., & Fristrom, C. C. 1990, ApJ, 355, 501
- Burles & Tytler (1996) Burles, S., & Tytler, D. 1996, ApJ, 460, 584
- Collins et al. (2004) Collins, J. A., Shull, J. M., & Giroux, M. L. 2004, ApJ, 605, 216
- Collins et al. (2005) Collins, J. A., Shull, J. M., & Giroux, M. L. 2005, ApJ, 623, 196
- Crain et al. (2010) Crain, R. A., McCarthy, I. G., Frenk, C. S., Theuns, T., & Schaye, J. 2010, MNRAS, 407, 1403
- Dall’Aglio et al. (2008) Dall’Aglio, A., Wisotzki, L., & Worseck, G. 2008, A&A, 491, 465
- Dekker et al. (2000) Dekker, H., D’Odorico, S., Kaufer, A., Delabre, B., & Kotzlowski, H. 2000, SPIE, 4008, 53
- Dessauges-Zavadsky et al. (2009) Dessauges-Zavadsky, M., Ellison, S. L., & Murphy, M. T. 2009, MNRAS, 396, L61
- Ellison et al. (2002) Ellison, S. L., Yan, L., Hook, I. M., et al. 2002, A&A, 383, 91
- Ellison et al. (2010) Ellison, S. L., Prochaska, J. X., Hennawi, J., et al. 2010, MNRAS, 406, 1435
- Ellison et al. (2011) Ellison, S. L., Prochaska, J. X., & Mendel, J. T. 2011, MNRAS, 412, 448
- Esquivel et al. (2006) Esquivel, A., Benjamin, R. A., Lazarian, A., Cho, J., Leitner, S. N. 2006, ApJ, 648, 1043
- Faucher-Giguère et al. (2009) Faucher-Giguère, C.-A., Lidz, A., Zaldarriaga, M., & Hernquist, L. 2009, ApJ, 703, 1416
- Ferland et al. (1998) Ferland, G. J., Korista, K. T., Verner., D. A., et al. 1998, PASP, 110, 761
- Fox et al. (2004) Fox, A. J., Savage, B. D., Wakker, B. P., Richter, P., Sembach, K. R., & Tripp, T. M. 2004, ApJ, 602, 738
- Fox et al. (2005) Fox, A. J., Savage, B. D., Wakker, B. P., Tripp, T. M., Sembach, K. R., & Bland-Hawthorn, J. 2005, ApJ, 630, 332
- Fox et al. (2007a) Fox, A. J., Petitjean, P., Ledoux, C., & Srianand, R. 2007a, A&A, 465, 171
- Fox et al. (2007b) Fox, A. J., Ledoux, C., Petitjean, P., & Srianand, R. 2007b, A&A, 473, 791
- Fox et al. (2007c) Fox, A. J., Petitjean, P., Ledoux, C., & Srianand, R. 2007c, ApJ, 668, L15
- Fox et al. (2009) Fox, A. J., Prochaska, J. X., Ledoux, C., et al. 2009, A&A, 503, 731
- Fox (2011) Fox, A. J. 2011, ApJ, 730, 58
- Frank et al. (2010) Frank, S., Mathur, S., Pieri, M., & York, D. G.. 2010, AJ, 140, 817
- Gnat & Sternberg (2007) Gnat, O., & Sternberg, A. 2007, ApJS, 168, 213
- Gnat et al. (2010) Gnat, O., Sternberg, A., & McKee, C. F. 2010, ApJ, 718, 1315
- Guimarães et al. (2007) Guimarães, R., Petitjean, P., Rollinde, E., et al. 2007, MNRAS, 377, 657
- Haardt & Madau (1996) Haardt, F., & Madau, P. 1996, ApJ, 461, 20
- Haardt & Madau (2001) Haardt, F. & Madau, P. 2001, 21st Moriond Astrophysics Meeting, Clusters of Galaxies and the High Redshift Universe Observed in X-rays, ed. D. M. Neumann & J. T. T. Van (Paris: ESA)
- Heckman et al. (2002) Heckman, T. M., Norman, C. A., Strickland, D. K., & Sembach, K. R. 2002, ApJ, 577, 691
- Henley et al. (2010) Henley, D. B., Shelton, R. L., Kwak, K., Joung, M. R., & Mac Low, M.-M. 2010, ApJ, 723, 935
- Hewett & Wild (2010) Hewett, P. C., & Wild, V. 2010, MNRAS, 405, 2302
- Howk & Sembach (1999) Howk, J. C., & Sembach, K. R. 1999, ApJ, 523, L141
- Jarosik et al. (2011) Jarosik, N., Bennett, C. L., Dunkley, J., et al. 2011, ApJS, 192, 14
- Kereš et al. (2005) Kereš, D., Katz, N., Weinberg, D. H., & Davé, R. 2005, MNRAS, 363, 2
- Kereš et al. (2009) Kereš, D., Katz N., Fardal, M., et al. 2009, MNRAS, 395, 160
- Kim et al. (1997) Kim, T.-S., Hu, E. M., Cowie, L. L., & Songaila, A. 1997, AJ, 114, 1
- Kwak & Shelton (2010) Kwak, K., & Shelton, R. L. 2010, ApJ, 719, 523
- Kwak et al. (2011) Kwak, K., Henley, D. B., & Shelton, R. L. 2011, ApJ, in press (arXiv:1106.6326)
- Kulkarni et al. (2007) Kulkarni, V. P., Khare, P., Péroux, C., et al. 2007, ApJ, 661, 88
- Ledoux et al. (2006) Ledoux, C., Petitjean, P., Fynbo, J. P. U., Møller, P., & Srianand, R. 2006, A&A, 457, 71
- Lehner & Howk (2007) Lehner, N., & Howk, J. C. 2007, MNRAS, 377, 687
- Lehner et al. (2008) Lehner, N., Howk, J. C., Prochaska, J. X., & Wolfe, A. M.. 2008, MNRAS, 390, 2
- Lehner et al. (2011) Lehner, N., Zech, W. F., Howk, J. C., & Savage, B. D. 2011, ApJ, 727, 46
- Lu et al. (1995) Lu, L., Savage, B. D., Tripp, T. M., & Meyer, D. M. 1995, ApJ, 447, 597
- Lu et al. (1996) Lu, L., Sargent, W. L. W., Barlow, T. A., Churchill, C. W., & Vogt, S. S. 1996, ApJS, 107, 475
- Maller et al. (2003) Maller, A. H., Prochaska, J. X., Somerville, R. S., & Primack, J. R. 2003, MNRAS, 343, 268
- Mo & Miralda-Escudé (1996) Mo, H. J., & Miralda-Escudé, J. 1996, ApJ, 469, 589
- Morton (2003) Morton, D. C. 2003, ApJS, 149, 205
- Petitjean et al. (2008) Petitjean, P., Ledoux, C., & Srianand, R. 2008, A&A, 480, 349
- Pettini et al. (1997) Pettini, M., Smith, L. J.; King, D. L., & Hunstead, R. W. 1997, ApJ, 486, 665
- Pettini et al. (2008) Pettini, M., Zych, B. J., Steidel, C. C., & Chaffee, F. H. 2008, MNRAS, 385, 2011
- Phillipps et al. (2002) Phillipps, S., Horleston, N. J., & White, A. C. 2002, MNRAS, 336, 587
- Prochaska & Wolfe (1997) Prochaska, J. X., & Wolfe, A. M. 1997, ApJ, 487, 73
- Prochaska et al. (2002) Prochaska, J. X., Howk, J. C., O’Meara, J. M., et al. 2002, ApJ, 571, 693
- Prochaska et al. (2008) Prochaska, J. X., Hennawi, J. F., & Herbert-Fort, S. 2008, ApJ, 675, 1002
- Rahmani et al. (2010) Rahmani, H., Srianand, R., Noterdaeme, P., & Petitjean, P. 2010, MNRAS, 409, L59
- Rasmussen et al. (2009) Rasmussen, J., Sommer-Larsen, J., Pedersen, K., et al. 2009, ApJ, 697, 79
- Rees & Ostriker (1977) Rees M. J., & Ostriker J. P., 1977, MNRAS, 179, 541
- Rix et al. (2007) Rix, S. A., Pettini, M., Steidel, C. C., et al. 2007, ApJ, 670, 15
- Russell et al. (2006) Russell, D. M., Ellison, S. L., & Benn, C. R. 2006, MNRAS, 367, 412
- Savage & Sembach (1991) Savage, B. D., & Sembach, K. R. 1991, ApJ, 379, 245
- Savage & Sembach (1994) Savage, B. D., & Sembach, K. R. 1994, ApJ, 434, 145
- Savage et al. (1994) Savage, B. D., Sembach, K. R., & Cardelli, J. A. 1994, ApJ, 420, 183
- Savage et al. (2003) Savage, B. D., et al. 2003, ApJS, 146, 125
- Schlegel et al. (1998) Schlegel, D. J., Finkbeiner, D. P., & Davis, M. 1998, ApJ, 500, 525
- Sembach et al. (2003) Sembach, K. R., et al. 2003, ApJS, 146, 165
- Simcoe et al. (2002) Simcoe, R. A., Sargent, W.., & Rauch, M. 2002, ApJ, 578, 737
- Slavin et al. (1993) Slavin, J. D., Shull, J. M., & Begelman, M. C. 1993, ApJ, 407, 83
- Sofia & Jenkins (1998) Sofia, U. J., & Jenkins, E. B. 1998, ApJ, 499, 951
- Spitzer (1996) Spitzer, L. 1996, ApJ, 458, L29
- Sutherland & Dopita (1993) Sutherland, R. S., & Dopita, M. A. 1993, ApJS, 88, 253
- Vanden Berk et al. (2001) Vanden Berk, D. E., Richards, G. T., Bauer, A., et al. 2001, AJ, 122, 549
- Vladilo et al. (2001) Vladilo, G., Centurión, M., Bonifacio, P., & Howk, J. C. 2001, ApJ, 557, 1007
- Wakker et al. (2011) Wakker, B. P., Savage, B. D., Fox, A. J., & Benjamin, R. A. 2011, ApJS, submitted
- Wolfe et al. (1986) Wolfe, A. M., Turnshek, D. A., Smith, H. E., & Cohen, R. D. 1986, ApJS, 61, 249
- Wolfe et al. (1994) Wolfe, A. M., Fan, X.-M., Tytler, D., et al. 1994, ApJ, 435, L101
- Wolfe et al. (2005) Wolfe, A. M., Gawiser, E., & Prochaska, J. X. 2005, ARA&A, 43, 861
- Wolfe & Prochaska (2000a) Wolfe. A. M., & Prochaska, J. X. 2000a, ApJ, 545, 591
- Wolfe & Prochaska (2000b) Wolfe, A. M., & Prochaska, J. X. 2000b, ApJ, 545, 603