The high-lying 6Li levels at excitation energy around 21 MeV
Abstract
The 3H+3He cluster structure in 6Li was investigated by the 3H(,3H 3He)n kinematically complete experiment at the incident energy = 67.2 MeV. We have observed two resonances at = 21.30 and 21.90 MeV which are consistent with the 3He(3H, )6Li analysis in the Ajzenberg-Selove compilation. Our data are compared with the previous experimental data and the RGM and CSRGM calculations.
1 Introduction
The study of three-body reactions, using the inclusive or bidimensional spectra, is a suitable way of obtaining information on the reaction dynamics and nuclear spectroscopy. The inclusive spectra frequently show a strong and continuous background from other states of the nucleus of interest, the decay of other nuclei produced in the competing reaction channels, and the statistical three-body break-up. The kinematically complete measurement provides a powerful way to study three-body resonances since these backgrounds are largely reduced.
The spectroscopic information on low-lying states in light nuclei is known with sufficient accuracy, while that on high-lying states is less known. Generally, these are unbound with short-life values, and thus their energy widths are significantly large. Therefore, it would be difficult to obtain their excitation energies with high accuracy.
The 6He and 6Li nuclei are of remarkable theoretical and experimental interest because they have cluster structures of alpha+2n and alpha+d, respectively. Particularly, for the 6He nucleus the core is an alpha and the halo consists of two neutrons (+2n structure), while for the 6Li nucleus the core is the same and the halo is a deuteron (+d structure). At higher excitation energies, other structures, like 3H+3H (t + t) for 6He and 3He+3H ( + t) for 6Li, have to be considered around their threshold energies of 12.203 and 15.795 MeV, respectively. Thus it is very interesting to investigate the high-lying 6He and 6Li cluster states in order to obtain their spectroscopic information.
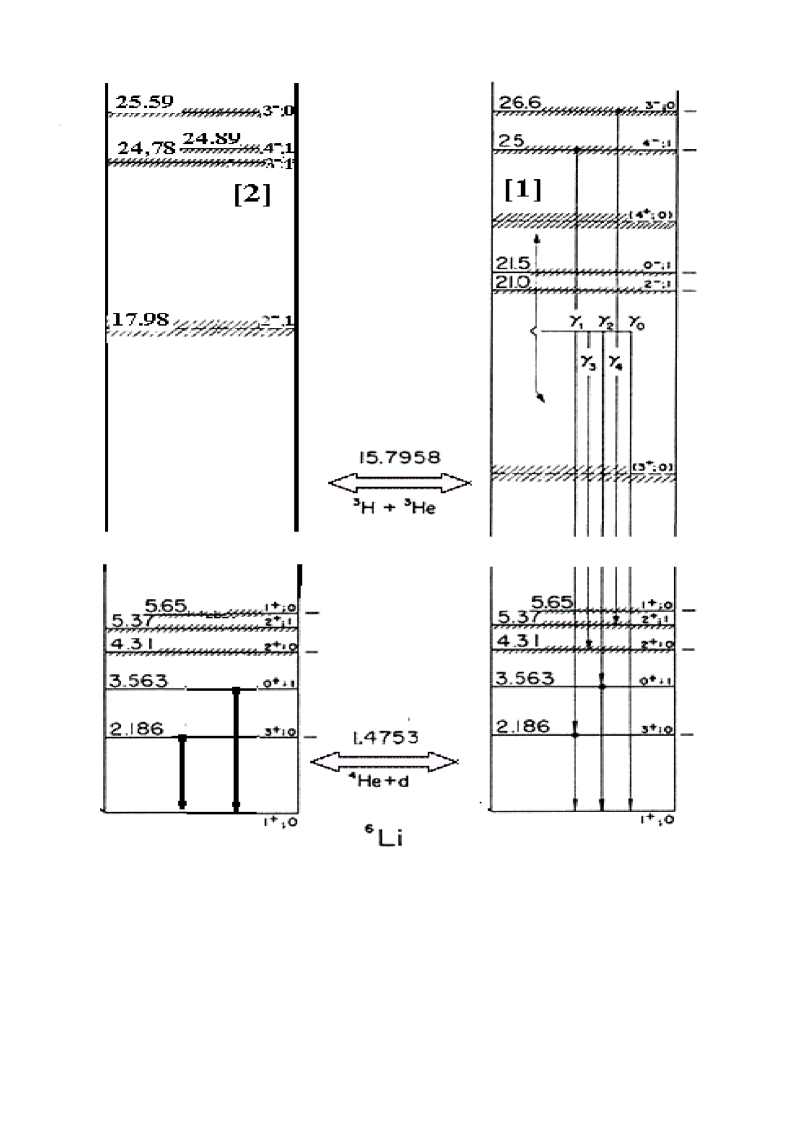
Fig. 1 represents the 6Li energy levels given by Ajzenberg-Selove[1] and Tilley et al.[2]. A significant discrepancy is found at excitation energies higher than the t+ decay threshold of = 15.795 MeV. It should be noted that short-life 6Li levels have been observed at = 18 and 22 MeV with = 5.0 0.5 and 8 1 MeV, respectively, in the recent 7Li(3He, )6Li study[3] at E(3He)=450 MeV.
Thompson and Tang[4] theoretically studied the existence of trinucleon ( and t) clusters in 6Li in the framework of the LS coupling analysis with the RGM calculations[4]. They have predicted a P doublet (1P1 and 3P0,1,2) and a F doublet (1F3 and 3F2,3,4) at 22 and 29 MeV, respectively. On the contrary, Vlastou et al. [5] have reported 3P2 , 3P0 , 3F4 and 3F3 states at = 21.0, 21.5, 25.7, and 26.7 MeV, respectively, from the analysis of the +t elastic scattering.
In this article, we report a kinematically complete 3H(,t)n experiment at the incident -particle energy of 67.2 MeV. This energy is sufficient to excite 6Li levels over the +t decay threshold of = 15.795 MeV, and thus the +t cluster states at about = 21 MeV can be investigated. In our experiment, we observed two resonances at = 21.30 and 21.90 MeV.
2 Experimental set-up
The 3H(,3He 3H)n experiment was carried out by a target made of titanium backing saturated with tritium. The thickness of the titanium backing was 2.6 mg/cm2. By considering the saturation of the tritium atoms in the lattice of the titanium atoms, we have that the ratio between the number of titanium atoms and the tritium one is approximately equal to 1. In these conditions the equivalent thickness of the tritium target is about 0.15 mg/cm2. Therefore the total thickness of the titanium backing and tritium target was about 2.75 mg/cm2. The target was bombarded with -particles at the isochronous cyclotron accelerator U-240 of the Institute for Nuclear Research in Kiev. The beam energy was determined to be = 67.20.4 MeV by using a technique developed to measure time and energy characteristics of the cyclotron beam [6].
We used a pair of E-E telescopes to detect t and in coincidence from the 3H(,t)n reaction. The first telescope was placed at left side and consisted of E(400 m thick totally depleted silicon surface barrier detector (SSD)) and E (NaI(Tl) with 20 mm 20 mmt) detectors, and the second one was placed at right side and consisted of E (90 m SSD) and E (Si(Li) with 3 mmt) detectors.The first telescope could detect tritons as well as protons and deuterons, and the second telescope could detect and particles together with protons, deuterons, and tritons of low energies. We recorded the E and E energy information and the time-of-flight difference between two telescopes. The coincidence events within about 100 ns were recorded by a CM 1420 computer.
Figs. 2(a) and (b) show the correlation between E and E for the first and second telescopes, respectively. It is seen that the t and particles from the 3H(,t)n reaction are clearly separated from other particles.
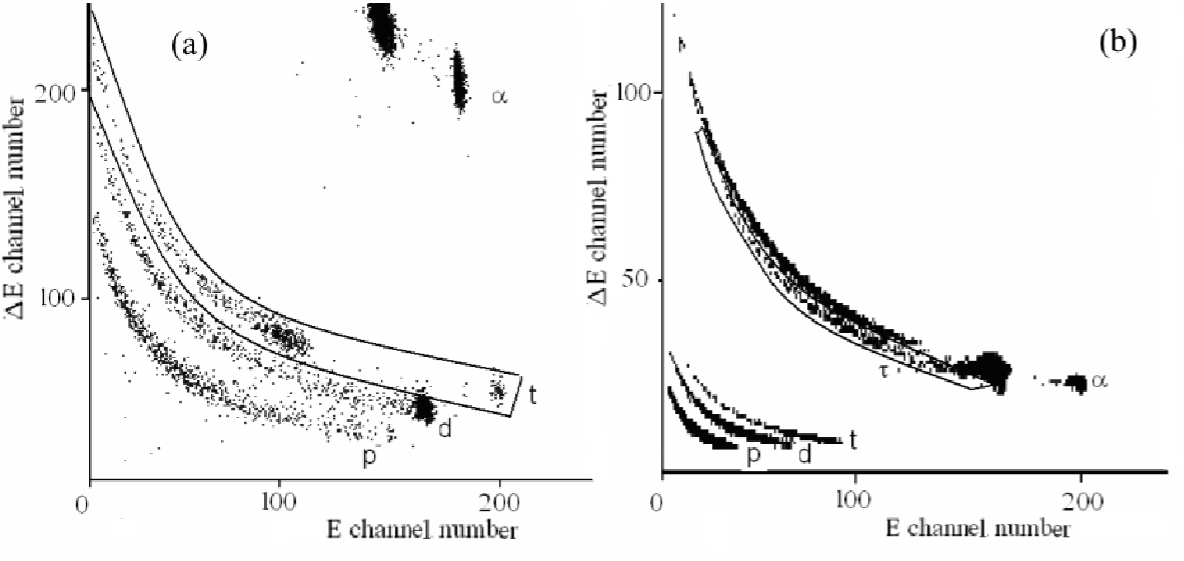
The left telescope is optimized for the detection of single-charge particles such as p, d, and t. The -particles are also measured only for 29 MeV since those with lower energies are stopped in the E detector. In Fig. 2 (a), high-energy -particles from the elastic scattering on Ti (backing) and 3H (target) form two peaks, but -particles of low-energy could not be seen. On the contrary, the right telescope is optimized for the detection of double-charge particles such as and . In Fig. 2 (b), the loci of p, d, and t are also seen but they are limited at low energies since those at high energies cannot be discriminated by the E counter. In the following, we express the total kinetic energy, E+E, as E for simplicity. For the calibration of the scintillator used as E-detector placed at the angle a special procedure based on the known Birks approach[7, 8, 9, 10] was applied. Following relation (1) of Ref. [7] for the specific fluorescence of a material to an ionizing particle of energy with specific energy loss , the scintillation response was obtained at large ionization energy losses () by expression
| (1) |
For the given inorganic scintillator NaI(Tl), at energies of one- and two-charged particles present in the spectrum of Fig. 2 (a), we obtained the calibration curves for the p, d, t, and particles (see Fig. 3).
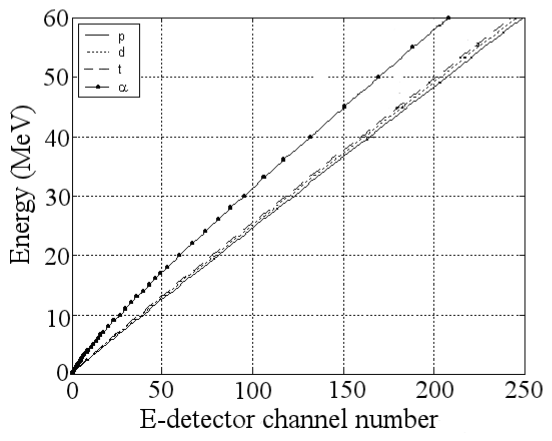
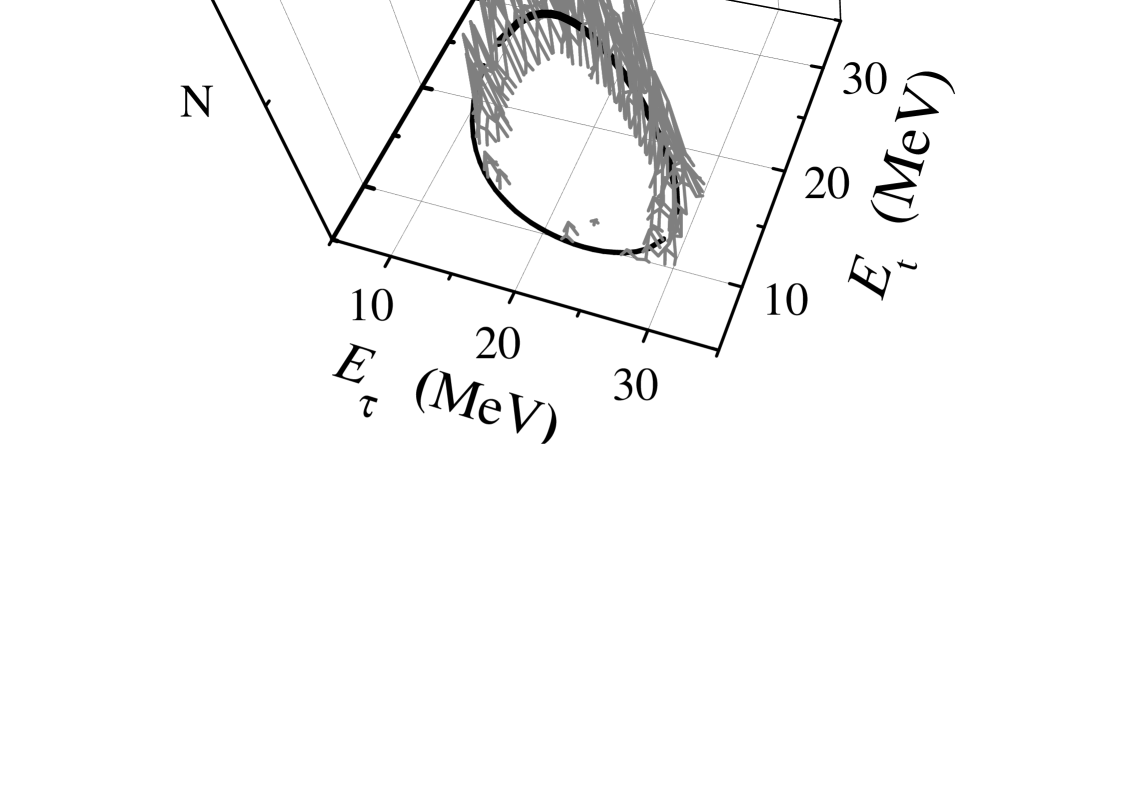
Fig. 4 (a) shows the +t coincidence yield as functions of both the helium-3 energy and the triton energy . The solid line represents the kinematical curve of the 3H(,t)n reaction in the present experimental condition.

In order to check the reliability of the present experiment, the experimental Q-values for the 3-body reaction were deduced by using the momentum and energy conservations [11]:
| (2) | |||||
| (3) |
where and are the momenta and energies of outgoing particles, respectively, while and are the momentum and energy of the incident -particle, respectively. Eq. (2) can be used to calculate the momentum and energy of the undetected neutron, and then eq. (3) allows to determine the -value as - ( + + . Taking into account the detector resolution, beam resolution, energy straggling in the target, effect of differential target thickness, kinematic changing from beam spot size and beam divergence, we obtain the experimental -value peak of -20.61 MeV for the distribution (while the theoretical -value is -20.58 MeV ) and the FWHM value of about 1.33 MeV (see Fig. 4(b)) with a standard deviation of 0.56 MeV for the fit by a Gaussian function. This result shows the good agreement between measurements and calculation.
3 Analysis and results
The obtained two-dimensional (,) spectra contain information on several reaction channels including the formation of 6Li∗. The formation of three particles, + t + n, in nuclear reactions is assumed as a sum of following contributions:
| (4) | |||||
| (5) | |||||
| (6) | |||||
| (7) | |||||
| (8) |
where the processes (4-6) are the mechanisms of the subsequent decays, in which firstly unbound states of 4H∗, 6Li∗ and 4He∗ are formed and then these unbound states decay into the corresponding pairs of clusters. The process (7) is the quasifree +t scattering in which the 3He-particle comes from the virtual decay of +n. The last process (8) is the statistical three-body decay. The contribution from each process depends on the kinematics of the three-particle reaction. Therefore, the two-dimensional spectra obtained for different geometric conditions of the -t coincidence were analyzed in order to find the best condition in which the 6Li∗ states with +t cluster structure are significantly excited whereas the 4H and 4He resonance contributions are absent or are not overlapped with the ones of . The triton and -particle detection angles are = -21∘ (left side) and = +20∘ (right side), respectively.
The typical kinematic loci of the three-body reaction products, obtained by using the conservation laws expressed by equations (2) and (3), is presented in Fig. 4(a) (also including the yields of the coincidence events) and in Fig. 5 (a) (the map of the two-dimensional three-body kinematic curve in the ( , ) – plane). In general cases, for each energy value correspond two real energy values, and the complete set of results covers the upper and lower branches of the ( , ) – kinematic events. These upper and lower loci are separated by two vertical lines (see Fig. 5 (a)) to which for each energy value corresponds two real and coincident solutions of the energy value.
Moreover, among the various detection geometries, we have selected the one in which the relative kinetic energy has a smooth slope as a function of . This is a useful choice in order to determine the excitation energies of 6Li* with high accuracy. Unfortunately, due to the limited range of = 5.4–6.9 MeV (see Figs. 5 (b) and 6), the explored 6Li* excitation energies are limited between = 21 and 23 MeV.Therefore, in the present experiment, the peak energies of 6Li* can be deduced with E 0.4 MeV whereas their width would be underestimated.
In the present paper we compare the experimental spectra with the simulation obtained by the Monte Carlo method. A three-body P(T,ab)c reaction is realized by using a set of random numbers suitable to obtain the a+b coincidence. In calculation we take into account for the value of the beam energy and its dispersion, the thickness of the target, the energy loss in target, the size of the spot beam on the target, the target-detector distances and their energy resolutions.
To analyze the experimental data coming from the 3H(,t)n reaction we should project the upper and lower loci of the kinematic curves onto the and energy axes. This procedure is made by recalculating the t bidimensional spectra of the considered reaction by using the Monte Carlo method, as described in Ref.[12], and projecting the spectra onto the or Et axis with the consequently discontinuity due to the average of many values of a numerous set of random numbers.
The selected (, ) bidimensional spectra, obtained for the incident energy of 67.2 MeV and detectors placed at = +20∘ and = - 21∘, were divided in upper and lower branches (see Fig.5(a)) by using the above-mentioned method, and the upper branch of this locus is projected onto the energy axis (see Fig. 6). Moreover, Figs. 5(b) and 6 show the relative kinetic energies of the -t, -n and t-n pairs of particles versus the energy. In these figures it is evident that the trend of the function is almost constant with little fluctuation.

The complete projection onto the axis of events populating the upper branch of the kinematic curve is shown in Fig. 6. It is possible to observe the presence of five well resolved peaks due to the formation and decay of excited states of 4He∗ and 6Li∗ nuclei. The error bars take into account the statistical error while the finite energy resolution of the energy determination was 0.4 MeV. In order to avoid the overloading of the figure we do not include the horizontal error bars concerning the uncertainty of the energy. In this figure, the first peak is due the contribution of 4He∗, and the other four peaks are assumed to be due to the contributions of 6Li∗.
In order to obtain the excitation energies and widths of 6Li∗, we performed a fitting with a Breight-Wigner formalism:
| (9) |
where , and are the amplitude, the peak energy and width of the resonance (=1,2), and is the phase space factor. The and values were calculated by the Monte-Carlo method by taking into account for the present experimental conditions. The dotted and dash-dotted lines represent the fits to the individual resonances while the solid line shows the sum of fitting. The peak energies are determined to be = 5.51 and 6.11 MeV. The the excitation energies of 6Li∗ can be obtained by with the threshold energy of =15.79 MeV. Therefore we obtained two pairs of spectroscopic parameters: = 21.30 MeV with = 0.3 MeV and = 21.90 0.40 MeV with = 0.4 0.2 MeV. The low error bars of and determinations are smaller than the corresponding upper bars to cause of the much limited extension of the lower relative energy values (5.4 MeV) in comparison to the larger extension of the upper values (6.9 MeV). Moreover, the measured 6Li∗ level widths are narrow and our results are, in any cases, lower than 0.6 MeV. This occurs because our experimental arrangement relatively to the investigated 6Li∗ levels allowed us to analyze only contributions coming from excitation energies around the peak values. However, the two above-mentioned 6Li∗ levels exist and decay into and t clusters. Moreover, in the = 9-15 MeV energy range of the projection of the upper branch, where the 4He∗ decay in the -n system appears, we extract the spectroscopic characteristics of the second and third excited levels ( (4He∗) with the respective width values). In Fig. 6 these excited 4He∗ states appear at the relative kinetic energies of the -n system of 0.45 and 1.25 MeV, respectively. The thin solid line at energies included in the above-mentioned energy range represents the whole contribution of the two excited 4He∗ states obtained by using the formalism (9). These two contributions of the unbound 4He∗ states are represented by the dotted and dash-dotted lines. Therefore, the obtained spectroscopic parameters of the second and third 4He∗ excited states, by considering the threshold of 20.60 MeV for the 4He∗ in the +n system, are = 21.05 0.10 MeV with width = 0.45 0.15 MeV, and = 21.85 0.10 MeV with width = 0.85 0.25 MeV, respectively. These results are in agreement with the values reported by Tilley et al.[13] in their compilation of the characteristics of nuclei with A = 4.
In order to explore if in the experimental spectrum of Fig. 6 there are also present contributions of 4H resonant states we also report in the figure the relative energies (thin dash-double dotted line) of the t+n system. Considering that the energy threshold of the t+n system formation is placed at 21.108 MeV of the 4H excitation energy and that the line of the relative energy includes the interval between 0 and 4.9 MeV, only the high 4H excited levels at 24.30, 24.61 and 27.13 MeV can populate the above-mentioned energy range at the 3.19, 3.50, and 5.27 MeV values, respectively. In the case of the 27.13 MeV excited state of 4H, the relative energy of 5.27 MeV overcomes the maximum value of 4.9 MeV reached for the relative energy and then only the spectrum tail of such an excited 4H is accessible in our explored energy range. The figure shows that the 3.19, 3.50, and 4.9 MeV of the relative energies correspond to the energy values of 23.1, 22.0 and 14.8 MeV, respectively, along the abscissa axis. As one can see, the experimental data of the total spectrum at these energy values correspond to relative minimums. Therefore, we can state that in our experiment the possible 4H high resonant state do not give meaningful contributions to the total recorded events which can belong to the reaction mechanism (4), along the explored 3-body kinematic curve in ( , in the ) - plane.
Moreover, Nakayama et al.[3], by the investigation of the 7Li(3He,) reaction forming 6Li, found two resonant -t excited states at = 18 0.5 MeV with the width of 8 1 MeV and = 22 1 MeV with the width of 5 1 MeV. These excited states were ascribed to the wide 6Li resonance at of about 21 MeV[3, 14]. By the angular correlation analysis Nakayama et al.[3] assigned both of the excited states at = 18 and 22 MeV to the spectroscopic characteristics 1P and 3P states, respectively. Therefore, the wide 6Li resonance is due to the overlapping of the two above-mentioned excited states. In the present work we did not produce angular correlation and however we assumed that our found excited states at 21.3 and 21.9 MeV are P states following the RGM calculation of Thompson and Tang[4] and in agreement with the results and considerations of Nakayama et al.[3], Akimune et al.[14] and Yamagata et al.[15]. In addition, for a completeness of information we also report that such assignments are different from results obtained by the Mondragon and Hernandez paper[16], and the CSRGM calculations of Ohkura et al.[17].
In our experiment we find with enough precision two nearly 6Li levels characterized by two excited states at = 21.30 and 21.90 MeV. Actually, among the above-mentioned results concerning the parameters of high-lying 6Li∗ levels there are some discrepancy. Therefore, other measurements, calculation and comparison with the known characteristics of the He, Li and Be isobar nuclei, with A = 6, have still to be made in the next future. Moreover, in the present investigation we have also observed the decay of high 4He∗ excited states while the contributions coming from the 4H∗ excited states were absent.
Our results on the two very near investigated 6Li levels are consistent with the values of levels present in the Aizenberg- Selove compilation[1].
4 Conclusion
We performed a kinematically complete experiment for the 3H(,t)n reaction at the incident energy of 67.2 MeV. The high-lying 6Li∗ states with the -t cluster structure have been investigated in the =21-23 MeV excitation energy range. Two resonances at excitation energies of = 21.30 MeV (with = 0.3 ) and = 21.90 0.40 MeV (with = 0.4 0.2) have been identified. The results of these peak energies are consistent with both the theoretical calculation considering the cluster structure[4] of 6Li∗ and the result for the analysis of the +t elastic scattering [1]. However, the results are inconsistent with the ones obtained by the recent investigation on the 7Li(3He,)6Li reaction which reports a wider separation between the two corresponding excited levels of about 4 MeV. Therefore, further experimental studies as well as more detailed theoretical analyses are needed to resolve the discrepancies.
Acknowledgment
This work was supported by the National Academy of Science of Ukraine. The Italian authors would like to thank the Institute for Nuclear Research in Kiev for the fruitful cooperation.
References
- [1] F. Ajzenberg-Selove.: Nucl. Phys. A 413 (1984) 1.
- [2] D.R. Tilley, C.M. Cheves, J.L. Godwin, G.M. Hale, H.M. Hofmann, J.H. Kelley, C.G. Sheu and H.R. Weller: Nucl. Phys. A 708 (2002) 3.
- [3] S. Nakayama, T. Yamagata, H. Akimune, M. Fujiwara, K. Fushimi, M.B. Greenfield, K. Hara, K.J. Hara, H. Hashimoto, K. Ichihara, K. Kawase, H. Matsui, K. Nakanishi, M. Sakawa, M. Tanaka and M. Yosoi: Phys. Rev. C 69 (2004) 041304.
- [4] D.R. Thompson and Y.C. Tang: Phys. Rev. Lett. 19 (1967) 87.
- [5] R. Vlastou, J.B.A. England, O. Karban and S. Baird: Nucl. Phys. A 292 (1977) 29.
- [6] V. Zerkin, V. Konfederatenko, O.M. Povoroznyk, B.G.Struzho, and A.M.Shydlyk: Kiev 1991. Prepr. INR, Academy of Sciences of Ukraine, 91-11, in Ukrainian
- [7] J.B. Birks: Phys. Rev. 84 (1951) 364.
- [8] J.B. Birks: Proc. Phys. Soc. A 64 (1951) 874.
- [9] J.B. Birks: IRE Tran. Nucl. Sci. NS 7 (1960) 2.
- [10] O.K. Gorpinich, O.M. Povoroznyk, O.O. Jachmenjov: Scientific papers of the Institute for nuclear research Kiev 2002. N° 1(7), p. 163-169, in Ukrainian
- [11] W.D.M.Rae, A.J.Cole, B.G.Harvey, R.G.Stokstad: Phys. Rev. C 30 (1984) 158.
- [12] O.M. Povoroznyk. Nuclear Physics and Atomic Energy. Kiev 2007. N° 2(20), p. 131-139, in Ukrainian
- [13] D.R. Tilley, H.R. Weller and G.M. Hale. Nucl: Phys. A 541 (1992) 157.
- [14] H. Akimune, T.Yamagata, S. Nakayama, Y. Arimoto, M. Fujiwara, K. Fushimi, K. Hara, M. Ohta, A. Shiokawa, M.Tanaka, H. Utsunomiya, K.J. Hara, H.P. Yoshida and M. Yosoi: Phys. Rev. C 67 (2003) 051302(R).
- [15] T.Yamagata, H. Akimune, S. Nakayama et al.: Phys. Rev. C 71 (2005) 064316.
- [16] A. Mondragon and H. Hernandez: Phys. Rev.C 41 (1990) 1975.
- [17] H. Ohkura, T. Yamada and K. Ikeda: Prog. Theor. Phys. 94 (1995) 47.