Variability of C III and Si III lines in the ultraviolet
spectral region
of the magnetic Bp star a Centauri
Sokolov N.A.
Central Astronomical Observatory at Pulkovo, St. Petersburg 196140, Russia
E-mail: n_ sokolov58@mail.ru
Abstract
The variability of twice ionized lines of carbon and silicon in the ultraviolet spectral region of the magnetic Bp star Centauri is investigated. This study is based on the archival International Ultraviolet Explorer data obtained through the large aperture and in the low-dispersion mode. A comparison of the average high-dispersion spectrum of Cen with full synthetic spectrum as well as those including only lines of one element showed that six C iii and six Si iii lines are responsible for the depressions of the flux at 1175.5 and 1300 Å, respectively. Investigation of the variability of flux in the core of depression at 1775.5 Å indicate that the fluxes do not vary within errors of measurements. On the other hand, the fluxes in the core of depression at 1300 Å varies significantly with amplitude of 0.2 mag. Moreover, the variability of this depression are in anti-phase with helium lines in the visual spectral region.
1 Introduction
Centauri (HD 125823, HR 5378, V761 Cen) belongs to the Si-subclass. The star is a striking helium variable, ranging in helium spectral type from B2 to B8 with a period of 8.81 d (Jaschek et al., 1968). Norris (1968) found that the He i 4471 varies from 300 to 2200 mÅ and the changes are so conspicuous that Cen can be considered a He-weak star at one extremum He-rich at the other one. In detailed study of this star Norris (1971) showed the equivalent widths of all neutral helium lines have similar extreme variations. On the other hand, the metallic lines show a very little or no changes of their intensity. In particular, the lines of Si ii show no variation, while the lines of Si iii show the variation in anti-phase with respect to the helium lines.
Our goal is to investigate the variability of C iii and Si iii lines in the ultraviolet spectral region using low-dispersion spectra which are presented in the Newly Extracted Spectra (INES) database from the satellite.
2 Observational data and analysis
The series of spectra of Cen obtained with Short Wavelength Prime (SWP) camera was received from the INES archive. In all cases, the spectra were obtained through the large aperture (9.5” x 22”) and in the low-dispersion mode ( 6 Å). All SWP spectra were obtained with exposure time 2.148 second. Finally, 13 SWP spectra were investigated and distributed quite smoothly over the period of rotation. Additionally, three spectra (SWP 14071, SWP 14080, SWP 14088) obtained in May 1981 were received from the INES archive. These spectra were obtained through the large aperture in the high-dispersion mode. In our study we used them only for identification of the observed depressions in the spectrum of Cen.
To analyze the spectra of Cen the linearized least-squares method was used. An attempt was made to describe the light curves in a quantitative way by adjusting a Fourier series. Based on the fact that the light variations of Cen are well approximate by single-wave (Catalano & Leone, 1996), we used for each light curve a least square fit with a function of the type:
| (1) |
where is a flux for the given , = - and = 2/. The and are zero epoch and rotational period of the ephemeris, respectively. The coefficients of the fitted curves define the average distribution of energy over the cycle of the variability while the coefficients define the semi-amplitude of the flux variations for the given .
In order to minimize the uncertainties in the coefficients of the fitted curves, the light curves were determined by averaging three nearest fluxes for a given :
| (2) |
where is equal 1.676 Å for SWP camera. As far as the errors in are concerned, we computed them by taking into account the the errors in the fluxes as presented in INES , according to the standard propagation theory of errors.
3 Identification of of C III and Si III depressions in spectrum of Cen
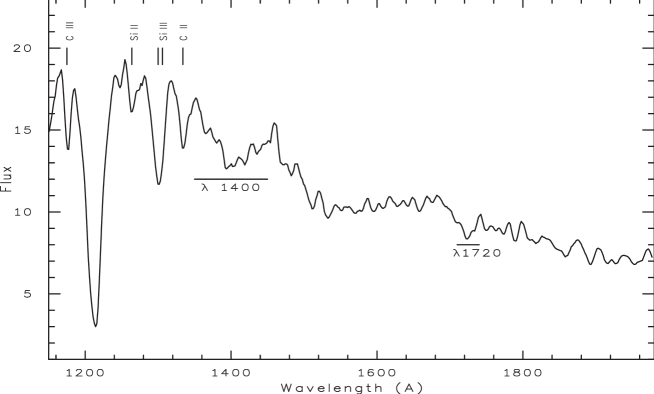
Figure 1 displays the average distribution of energy of Cen over the cycle of the variability in the spectral region from 1150 to 1950 Å. One can see from Fig. 1 that the deepest depressions of the flux are in the far-UV spectral region at 1175.5, 1265, 1300 and 1335 Å. It is well known that Si ii appears as the main absorber with the strong resonance lines at 1260 – 64 Å (Artru & Lanz, 1987) On the other hand, the depression at 1335 Å appear from C ii resonance doublet at 1334.5 – 1335.7 Å in the spectrum of Cen.
In order to identify which elements are responsible for depressions at 1175.5 and 1300 Å the synthetic single-element spectra were calculated for C, Si and Fe with Piskunov (1992) program synth. Mainly, the lines of these elements dominate in the far-UV spectral region of Cen. Also, the synthetic spectra with all elements included were computed. The information about spectral lines were taken from the Vienna Atomic Line Database (VALD-2, Kupka et al., 1999). Note that VALD-2 allows to compute the synthetic spectrum for stars with abundances significantly different from the solar or scaled solar composition. The adopted atmospheric parameters of Cen are the same as were used by Bohlender et al. (2010). The model computation was performed with = 19000 K, log = 4.0 and = 2 km . Experience showed that the spectral lines of twice ionized carbon and silicon mainly produce the deepest depressions at 1175.5 and 1300 Å, respectively.
| Depression | Ion | Wavelength | E. P. | |
| (Å) | (Å) | (eV) | ||
| C iii | 1174.930 | 6.496 | -0.468 | |
| C iii | 1175.260 | 6.493 | -0.565 | |
| 1175.5 | C iii | 1175.590 | 6.496 | -0.690 |
| C iii | 1175.710 | 6.503 | 0.009 | |
| C iii | 1175.987 | 6.496 | -0.565 | |
| C iii | 1176.370 | 6.503 | -0.468 | |
| Si iii | 1294.545 | 6.553 | -0.037 | |
| Si iii | 1296.726 | 6.537 | -0.127 | |
| Si iii | 1298.892 | 6.553 | -0.257 | |
| 1300.0 | Si iii | 1301.149 | 6.553 | -0.127 |
| Si iii | 1303.323 | 6.585 | -0.037 | |
| Si ii | 1304.370 | 0.000 | -0.423 | |
| Si ii | 1309.276 | 0.036 | -0.123 | |
| Si iii | 1312.591 | 10.276 | -0.840 |
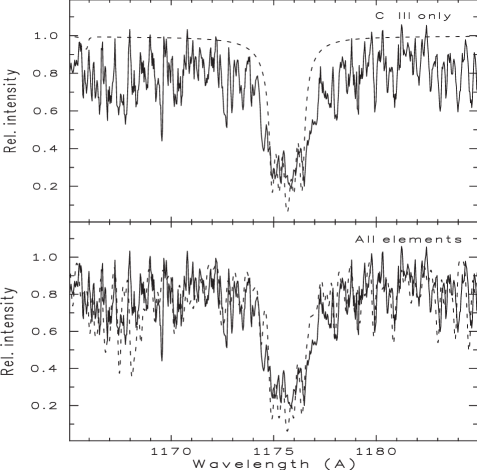
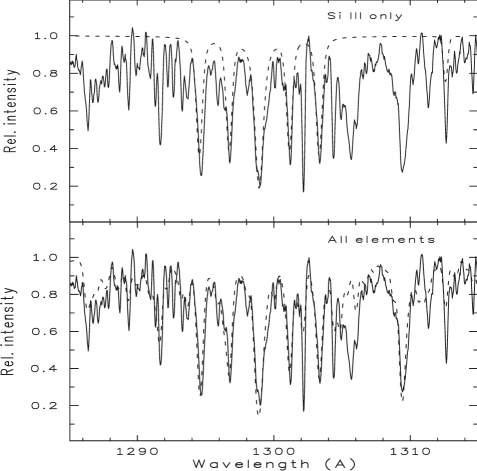
In order to confirm our hypothesis, the average high-dispersion spectrum was computed using images SWP 14071, SWP 14080 and SWP 14088 which were obtained at phases 0.296, 0.393 and 0.509, respectively. For all depressions the best agreement between the average high-dispersion spectrum of Cen and the synthetic spectra with all elements is reached if the elements have solar scaled composition except for C and Si, their abundances were reduced to of –4.0 and –5.0, respectively. A comparison of the average high-dispersion spectrum of Cen with full synthetic spectrum as well as those including only lines of C iii shows that this element is responsible for the depression of the flux at 1175.5 Å (see Fig. 2). Practically, six C iii lines are responsible for depression of the flux at 1175.5 Å. On the other hand, Si iii appears as the main absorber by the six strong resonance lines near 1300 Å. Although, there is the some influence on this depression by Si ii resonance doublet at 1304 – 1309 Å. The list of these spectral lines are given in Table 1.
3 Results
To measure the absorption in the cores of the depressions at 1175.5 and 1300 Å we have formed the photometric indices and , expressed in magnitudes:
| (3) | |||
| (4) |
where all filters are 5 Å wide for the and the indices. These indices are analogous to the index of Shore & Brown (1987). The choice of the filter wavelengths was dictated by the low-dispersion IUE spectra of Cen, although the average high-dispersion spectrum indicate that some filters can be affected by small spectral lines, as is illustrated by Fig. 2.
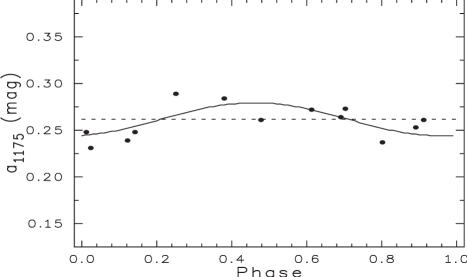
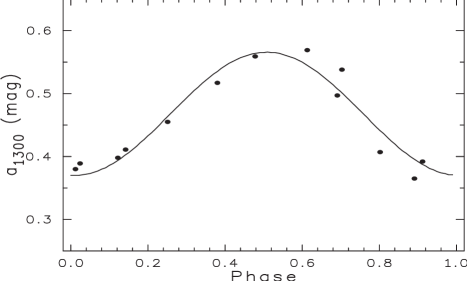
Figure 3 exhibits the variations of the measured absorption in the depressions at 1175 and 1300 Å versus the rotational phase. The solid lines represent least-squares fits by one-frequency cosine functions. It should be noted that the phases were computed according to the new determinations of the ephemeris obtained by Sokolov (2011). First of all, the least-square fit gives the semi-amplitude of the index which is equal to 0.018 mag. But, the standard deviation of the residual scatter around the fitted curve is equal to 0.014 mag. In other words, the photometric index does not vary within errors of measurements, as is illustrated by Fig. 3. On the other hand, the photometric index varies significantly. Thus, the least-square fit gives the semi-amplitude of the index which is equal to 0.098 mag. Although, the standard deviation of the residual scatter around the fitted curve is equal only 0.023 mag.
For the first time, Norris (1971) has noted that the lines of N ii, Si iii and Fe iii vary at anti-phase with helium lines. Most significant is the fact that while Si iii 4552 varies by 50 mÅ, the line Si ii 4130 does not vary at all. Our result also indicates that Si iii lines centered on 1300 Å in the ultraviolet spectral region vary at anti-phase with helium lines in the visual spectral region. It should be noted that Si iii lines centered on 1300 Å varies much more than Si iii line 4552 in the visual spectral region. In conclusion, an additional investigation is needed in order to do a final conclusion about the variability of Cen in the ultraviolet spectral region.
References
- Artru & Lanz (1987) Artru M.-C., Lanz T., 1987, A&A, 182, 273
- Bohlender et al. (2010) Bohlender D.A., Rice J.B., Hechler P., 2010, A&A, 520, A44
- Catalano & Leone (1996) Catalano F.A., Leone F., 1996, A&A, 311, 230
- Jaschek et al. (1968) Jaschek M., Jaschek C., Kucewicz B., 1968, Nature, 219, 1137
- Kupka et al. (1999) Kupka F., Piskunov N., Ryabchikova T.A., Stempels H.C., Weiss W.W., 1999, A&AS, 138, 119
- Norris (1968) Norris J., 1968, Nature, 219, 1342
- Norris (1971) Norris J., 1971, ApSJ, 23, 235
- Piskunov (1992) Piskunov N.E., 1992, in Glagolevskij Yu.V., Romanyuk I.I., eds, Stellar Magnetism. Nauka, St. Petersburg, p.92
- Shore & Brown (1987) Shore S.N., Brown D.N., 1987, A&A, 184, 219
- Sokolov (2011) Sokolov N.A., 2011, MNRAS, in preparation