Chemical abundances in the protoplanetary disk LV 2 (Orion) – II: High dispersion VLT observations and microjet properties††thanks: Based on observations made with ESO telescopes at the Paranal Observatory under programme 078.C-0247(A).
Abstract
Integral field spectroscopy of the LV 2 proplyd is presented taken with the VLT/FLAMES Argus array at an angular resolution of 0.310.31 arcsec2 and velocity resolutions down to 2 km s-1 per pixel. Following subtraction of the local M42 emission, the spectrum of LV 2 is isolated from the surrounding nebula. We measured the heliocentric velocities and widths of a number of lines detected in the intrinsic spectrum of the proplyd, as well as in the adjacent Orion nebula falling within a 6.6 4.2 arcsec2 field of view. It is found that far-UV to optical collisional lines with critical densities, , ranging from 103 to 109 cm-3 suffer collisional de-excitation near the rest velocity of the proplyd correlating tightly with their critical densities. Lines of low are suppressed the most. The bipolar jet arising from LV 2 is spectrally and spatially well-detected in several emission lines. We compute the [O iii] electron temperature profile across LV 2 in velocity space and measure steep temperature variations associated with the red-shifted lobe of the jet, possibly being due to a shock discontinuity. From the velocity-resolved analysis the ionized gas near the rest frame of LV 2 has 9200 800 K and 106 cm-3, while the red-shifted jet lobe has 9000 – 104 K and 106 – 107 cm-3. The jet flow is highly ionized but contains dense semi-neutral clumps emitting neutral oxygen lines. The abundances of N+, O2+, Ne2+, Fe2+, S+, and S2+are measured for the strong red-shifted jet lobe. Iron in the core of LV 2 is depleted by 2.54 dex with respect to solar as a result of sedimentation on dust, whereas the efficient destruction of dust grains in the fast microjet raises its Fe abundance to at least 30 per cent solar. Sulphur does not show evidence of significant depletion on dust, but its abundance both in the core and the jet is only about half solar.
keywords:
ISM – abundances; HII regions; ISM: individual objects – (LV2, 167-317, Orion Nebula); stars: pre-main-sequence; protostars; planets and satellites: protoplanetary disks1 Introduction
Protoplanetary disks (proplyds) provided the first evidence of gaseous dusty disks around young stars in the early 1990s. The archetypal proplyds found in the Orion nebula (M42; O’Dell et al. 1993) are dense semi-ionized objects photoevaporated to various degrees depending on their distance from the ionizing Trapezium cluster. They are landmark objects in the study of how circumstellar disks and eventually planetary systems form (e.g. O’Dell 2001). They are a unique environment for the study of disk formation and evolution in areas dominated by massive OB-type stars. Massive stellar clusters and their associated H ii regions, such as in the Orion OB1 association, are thought to represent the closest analogs to the birth environment of our Solar System (Adams 2010). The proplyds of Orion should therefore be ideal laboratories for the study of our planetary system’s origins. At optical wavelengths proplyds present a photoionized skin facing the ionizing cluster, giving way to a dusty envelope often shaped into comet-shaped outflows. The elemental content and chemistry of proplyds are very poorly known, however, (i) the composition of planet-forming circumstellar envelopes is of great topical interest given the established positive correlation between host star metallicity and the incidence of giant planetary companions (e.g. Gonzalez 1997; Neves et al. 2009); (ii) higher metallicity in the protoplanetary disk favours the formation of giant planets in the ‘core accretion’ scenario (e.g. Boss 2010). While the previously discrepant abundances for the interstellar medium and main-sequence stars in Orion are beginning to converge (Simón-Diaz & Stasinska 2011), proplyds are the last major component of Orion for which a chemical abundance scale is lacking.
We have been taking steps to rectify this situation with a programme targeting a sample of bright proplyds in M42. In Tsamis et al. (2011; Paper I hereafter) a chemical abundance study of the protoplanetary disk LV 2 (Laques & Vidal 1979) and its Orion nebula host vicinity was presented, based on the analysis of VLT optical integral field spectroscopy and HST FOS single aperture ultraviolet to far-red spectroscopy. From an emission-line analysis the abundances of several elements were measured for the proplyd and the local M42 nebular field. LV 2 was found to be slightly overabundant in carbon, oxygen and neon compared to the Orion nebula gas-phase composition and to the Sun. The carbon, oxygen and neon abundances in LV 2 were measured to be 0.2–0.3 dex higher than those in B-type stars of the Ori OB1 association studied by Simón-Diaz (2010) and Simón-Diaz & Stasinska (2011).
That result constitutes a direct measure of the metallicity of gas photo-evaporated from circumstellar disk material where planet formation may be underway.
In this paper, we present higher velocity dispersion integral field spectra of LV 2 which enable a physical analysis of its fast microjet to be undertaken. The paper is organized as follows. The dataset specifications and reduction method are outlined in Section 2. The analysis and results are presented in Section 3, followed by our conclusions in Section 4.
2 Observations and reductions
| Date | -range | Grating | / | Exp. time |
|---|---|---|---|---|
| (UT) | (Å) | (sec) | ||
| 2006/10/08 | 6383–6626 | H14B | 46 000 | 3139 |
| 2006/12/30 | 3700–3867 | HR1 | 36 000 | 3188 |
| 2006/10/10 | 4033–4201 | HR3 | 39 000 | 3185 |
| 2006/12/30 | 4033–4201 | HR3 | 39 000 | 3185 |
| 2007/01/09 | 4188–4392 | HR4 | 32 500 | 3296 |
| 2007/01/09 | 4538–4759 | HR6 | 32 500 | 3225 |
| 2007/01/09 | 4917–5163 | HR8 | 32 000 | 3130 |
- a
-
The Argus array was centered at (RA, Dec)JD2000 (05h35m16.857s, 05∘23′15.03′′) at a position angle of 80 deg.
Integral field spectroscopy of LV 2 was performed on the 8.2-m VLT/UT2 Kueyen during 2006 October and December, and 2007 January with the FLAMES Giraffe Argus array. A field of view of 6.6 4.2 arcsec2 was used yielding 297 positional spectra in the optical range from six high dispersion grating settings (Table 1). The size of the angular resolution element was 0.31 0.31 arcsec2, corresponding to a spatial scale of 123 123 AU2 at the distance to M42 (412 pc; Reid et al 2009). The typical seeing during the observations was 0.8 arcsec FWHM. The data were cosmic ray cleaned, flat fielded, wavelength calibrated, and extracted with the girBLDRS pipeline also employed in Paper I (see Blecha & Simond 2004 for details). The resulting data cubes have not been corrected for the effects of differential atmospheric refraction (DAR; as in Paper I), as for these high dispersion spectra the wavelength coverage per grating is small and the effects of DAR are negligible under the low (1.5) observed air-masses.
The flux calibration was done within iraf using exposures of various spectrophotometric standards for the various high resolution (HR) gratings: CD-329927 (HR1), LTT 1020 (HR3, HR8), LTT 7987 (HR14B) – Hamuy et al. (1992), Hamuy et al. (1994), Feige 67 (HR4) – Oke (1990). These standards are accurate to about one per cent for relative flux calibration and a few per cent in absolute flux units – under the non-photometric observing conditions, however, the absolute flux calibration cannot be more accurate than about five per cent. The transfer of relative flux between different wavelength ranges adds most to the uncertainties, therefore five per cent accuracy may be a conservative estimate.
The FWHM velocity resolution of the spectra derived from measurements of comparison Th-Ar arc lines was 7.68 0.10 km s-1 at 656.3 nm (HR14B grating), 10.1 0.1 km s-1 at 372.6 nm (HR1), 8.60 0.20 km s-1 at 409.0 nm (HR3), 9.60 0.10 km s-1 at 434.8 nm (HR4), 9.80 0.10 km s-1 at 465.8 nm (HR6), and 10.6 0.1 km s-1 at 496.5 nm (HR8).
3 Results
3.1 Extracted spectra and LV 2 versus M42 surface brightness
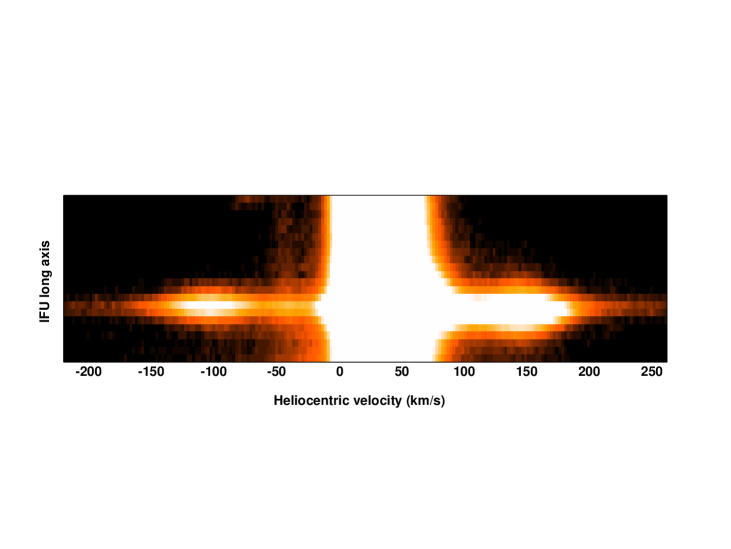
The flux calibrated high dispersion H spectrum of LV 2 is shown in Fig. 1 in the heliocentric velocity frame. The Orion nebula contribution to the line flux has not been subtracted; the intrinsic line flux from LV 2 is about 65 per cent of the total. This image was formed by integrating the signal of the (, , ) HR14 data cube along rows = 2 – 4 of the integral field array which contain most of the emission from the proplyd, and then extracting the (220, 260) km s-1 velocity range along columns 1 – 22. The proplyd peak emission is concentrated along those columns where additional emission is detected at around 100 and 150 km s-1, respectively originating in the approaching and receding lobes of LV 2’s jet; these are well-separated from the line systemic velocity.
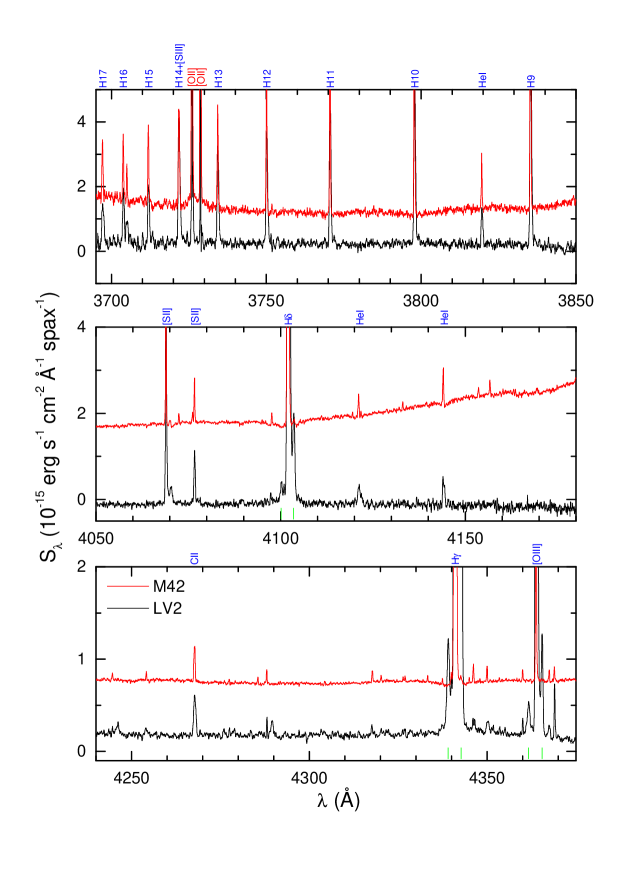
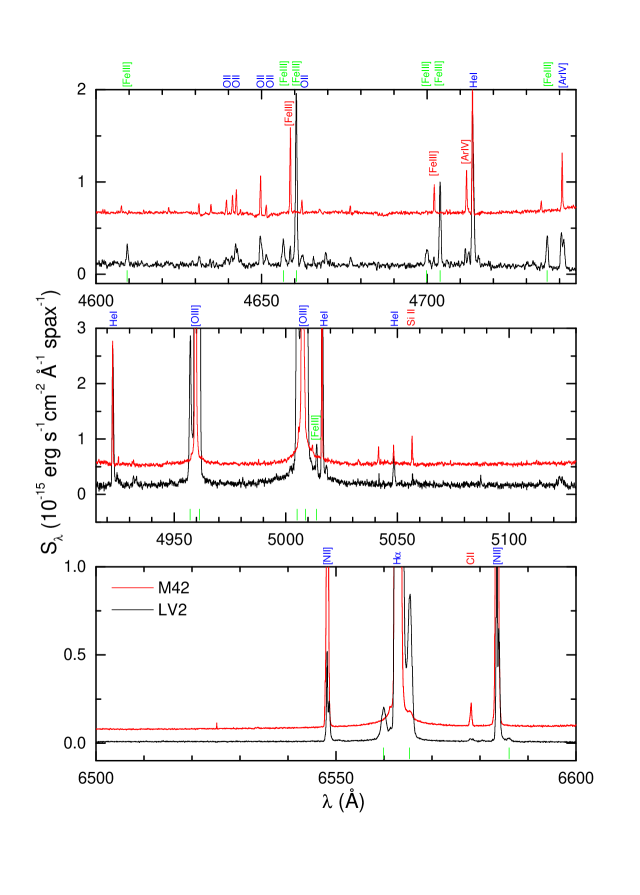
Extracted 1D spectra of LV 2 and of the local Orion nebula are shown in Figs. 2 and 3. These were formed by co-adding the spectra from nine spaxels of the reconstructed data cube containing the peak of LV 2’s emission, and about 70 spaxels where proplyd emission was not detected (based on a H image of the field extracted from the cube).111The typical background region was defined as (, ) (4–11, 18–20) (7–12, 4–5) (11–12, 6–17) and slight variations thereof were used to test its effect on the background-subtracted LV 2 spectra. The summed spectra were scaled by the number of spaxels in each and the Orion spectrum was subtracted from the former spectrum to obtain pure LV 2 spectra for the various grating settings. The local Orion nebula extraction was attempted with two different definitions of the background, in terms of number of co-added spaxels and their location, and the resulting LV 2 spectral line profiles and continuum level were found to be very similar. This simple way of performing the background subtraction and obtaining the intrinsic proplyd emission does not take into account the fact that LV 2 may be more dusty than the surrounding nebula.
The issue of internal extinction in a proplyd has been discussed in detail by Henney & O’Dell (1999), who showed that neglecting the attenuation of flux due to dust within a proplyd can lead to over-subtraction of the background, in the limiting case that the principle emitting layer of the Orion nebula lies behind a given proplyd. This can result in artificially distorted line profiles to be obtained, for example, with double peaks and negative troughs. The logarithmic reddening at H within LV 2 was estimated in Paper I to be 0.5 dex higher than for the local Orion nebula, which translates to an effective extinction, , about 1 mag larger. In this data set we do not deduce, however, a discernible wavelength-dependent effect on the resulting line profiles that could be caused by an apparent reddening excess. For example, the high order H i lines (transitions from upper levels 10) in the violet part of LV 2’s spectrum (3800 Å) are all similarly shaped and well-fitted by Gaussians (of FWHM 0.6 Å) with no evidence of anomalous profiles. At the same time, the [O ii] violet doublet lines at 3726, 3729 Å appear heavily suppressed in the subtracted spectrum. Very weak lines at longer wavelengths such as the recombination lines C ii 4267 and O ii 4649 (from recombining C2+ and O2+, respectively), are well-recovered in the intrinsic proplyd spectrum (see also Fig 4). The [N ii] 6584 line is also heavily suppressed, exhibiting a central trough, a characteristic not shared by the [S ii] 4069 line. In fact, the only lines that show any evidence of altered profile shape following the background subtraction are the forbidden lines [O ii] 3726, 3729, [N ii] 6548, 6584, [Ar iv] 4711, 4740, and perhaps only very slightly, [O iii] 4959 (Fig 4).
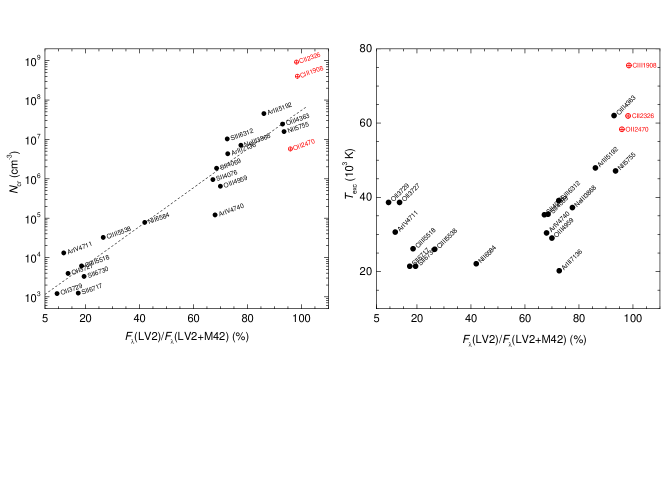
From this we draw the conclusion that the dominant effect on those line profiles that appear distorted in this data set is not due to the poor definition or over-subtraction of the Orion nebula’s local emission, but that collisionally-excited lines (CLs) are quenched near the systemic velocity of LV 2, due to the high plasma density there. The degree of suppression correlates very well with the critical densities of the upper levels of the lines in question. In Fig. 5 (left) the observed linear relationship is shown between the line critical density versus the fraction, , of specific line flux emitted from LV 2 over the total (LV 2 M42), normalized per spaxel. A linear fit was performed through the VLT data, excluding for consistency the coloured data points which are from the far-UV HST FOS measurements presented in Paper I:
| (1) |
is obtained, with a correlation coefficient of 0.96 and 0.46. Several data points in Fig. 5 (left) correspond to lines not included in the HR grating wavelength ranges discussed here, having been obtained from the lower resolution (LR) grating spectra of Paper I (including [S ii] 6717, 6730, [Cl iii], [Ar iii], [Ne iii], and [N ii] 5755). In all cases the measurements are for the rest velocity component of the lines (excluding the outlying jet lobes which correspond to components 1 and 4 in Table 2). No correlation is evident when is plotted against the lines’ excitation temperature (Fig. 5 right); this is to be expected as LV 2 if of similar as the local nebula (within 800 K). It is therefore established that due to its high electron density (106 cm-3), the surface brightness of the proplyd compared to the local Orion nebula is very high in lines with large critical densities such as the auroral [O iii] and [N ii] lines, and the UV transitions. For the O ii 4649 and C ii 4267 lines 71 and 68 per cent. This is essentially identical to the value found for H and other H i Balmer lines. The significance of this result is discussed in the conclusions.
3.2 Line maps, velocities and widths
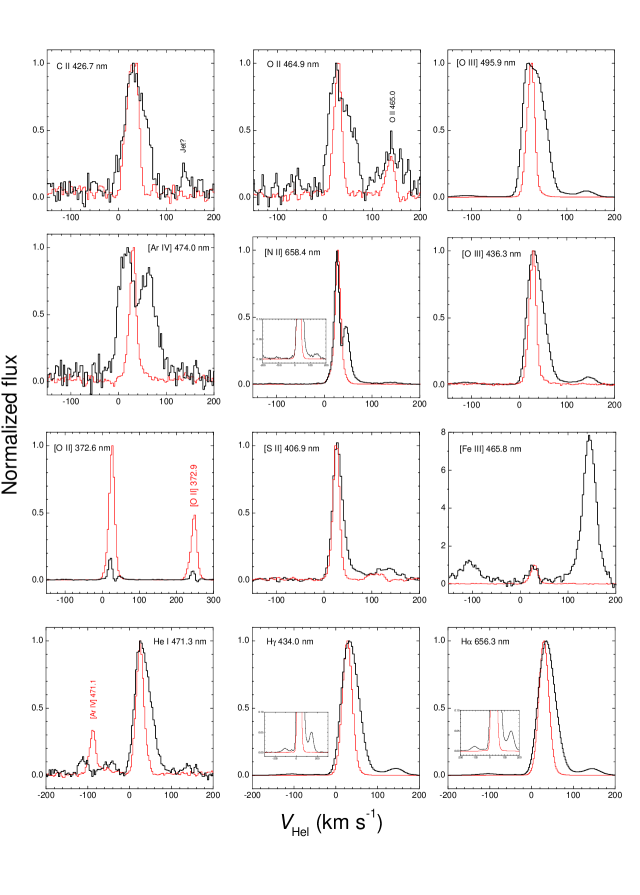
The profiles of lines emitted from the proplyd as opposed to those emitted from the local Orion nebula are compared in Fig. 4 in the heliocentric velocity frame. Gaussian fits to the profiles have been employed to measure the line heliocentric velocity and FWHM for the intrinsic proplyd spectra and for the co-added background M42 spectrum (Table 2). Regarding the intrinsic LV 2 spectrum, double Gaussian profiles were fitted to lines of high S/N ratio (components 2 and 3 in Table 2 corresponding to the core or ‘cusp’), while single Gaussians were fitted to the core of weaker lines. The outlying blue- and red-shifted jet lobes were each fitted with a single Gaussian (components 1 and 4 respectively in Table 2). Lines such as [N ii] and [Ar iv] whose profiles are double-peaked lack FWHM measurements, and their heliocentric velocities correspond to that of their central troughs. The fit parameters pertaining to the core of [O iii] 4959 are less accurate due to the increased uncertainty of the exact line profile in the 20–40 km s-1 interval (marked by ‘:’ in Table 2). The FWHMs in Table 2 have been corrected for instrumental broadening by quadrature subtraction, but the thermal (Doppler) broadening has not been corrected for: at ion temperatures of 9000 K the thermal width of the H i and He i lines is 20 and 10 km s-1 respectively. The hyperfine structure causes additional broadening to lines such as C ii 4267.
The widths of lines from LV 2 are typically larger than those from the nebula. This is an expected result (e.g. Henney & O’Dell 1999) and is due to the fact that the proplyd is experiencing continuous mass-loss through a photoevaporated flow arising from an embedded circumstellar disk by the action of far-UV radiation (e.g. Johnstone, Hollenbach & Bally 1998). The flow is then converted into a photoionized wind by the Lyman continuum extreme UV (EUV) radiation field of Ori C. The ionized wind and any externally irradiated ionized jets, when present as in LV 2, emit essentially an H ii region spectrum (see Figs. 2, 3). The [O ii], [N ii], and [Ar iv] lines show the effects of collisional quenching as discussed above. It is noteworthy that the C ii and O ii recombination lines arising from LV 2 appear very similar to each other and to the [O iii] collisional lines. In the case of O ii versus [O iii] this could mean that the lines are emitted from gas volumes of rather similar physical properties. For example, this could be linked to the fact that both sets of lines return similar abundances for O2+, that is, they yield a low abundance discrepancy factor (ADF 1, defined as the ratio of the recombination line (RL) over collisional line (CL)-derived O2+ abundance; see Paper I). In contrast, there have been cases of planetary nebulae such as NGC 6153 and NGC 7009 where the smaller widths of O ii RLs versus [O iii] CLs have been linked to the presence of cool, H-poor plasma and high ADFs for O2+ (e.g. Barlow et al. 2006).
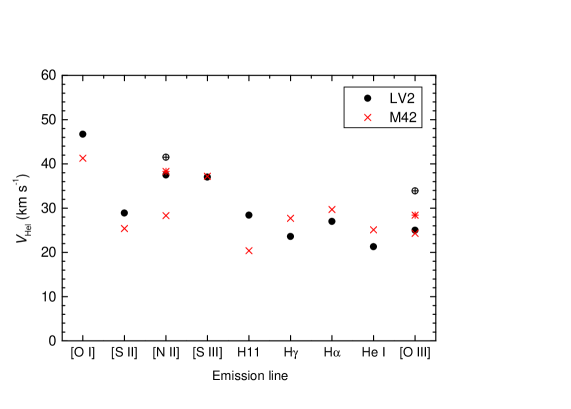
The velocities and FWHMs of O ii RLs and [O iii] CLs in the M42 spectrum are also very similar. The Doppler-corrected widths of H i and metal lines in M42 are comparable. There is some indication for slightly larger Doppler-corrected linewidths of H i compared to [S ii] or [O ii], but not when compared to [O iii]. In an extensive study of the gas velocity structure in M42 at an effective resolution of 10 km s-1, García-Díaz et al. (2008) concluded that the non-thermal broadening is not systematically different between recombination lines and collisional lines. It is also notable that the velocities of the [O ii] violet doublet components are separated by 3–4 km s-1 in the M42 spectrum; the same is true for the [O iii] nebular and auroral transitions. This points to a degree of variation in the ion density and/or temperature along the line of sight which warrants further investigation. In Fig. 6 the behaviour of the radial velocity of lines emitted from low to highly ionized species is examined for LV 2 and for the adjacent M42 nebular field. A shallow trend of decreasing velocity for increasing ionization degree is seen for LV 2, but the [S ii] 4069, [O iii] 4363 and [S iii] 6312 data which are due to lines of high critical density muddle the picture. The velocities plotted are those of component 2 (Table 2). The trend does not strengthen if instead we were to adopt velocities obtained from single component Gaussian fits to the cusp of LV 2 (i.e., treating components 2 & 3 as one component), but in that case LV 2 appears red-shifted versus M42 for all lines (by 6 3 km s-1). The scatter of the data is larger for M42 (even amongst the H i transitions which are emitted from the H+ recombining ion), and this is probably real as the observational uncertainties are typically much smaller. The behaviour of ion velocity versus ionization potential (IP) for proplyds and their environs has been explored by Henney & O’Dell (1999) who found trends of increasing blue-shift for increasing IP in three proplyds, while the opposite trend was observed in a fourth proplyd. Regarding M42, the trend of decreasing velocity for higher IP is commonly explained in terms of the ionization stratification of the nebula with low ionization lines being emitted closer to the ionization front (IF) which lies in front of the molecular cloud, and highly ionized species existing closer to the ionizing star having been accelerated away from the IF towards the observer (e.g. Esteban & Peimbert 1999 and references therein).
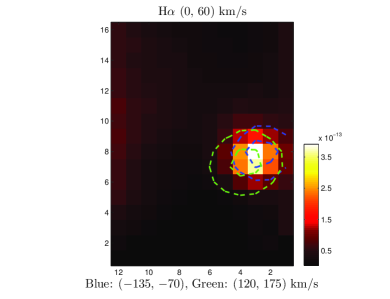
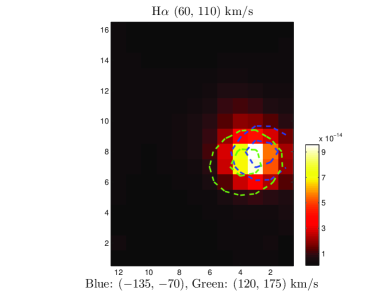
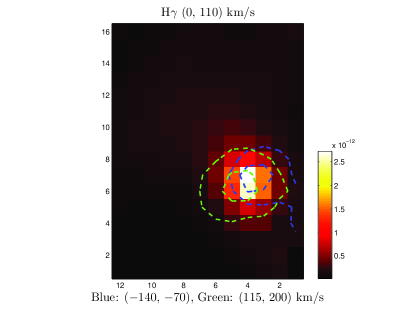
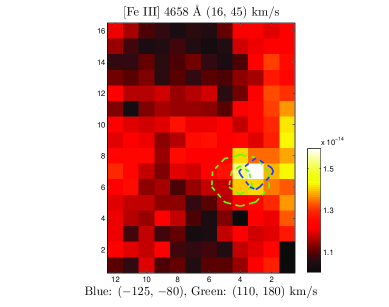
In Fig. 7 line maps of LV 2 and its vicinity are shown, created from the H, H, and [Fe iii] 4658 surface brightness distributions in selected velocity ranges. For the H i maps, sections of the field clear of proplyd emission were fitted with Legendre polynomials and the resulting model surfaces were subtracted from the original frames to yield background-subtracted images. The emission from the red- and blue-shifted lobes of LV 2’s jet is marginally spatially resolved: a separation of 1.5 spaxels (0.47 arcsec) is measured between the respective emission peaks of the green and blue contours. The H channel maps were obtained from the highest velocity resolution spectra of this data set and show in colour the 0 – 60 and 60 – 110 km s-1 range in separate panels with the bipolar jet emission displayed as contours. The proplyd appears more diffuse and elongated towards the tail in the latter velocity interval which encompasses less than 25 per cent of the line luminosity, as compared to a more compact shape close to the line centre. This would suggest that the 60 – 110 km s-1 interval intermediate between the cusp of LV 2 and the fast red-shifted jet lobe is occupied by gas which flows away from the cusp and goes on to form the proplyd’s comet-like tail. This corroborates the study of Henney et al. (2002) who hinted at this possibility. The same is also evident in the H map where the colourmap displays the whole 0 – 110 km s-1 interval. From the H i maps and a comparison between the shape of the jet contours with the orientation of the tail it would seem that the projected axis of the bipolar jet is at an angle of 90 deg with the tail of LV 2.
| LV 2 proplyd | ||||||||
| Component | 1 | 2 | 3 | 4 | 1 | 2 | 3 | 4 |
| (km s-1) | FWHM (km s-1) | |||||||
| H12 3750 | – | 28.70.4 | – | – | – | 41.20.9 | – | – |
| H11 3770 | – | 28.40.3 | – | – | – | 44.60.8 | – | – |
| H10 3798 | – | 28.90.3 | – | – | – | 47.21.0 | – | – |
| H9 3835 | – | 28.10.5 | – | – | – | 46.10.7 | – | – |
| [S ii] 4069 | – | 28.80.3 | – | 129.81.4 | – | 24.00.8 | – | 52.74.8 |
| [S ii] 4076 | – | 28.70.5 | – | – | – | 36.20.8 | – | – |
| H | – | 19.00.5 | 46.10.6 | 133.90.5 | – | 34.40.8 | 34.80.8 | 48.71.2 |
| C ii 4267 | – | 34.80.9 | – | – | – | 52.62.0 | – | – |
| H | 105.60.6 | 23.60.3 | 41.61.3 | 141.80.5 | 62.11.7 | 30.91.2 | 45.10.9 | 47.41.0 |
| [O iii] 4363 | 112.75.5 | 24.70.5 | 41.92.8 | 143.80.5 | 73.914.4 | 22.31.8 | 36.32.6 | 38.61.1 |
| [Fe iii] 4607 | – | – | – | 150.81.0 | – | – | – | 37.12.5 |
| O ii 4649 | – | 20.60.6 | 54.21.1 | – | – | 28.02.7 | 34.55.4 | – |
| O ii 4650 | – | 32.33.2 | – | – | – | 69.08.0 | – | – |
| [Fe iii] 4658 | 106.92.1 | 26.41.7 | – | 144.90.2 | 58.65.0 | 25.63.9 | – | 33.10.5 |
| O ii 4661 | – | 32.82.4 | – | – | – | 62.26.0 | – | – |
| [Fe iii] 4702 | 114.62.0 | 17.52.0 | – | 139.40.2 | 69.05.3 | 25.74.7 | – | 32.00.6 |
| He i 4713 | – | 21.30.6 | 39.73.9 | – | – | 24.92.9 | 41.63.5 | – |
| [Ar iv]4740 | – | 35.2: | – | – | – | – | – | – |
| He i 4922 | – | 30.30.5 | – | – | – | 46.91.3 | – | – |
| [O iii] 4959 | 109.02.0 | 25: | 55: | 138.80.5 | 45.22.3 | 36: | 28: | 42.11.1 |
| [Fe iii] 5011 | – | – | – | 142.10.5 | – | – | – | 35.81.1 |
| [N ii] 6584 | – | 39: | – | 139.01.0 | – | – | – | 39.62.0 |
| H | 102.92.2 | 27.02.1 | 43.27.4 | 142.70.5 | 51.91.5 | 36.76.7 | 47.53.6 | 50.03.0 |
| Local M42 nebula | ||||||||
| (km s-1) | FWHM (km s-1) | |||||||
| [O ii] 3727 | – | 25.00.2 | – | – | – | 14.30.3 | – | – |
| [O ii] 3729 | – | 21.80.3 | – | – | – | 15.70.4 | – | – |
| H12 3750 | – | 21.00.3 | – | – | – | 25.80.3 | – | – |
| H11 3770 | – | 21.00.2 | – | – | – | 26.00.5 | – | – |
| H10 3798 | – | 20.30.4 | – | – | – | 26.50.5 | – | – |
| H9 3835 | – | 20.30.3 | – | – | – | 25.40.4 | – | – |
| [S ii] 4069 | – | 25.40.3 | – | – | – | 12.50.6 | – | – |
| [S ii] 4076 | – | 25.40.5 | – | – | – | 11.50.8 | – | – |
| H | – | 21.80.1 | – | – | – | 25.40.4 | – | – |
| C ii 4267 | – | 29.30.5 | – | – | – | 27.81.3 | – | – |
| H | – | 27.70.0 | – | – | – | 26.00.1 | – | – |
| [O iii] 4363 | – | 28.40.2 | – | – | – | 15.30.5 | – | – |
| [Fe iii] 4607 | – | 34.60.6 | – | – | – | 16.91.4 | – | – |
| [O ii] 4649 | – | 26.80.2 | – | – | – | 16.60.5 | – | – |
| [O ii] 4650 | – | 26.60.4 | – | – | – | 18.61.0 | – | – |
| [Fe iii] 4658 | – | 29.10.2 | – | – | – | 15.90.5 | – | – |
| O ii 4661 | – | 24.90.6 | – | – | – | 18.61.4 | – | – |
| [Fe iii] 4702 | – | 25.50.2 | – | – | – | 14.60.6 | – | – |
| He i 4713 | – | 25.10.2 | – | – | – | 20.10.3 | – | – |
| [Ar iv] 4740 | – | 30.40.3 | – | – | – | 14.90.7 | – | – |
| He i 4922 | – | 22.70.1 | – | – | – | 18.90.3 | – | – |
| [O iii] 4959 | – | 24.30.2 | – | – | – | 16.20.4 | – | – |
| [Fe iii] 5011 | – | 26.10.4 | – | – | – | 12.00.9 | – | – |
| [N ii] 6584 | – | 28.30.2 | – | – | – | 11.10.4 | – | – |
| H | – | 29.70.1 | – | – | – | 26.50.3 | – | – |
- a
-
Velocities are heliocentric. The FWHMs have been corrected for instrumental broadening using the Th-Ar arc line measurements reported in Section 2. Highly uncertain values are marked with ‘:’.
3.3 Physical conditions and jet properties
The red-shifted lobe of LV 2’s jet is prominent in several emission lines from hydrogen, helium and heavier species (O0, N+, S+, S2+, O2+, Ne2+, Fe2+). The blue-shifted lobe is also well-detected in [O i], [O iii], [S iii], [Fe iii]4658, and the strong H i lines (see Figs. 2, 3 of this paper and fig. 7 of Paper I): the lines are however a factor of a few weaker. A compilation of line fluxes from the high-dispersion HR spectra of this paper and the lower-dispersion LR spectra of Paper I is presented in Table 3 for the red-shifted lobe.
In order to compensate for the fact that there are gaps in the wavelength coverage of the FLAMES HR gratings and that the LR and HR observations were taken on different nights and under different observing conditions, the HR measurements have been cast in units relative to H using the LR spectra of Paper I in the following manner:
| (2) |
The [Fe iii] 4658 line was scaled via He i 4713, and [Fe iii] 5011 was scaled via He i 5016. H was scaled via [N ii] 6584 as the rest velocity component of H probably suffers from saturation effects on the HR14 and LR5/6 grating spectra. The relative line fluxes were then dereddened with (H) 1.20.2 using the modified Cardelli, Clayton & Mathis (1989; CCM) law from Blagrave et al. (2007), with a total to selective extinction ratio 5.5. This reddening constant was obtained from the H/H and H/H ratios from a comparison of the observed ratios to their theoretical values from Storey & Hummer (1995) at 104 K and 106 cm-3. The observed H/H ratio is considered unreliable due to H likely being saturated. Using the same H i line ratios, (H) for the blue-shifted jet lobe is measured to be 0.9 and 1.5 respectively, in approximate agreement with the reddening deduced for the red-shifted lobe above and for the cusp of LV 2 from Paper I.
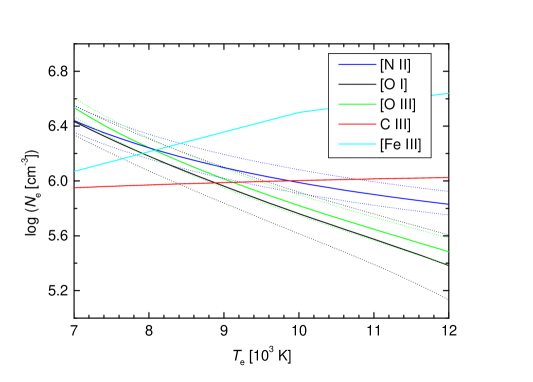
In Fig. 8, a group of curves is shown on the (, ) diagnostic plane representing solutions for the dereddened line ratios from Table 3 applicable to the red-shifted jet. The ratios [N ii] 5755/6584, [O i] 5577/6300, [O iii] 4363/5007, and [Fe iii] 5011/4658 (3P1–5D2)/(3F4–5D4) were used, employing the multi-level ion modelling program equib developed at University College London. The C iii] 1907/1909 curve is from the HST STIS observations of LV 2 by Henney et al. (2002). From Fig 8 we deduce that the mean electron temperature and density of the jet are 9000 – 10,000 K and 106 cm-3, respectively. The iron lines indicate that overall higher densities of 2.5106 cm-3 are appropriate for their emitting region, and densities log (/cm-3) 7.0 are obtained from the [Fe iii] 4702/4658 (3F3–5D3)/(3F4–5D4) ratio when comparing with the theoretical ratios of Keenan et al. (2001). The ionized carbon, nitrogen, and neutral oxygen lines also indicate densities of 106 cm-3. The fact that a range of densities are obtained from various diagnostics is an indication that the jet is stratified in density and probably has a clumpy small-scale structure. This is corroborated by the presence of neutral oxygen in the body of the jet, already noted in Paper I (see fig. 7), indicating that dense quasi-neutral clumps can withstand complete photoionization in the jet flow.
Our analysis suggests that previous mass-loss rate estimates from the jet of 10-8 M yr-1, which were based on considerations of a fully ionized flow (e.g. Henney et al. 2002; Vasconcelos et al. 2005), would actually be lower limits.
3.3.1 Velocity-resolved physical conditions
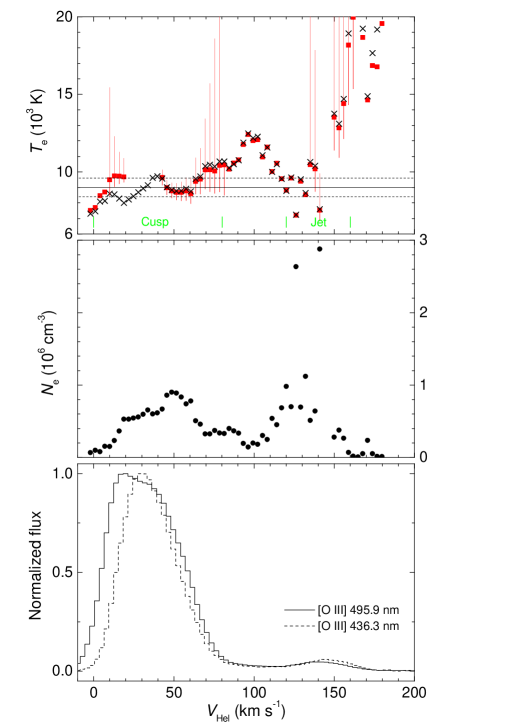
We used the high dispersion [O iii] line profiles obtained with the VLT Argus fibre array in conjunction with the C iii] HST STIS observations by Henney et al. (2002) from programme 8120 to map the variation of electron temperature and density as a function of the heliocentric velocity of the ionized gas in LV 2. These C iii] and [O iii] lines should originate from roughly the same volume of highly ionized gas. The results from this analysis are shown in Fig. 9 where the [O iii] profiles are from the intrinsic (background-subtracted) LV 2 spectrum. The [O iii] and C iii] profiles were first binned to a velocity resolution of 3 km s-1 pix-1 and the electron density was computed as a function of from the density-sensitive (reddening and -independent) C iii] 1907/1909 ratio for an electron temperature of 9000 K. The obtained density profile (Fig. 9 middle panel) was then used to compute the temperature profile from the [O iii] auroral to nebular line ratio (Fig. 9 top panel). The density variations that are observed across the bulk of LV 2’s emission in the 10–80 km s-1 range are essentially the same as those obtained by Henney et al. (2002) who analyzed the C iii] data in a similar way. The electron density in LV 2 peaks very close to the rest velocity of the [O iii] lines [log (cm3) 6], then falls off towards a local minimum at 100 km s-1, before rising again to values of log [ (cm3)] 6 and higher in the velocity range occupied by the red-shifted jet emission.
The analysis reveals that steep temperature variations are observed: (i) in the velocity interval between the bulk LV 2 emission and the onset of the red-shifted jet lobe, (ii) at higher velocities beyond the ‘red’ edge of the jet. The observed amplitude is 3500 K with a maximum of 12 500 K on the ‘blue’ side of the jet, while even higher temperatures (admittedly with very large associated uncertainties) are observed on its ‘red’ side. These steep variations could be the signature of a shock discontinuity and its associated heating/cooling zone which is kinematically resolved here. A shock discontinuity can form at the locus where the jet encounters and bursts out from the main ionization front surrounding LV 2 (the H0/H+ contact surface) and/or at the outer physical envelope of the conical/cylindrical jet.
On the other hand, at velocities associated with the bulk emission near the rest frame of LV 2, and with the bulk jet emission, the temperature is 9000 K which is typical of photoionized gas. This measurement (the horizontal black line in Fig. 9 top) is corroborated by the analysis of the integrated line ratios for the rest velocity component (9000 600 K) from the lower-dispersion spectra of Paper I (table 3), and from the diagnostic diagram pertaining to the jet in the present work (Fig. 8). In the temperature plot of Fig. 9 the red data points correspond to the intrinsic [O iii] line profiles where the interval 20–40 km s-1 has been excluded from the analysis due to the increased uncertainty in the exact profile of 4959 very close to the bulk velocity of M42. Specifically, 9240 with 815 K for [0, 80] km s-1 across LV 2’s cusp (where the scatter indicates real variations rather than observational uncertainties). This velocity interval contains 98 per cent of the intensity of the [O iii] auroral and nebular lines near the rest frame of LV 2, excluding the outlying jet lobes. The analysis was also performed using the observed (LV 2 M42) line profiles resulting in a variation (black crosses) that follows closely the previous one across most of the velocity range sampled. In this case we find that across the cusp 9020 with 910 K for [0, 80] km s-1. We therefore deduce that the bulk of the [O iii] emitting region in LV 2 appears to be fairly isothermal with a 10 per cent rms temperature variation, while considering the uncertainties the main body of the jet may be less so.
Using the information obtained above for the physical conditions in the red-shifted jet lobe we have computed ionic abundances for gas temperatures of 9000 and 10 000 K, adopting an electron density of 106 cm-3. The results are presented in Table 4. Both dominant ionization states of sulphur are observed allowing us to obtain its gas-phase abundance. We have assumed an ionization correction factor (icf) of 1.05 meaning that higher ionization stages probably contribute less than five per cent of the total (eq. 5, Paper I). This icf is applicable to the cusp of LV 2 and can be considered to be a valid assumption for the jet also given the very similar ion temperature and density in the two. The abundance of sulphur is then 12log(S/H) 6.93 0.06, that is, 0.2 dex less than in the Sun. This is in good agreement with the abundance of 6.83 measured from the rest velocity component of the lines due to emission from the cusp (table 7, Paper I). An independent determination for the gas-phase S/H ratio in M42 is 6.890.02 based on SST data (Rubin et al. 2011).
3.3.2 The Fe abundance and dust considerations
Of particular interest is the abundance of Fe2+/H+ in the jet which places a lower limit to the total iron abundance. We used a 25-level ionic model for Fe iii employing the transition probabilities of Nahar & Pradhan (1996) and the collision strengths of Zhang (1996) to compute the abundance of Fe2+ using the 4658, 5011 lines, finding 12 log(Fe2+/H+) 7.010.05. This is 2 dex higher than the total Fe/H abundance in the cusp of LV 2 (Paper I). It is therefore established that (i) iron in the main body of LV 2 is depleted by a factor of at least 100 with respect to that in the jet, and (ii) there is a factor of at least nine more iron in the jet (1 dex) than in the bulk M42 gas (cf. Paper I and Esteban et al. 2004). The jet therefore has an iron abundance of 30 per cent solar or a depletion relative to solar [Fe/H] log(Fe/H) log(Fe/H)⨀ 0.5 dex. If we adopt the same icf(Fe) for the jet as that for the core from Paper I then [Fe/H]jet 0.2 dex.
An increase in the gaseous Fe abundance associated with the high-velocity HH 202 outflow in the Orion nebula has also been attributed to dust destruction by Mesa-Delgado et al. (2009), who found (0.3–0.5) dex of iron depletion with respect to solar. The depletion of iron in the core of LV 2 sampled by the rest velocity line component is [Fe/H]core (2.540.40) dex (Paper I). This is higher than the depletions of (i) 1.3 dex associated with the low-velocity component of the HH 202 flow (Mesa-Delgado et al. 2009), and (ii) 1.5 dex measured in the local background of LV 2 which samples the generic M42 gas (Paper I). The iron depletion in LV 2’s rest frame (0.003–0.007 of the solar abundance) is also higher than in typical Galactic H ii regions, and lies within the high end of the range exhibited by some planetary nebulae (Delgado Inglada et al. 2009). In terms of the general interstellar medium this level of depletion is comparable only to what is found towards a minority of sight lines, including the direction to the star Oph which represents the prototype of strong depletions observed in the cold ISM (Jenkins 2009).
The fact that sulphur, which is a volatile element [its 50 per cent condensation temperature, , into troilite (FeS) is 664 K; Lodders 2003], shows essentially the same abundance in the core and jet of LV 2, whereas the refractory species iron ( 1334 K) is much more abundant in the jet than in the core leads to the following conclusions: (i) iron-bearing condensates must be very efficiently destroyed in the fast jet, probably as a result of grain sputtering processes, thus substantially enhancing the overall gaseous abundance of Fe (factor of 220 increase over LV 2’s rest frame, and 19 over M42); (ii) there is no evidence for a significant depletion of sulphur onto dust and therefore LV 2 has a genuinely lower S abundance than the Sun (0.2 dex).
3.3.3 The Ne/S abundance ratio
The Ne/S abundance ratio in LV 2 is well constrained via the proxy ionic ratio Ne2+/S2+ as it involves lines of similar excitation energy (37.2 kK for [Ne iii] 3869 and 39.1 kK for [S iii] 6312) and critical density (7.1106 vs. 1.0107 cm-3), and is therefore fairly insensitive to the assumption of or for their emitting zones. This ratio is 13.5 and 14.8 in the jet and core of LV 2 respectively (cf. Table 4 with Paper I, table 5) whereas the canonical solar Ne/S ratio is 6.5 (Asplund et al. 2009). Our measurement for LV 2 agrees with the value of 13.0 applicable to M42 from infrared lines measured by Spitzer (Rubin et al. 2011). The IR lines set a good benchmark as their are immune to or reddening biases. It is discomfiting however that the ratio in the local vicinity of LV 2 measured using the optical lines is only 4.9 (Paper I, table 5), and in agreement with the value of 4.8 from Esteban et al. (2004) applicable to a different M42 zone obtained also from the optical lines.
Two factors could conspire to bring about a discrepancy between the optical and IR values of the Ne/S ratio for M42: in terms of effects, the offset could be explained if the optical Ne2+/S2+ ratio was underestimated due to a variation of 1900 K between a cooler Ne2+ and a warmer S2+ emitting volume (rather than assuming the same temperature for both). Secondly, the differential reddening correction between 3869 and 6312 Å is a factor of about two, and if the extinction along the optical observation sightlines has been underestimated in any way this would also cause the optical Ne2+/S2+ ratio to appear too low. On the other hand, it would be very hard to appeal to (or extinction) biases to explain the opposite, i.e. that the Ne/S ratio in LV 2 has been overestimated, as this would have to act opposite to the natural tendency of the 3869 and 6312 lines to be more efficiently excited at lower and higher , respectively.
We therefore conclude that the Ne/S ratio in LV 2 is genuinely higher than solar by factors of 2.1 – 4.3. The lower value is obtained from the Ne2+/S2+ determination applicable to the jet and core of LV 2. The upper limit is obtained from the total Ne/S ratio for the rest velocity component (core) from Paper I and may be affected by ionization correction factor considerations. This adds to the body of evidence that the canonical solar Ne (Asplund et al. 2009) appears to be low compared to M42 (Rubin et al. 2011) and the LV 2 proplyd (Paper I and this work) based on considerations of the Ne/S ratio, the absolute neon abundance in B-type stars in Orion (Símon-Díaz & Stasińska 2011 and references therein), or when comparing the solar Ne/O ratio to the mean value from Galactic planetary nebulae and H ii regions (e.g. Wang & Liu 2008). A new solar abundance model by Delahaye et al. (2011) partially rectifies this situation by raising the Ne abundance to 8.150.17 (0.22 dex with respect to the value in Asplund et al 2009).
| Line | () | () |
|---|---|---|
| [Ne iii] 3869 | 45.1 6.45 | 67.2 9.7 |
| [S ii] 4069 | 5.15 0.71 | 7.19 0.99 |
| H 4101 | 20.4 0.9 | 27.9 1.6 |
| H 4340 | 32.8 2.6 | 42.3 3.4 |
| [O iii] 4363 | 5.93 0.55 | 7.44 0.70 |
| He i 4471 | 5.21 0.55 | 6.22 0.66 |
| [Fe iii] 4658 | 12.4 0.94 | 13.0 1.0 |
| [Fe iii] 4702 | 5.56 0.57 | 5.9 0.61 |
| [Fe iii] 4734 | 3.03 0.39 | 3.20 0.41 |
| H 4861 | 100 4 | 100 5 |
| [O iii] 4959 | 103 9.4 | 99.0 9.0 |
| [O iii] 5007 | 309 29 | 290 28 |
| [Fe iii] 5011 | 4.75 0.72 | 4.46 0.68 |
| [O i] 5577 | 0.231 0.046 | 0.174 0.035 |
| [N ii] 5755 | 6.97 1.16 | 4.95 0.83 |
| [O i] 6300 | 9.10 0.49 | 5.39 0.28 |
| [S iii] 6312 | 6.99 0.50 | 4.14 0.30 |
| H 6563 | 287 20: | 201 14: |
| [N ii] 6584 | 7.21 0.43 | 3.90 0.25 |
- a
-
Several lines were measured on the lower resolution Argus spectra using the gratings quoted in table 1 of Paper I: [Ne iii] 3869 (LR1), He i 4471 (LR2), H 4861 (LR3), [O i] 5577 (LR4), [N ii] 5755 (LR4/LR5), [O i] 6300 (LR5), [S iii] 6312 (LR5). The values for H are unreliable. See the text for details.
| Species | 9000 K | 10000 K |
|---|---|---|
| 106 cm-3 | 106 cm-3 | |
| N+/H+ | 7.70 | 7.46 |
| O2+/H+ | 8.60 | 8.29 |
| Ne2+/H+ | 8.05 | 7.85 |
| Fe2+/H+ | 7.08 | 6.92 |
| S+/H+ | 6.24 | 6.07 |
| S2+/H+ | 6.92 | 6.71 |
| S/H | 7.02 | 6.82 |
| Fe2+/O2+ | 0.0300.004 | 0.0430.006 |
| Ne2+/O2+ | 0.280.08 | 0.360.10 |
| Ne2+/S2+ | 13.53.7 | 13.83.8 |
- a
-
Solar abundances for comparison: N 7.830.05, O 8.690.05, Ne 7.930.10, S 7.120.03, and Fe 7.500.04 (Asplund et al. 2009).
4 Discussion and conclusions
We have presented spatially resolved, high dispersion spectra of LV 2 and its Orion nebula vicinity based on VLT observations. The deep spectra enabled the detection and resolution of emission lines arising from the proplyd’s irradiated bipolar microjet. Maps of LV 2 in the light of H i and [Fe iii] lines have been presented, where the jet lobes appear spatially resolved from the core of the proplyd.
An abundance analysis was undertaken for the brighter red-shifted jet lobe complementing the abundance analysis of the core of LV 2 presented in Paper I. A noteworthy result is the significantly enhanced abundance of iron in the jet versus the core of LV 2, pointing to very efficient dust destruction mechanisms in fast irradiated microjets. The overall depletion of iron in the proplyd’s rest frame is higher than in Galactic H ii regions and is comparable to what is found along cold ISM sight lines. The Ne/S abundance ratio in LV 2 as probed by optical lines is 2 times solar, in agreement with the value applicable to the generic M42 gas from IR line measurements by Spitzer.
The extreme-UV irradiated jet shows a range of ionization conditions allowing the survival of neutral oxygen pockets mixed in with highly ionized gas. A velocity-resolved analysis was performed probing the electron temperature and density across LV 2’s rest frame and red-shifted jet lobe. The [O iii] and C iii] emitting regions in LV 2 show a range of densities with a peak of 106 cm-3 near the line systemic velocity and an upper limit of 107 cm-3 from [Fe iii] emission within the red-shifted jet lobe. The electron temperature in the highly ionized zone in the main body of the proplyd shows a small 10 per cent rms variation. Larger temperature variations associated with the onset of the jet emission have been attributed to a shock discontinuity.
The far-UV to optical collisional lines emitted from LV 2 are correlatively quenched according to the critical densities of their upper levels, with lines of low critical density being affected the most. This reinforces the conclusion of Paper I that in H ii regions containing dense zones, such as proplyds, filaments, globules etc., line ratios such as [O iii] 4363/(49595007) and [N ii] 5755/(65486584) will be heavily weighted towards the dense component of the gas. These line ratios are the main temperature diagnostics for Galactic and extragalactic H ii regions, whose validity rests on an independent way of determining the mean density of the plasma. This is usually done via the [O ii] or [S ii] doublet ratios which are demonstrably biased towards low density regions (Fig. 5 left). The [N ii] ratio will be especially biased as the critical densities of its constituent lines are at a ratio of approximately 200 versus only 40 for the [O iii] lines, resulting in more uneven fractions of [N ii] 5755 versus [N ii] 6584 to be emitted from dense and diffuse gas respectively, than is the case for [O iii] 4363 and [O iii] 5007 – this is demonstrated in Fig. 5.
In this situation, and especially in cases of distant nebulae whose gas density distribution appears deceptively homogeneous on large scales, or in the presence of condensations just below the angular resolution limit in nearby nebulae, the end result would be an overestimation of the electron temperature and an inevitable underestimation of the gas metallicity (e.g. Rubin 1989). Given the behaviour of the [N ii] and [O iii] lines seen in Fig. 5 the former temperature would be more adversely affected that the latter in H ii regions with a clumpy small-scale density distribution. It may be no coincidence therefore that ([N ii]) values in H ii regions are typically higher than ([O iii]) values by 1000 K on average (e.g. Rodríguez & Delgado-Inglada 2011). This is usually justified in the literature as being due to the fact that the low ionization zones in a nebula tend to have a higher temperature than the O iii zone. Based, however, on the arguments presented here this behaviour could be at least partly spurious if the underlying density distribution of a nebula is sufficiently clumpy at sub-arcsecond scales.
Regarding the abundance anomaly pertaining to RL versus CL diagnostics (e.g. Tsamis et al. 2003; Tsamis & Péquignot 2005; García-Rojas & Esteban 2007; Ercolano 2009; Esteban et al. 2009; Mesa-Delgado et al. 2010; Simón-Díaz & Stasińska 2011; Paper I), it should be noted that the fraction of O ii 4649, C ii 4267 and H i RLs that are emitted from LV 2 is the same for all these lines (70 per cent), while the rest is emitted from diffuse M42 gas along the line of sight. As a result the proplyd does not show elevated O2+/H+ and C2+/H+ abundance ratios, measured using RLs, compared to the Orion background (cf. Paper I). In our view this analysis goes some way towards explaining the abundance anomaly in H ii regions as a problem affected by the use and interpretation of the [O iii] and [N ii] plasma thermometers when applied to average spectra of large nebular volumes.
Acknowledgments
We thank the FLAMES support astronomers at ESO for scheduling the VLT service mode observations. William Henney kindly gave us access to reduced HST STIS data of LV 2. We thank Bob Rubin, Daniel Péquignot and Adal Mesa-Delgado for useful correspondence. The referee is thanked for a detailed and very helpful report. This research made use of the NASA ADS database.
YGT acknowledges the award of a Marie Curie intra-European Fellowship within the 7th European Community Framework Programme (grant agreement PIEF-GA-2009-236486).
References
- [Adams(2010)] Adams, F. C. 2010, ARA&A, 48, 47
- [Asplund et al.(2009)] Asplund, M., Grevesse, N., Jacques Sauval, A., & Scott, P. 2009, ARA&A, 47, 481
- [Barlow(2006)] Barlow M. J., Hales A. S., Storey P. J., Liu X.-W., Tsamis Y. G., Aderin M. E., 2006, in Barlow M. J., M endez R. H., eds, Proc. IAU Symp. 234, Planetary Nebulae in our Galaxy and Beyond. Cambridge Univ. Press, Cambridge, p. 367
- [Boss(2010)] Boss, A. P. 2010, IAU Symposium, 265, 391
- [Blagrave et al.(2007)] Blagrave, K. P. M., Martin, P. G., Rubin, R. H., Dufour, R. J., Baldwin, J. A., Hester, J. J., & Walter, D. K. 2007, ApJ, 655, 299
- [Blecha & Simond 2004] Blecha, A., & Simond, G. 2004, GIRRAFE BLDR Software Reference Manual 1.12 (http://girbldrs.sourceforge.net)
- [Cardelli et al.(1989)] Cardelli, J. A., Clayton, G. C., & Mathis, J. S. 1989, ApJ, 345, 245 (CCM)
- [Davey et al.(2000)] Davey, A. R., Storey, P. J., & Kisielius, R. 2000, A&ASupplement, 142, 85
- [Delahaye et al.(2010)] Delahaye, F., Pinsonneault, M. H., Pinsonneault, L., & Zeippen, C. J. 2010, arXiv:1005.0423
- [Delgado Inglada et al.(2009)] Delgado Inglada, G., Rodríguez, M., Mampaso, A., & Viironen, K. 2009, ApJ, 694, 1335
- [Ercolano(2009)] Ercolano, B. 2009, MNRAS, 397, L69
- [Esteban & Peimbert(1999)] Esteban, C., Peimbert, M. 1999, A&A, 349, 276
- [Esteban et al.(2004)] Esteban, C., Peimbert, M., García-Rojas, J., Ruiz, M. T., Peimbert, A., & Rodríguez, M. 2004, MNRAS, 355, 229
- [Esteban et al.(2009)] Esteban, C., Bresolin, F., Peimbert, M., García-Rojas, J., Peimbert, A., & Mesa-Delgado, A. 2009, ApJ, 700, 654
- [García-Rojas & Esteban 2007] García-Rojas, J. & Esteban, C. 2007, ApJ, 670, 457
- [García-Díaz et al.(2008)] García-Díaz, M. T., Henney, W. J., López, J. A., & Doi, T. 2008, RevMexAA, 44, 181
- [Gonzalez(1997)] Gonzalez, G. 1997, MNRAS, 285, 403
- [Hamuy(1992)] Hamuy, M., Walker, A.R., Suntzeff, N.B., et al., 1992, PASP, 104, 533
- [Hamuy(1994)] Hamuy, M., Suntzeff, N.B., Heathcote, S.R., et al., 1994, PASP, 106, 566
- [Henney & O’Dell(1999)] Henney, W. J., & O’Dell, C. R. 1999, AJ, 118, 2350
- [Henney et al.(2002)] Henney, W. J., O’Dell, C. R., Meaburn, J., Garrington, S. T., & Lopez, J. A. 2002, ApJ, 566, 315
- [Jenkins(2009)] Jenkins, E. B. 2009, ApJ, 700, 1299
- [Johnstone et al.(1998)] Johnstone, D., Hollenbach, D., & Bally, J. 1998, ApJ, 499, 758
- [Keenan et al.(2001)] Keenan, F. P., Aller, L. H., Ryans, R. S. I., & Hyung, S. 2001, Proceedings of the National Academy of Science, 98, 9476
- [Laques & Vidal(1979)] Laques, P., & Vidal, J. L. 1979, A&A, 73, 97
- [Lodders(2003)] Lodders, K. 2003, ApJ, 591, 1220
- [Mesa-Delgado et al.(2009)] Mesa-Delgado, A., Esteban, C., García-Rojas, J., Luridiana, V., Bautista, M., Rodríguez, M., López-Martín, L., & Peimbert, M. 2009, MNRAS, 395, 855
- [Mesa-Delgado & Esteban(2010)] Mesa-Delgado, A., & Esteban, C. 2010, MNRAS, 405, 2651
- [Nahar & Pradhan(1996)] Nahar & Pradhan 1996, A&AS, 119, 509
- [Neves et al.(2009)] Neves, V., Santos, N. C., Sousa, S. G., Correia, A. C. M., & Israelian, G. 2009, A&A, 497, 563
- [O’Dell et al.(1993)] O’Dell, C. R., Wen, Z., & Hu, X. 1993, ApJ, 410, 696
- [O’dell(2001)] O’Dell, C. R. 2001, ARA&A, 39, 99
- [Oke 1990] Oke, J.B. 1990, AJ, 99, 1621
- [Reid et al.(2009)] Reid, M. J., et al. 2009, ApJ, 700, 137
- [Rodríguez & Delgado-Inglada(2011)] Rodríguez, M. & Delgado-Inglada, G. 2011, ApJL, 733, L50
- [Rubin(1989)] Rubin, R. H. 1989, ApJS, 69, 897
- [Rubin et al.(2011)] Rubin, R. H., Simpson, J. P., O’Dell, C. R., McNabb, I. A., Colgan, S. W. J., Zhuge, S. Y., Ferland, G. J., & Hidalgo, S. A. 2011, MNRAS, 410, 1320
- [Simón-Díaz(2010)] Simón-Díaz, S. 2010, A&A, 510, A22
- [Simón-Díaz & Stasińska(2011)] Simón-Díaz, S., & Stasińska, G. 2011, A&A, 526, A48
- [Storey & Hummer(1995)] Storey, P. J., & Hummer, D. G. 1995, MNRAS, 272, 41
- [Tsamis et al.(2003)] Tsamis, Y. G., Barlow, M. J., Liu, X.-W., Danziger, I. J., & Storey, P. J. 2003a, MNRAS, 338, 687
- [Tsamis & Péquignot(2005)] Tsamis, Y. G., & Péquignot, D. 2005, MNRAS, 364, 687
- [Tsamis et al.(2011)] Tsamis, Y. G., Walsh, J. R., Vílchez, J. M., & Péquignot, D. 2011, MNRAS, 412, 1367 (Paper I)
- [Vasconcelos et al.(2005)] Vasconcelos, M. J., Cerqueira, A. H., Plana, H., Raga, A. C., & Morisset, C. 2005, AJ, 130, 1707
- [Wang & Liu(2008)] Wang, W., & Liu, X.-W. 2008, MNRAS, 389, L33
- [Zhang(1996)] Zhang 1996, A&AS, 119, 523