Her X-1: the positive cyclotron line energy / luminosity correlation
Studies of some bright, super-Eddington transient pulsars show a negative correlation between the energy of the cyclotron resonance scattering feature (CRSF) and the bolometric luminosity. For Her X-1, using repeated RXTE observations during 1996–2005, the inverse dependence was found: the energy of the cyclotron line increases as the luminosity increases. The X-ray flux measured by the RXTE/ASM (2–10 keV) has been assumed to represent the luminosity - more precisely: the maximum X-ray flux reached during the respective 35 d Main-On. Here, we question whether the ASM flux is really an accurate measure of the bolometric luminosity of the source. We redetermined the energy of the cyclotron line and performed spectral fits using the combined data from the PCA (3.5–60 keV) and HEXTE (20–75 keV) instruments on RXTE of the same 35 d cycles as used in the original work to determine the bolometric flux from those spectra. We confirm the result of the original analysis that the cyclotron line energy changes by 7% for a change in flux by a factor of two.
Key Words.:
pulsars: individual: – stars: neutron – stars: binaries1 Introduction
Her X-1 is one of the most observed and well-studied accreting binary X-ray pulsars. Since the first observation made by Uhuru, the 35 d periodicity of the source is well known. The X-ray light curve shows two on-states (high X-ray flux) and two off-states (low X-ray flux), with a Main-On ( 7 orbital periods) and a Short-On ( 5 orbital cycles), separated by two off-states ( orbital cycles each). The maximum X-ray flux of the Main-on is higher than the maximum X-ray flux of the Short-On by a factor of three to four.
The modulation of the X-ray flux is believed to be caused by the periodic obscuration of the X-ray source by the precessing disk, which is believed to be inclined and warped (Gerend & Boynton, 1976). The onset of the flux, the turn-on (often identified with 35 d phase 0.0), is believed to occur when the outer rim of the disk opens up the view to the X-ray emitting regions near the polar caps on the surface of the neutron star, while the flux decrease towards the end of the on-states is associated with the inner parts of the disk covering these regions from the observer.
Her X-1 is also the first X-ray pulsar for which a cyclotron line was discovered (Trümper et al., 1978). The discovery of this line-like feature played a key-role in the measurement of the magnetic fields, providing the first direct measurement of the B-field of a neutron star. The energy of the cyclotron line is related to the magnetic field by the formula B12 = (1+z) Ecyc/11.6 keV, where B12 is the magnetic field strength in units of gauss, is the gravitational redshift and Ecyc is the energy of the cyclotron line. This feature is now referred to as a cyclotron resonant scattering feature (CRSF) and seems to be quite common in accreting X-ray pulsars (Coburn et al., 2002). The cyclotron line is an absorption feature produced by the resonant scattering of photons on electrons. In the gauss magnetic field, the electrons are in quantized energy states (with respect to their movement perpendicular to the magnetic field), the so-called Landau levels. The energy levels are nearly equidistantly spaced and photons with energies equal to times the fundamental Landau energy could take part in this scattering.
In a few transient pulsars such as V0332+53 and 4U 0115+63, a negative correlation between the CRSF and the bolometric luminosity of the source has been observed: the energy of the cyclotron line decreases as the X-ray luminosity increases (Mihara et al., 1998; Mowlavi et al., 2006; Nakajima et al., 2006; Tsygankov et al., 2006). Her X-1, however, shows the opposite behavior. Repeated measurements of the cyclotron line energy with different instruments such as RXTE and INTEGRAL in the X-ray spectrum of Her X-1 have revealed a positive correlation between the (pulse phase-averaged) cyclotron line energy Ecyc and the X-ray flux (Staubert et al., 2007), more precisely with the maximum X-ray flux observed during the Main-On of the respective 35 d cycle, as measured by RXTE/ASM in the 2–10 keV range, which is assumed to be characteristic of the current accretion state and luminosity of the source. It has, however, been questioned whether the 2–10 keV flux can really be taken as representative of the bolometric luminosity.
In this paper, we attempt to answer this question by re-analysing the RXTE observations of the same 35 d cycles as used in the original analysis of Staubert et al. (2007). Using data from both instruments (PCA and HEXTE), we re-determine the cyclotron line energy and measure the 3.5–60 keV bolometric X-ray flux by performing spectral analyses of eleven Main-Ons between 1996 and 2005. We show that the 2–10 keV flux is a good measure of the bolometric flux and that the positive correlation between the phase-averaged cyclotron line energy Ecyc and the maximum 35 d flux, or the luminosity, is confirmed.
| Observation | 35 d Main-On | Center |
|---|---|---|
| month/year | cycle number 1 | MJD |
| July 96 | 257 | 50029.75 |
| September 97 | 269 | 50707.06 |
| December 00 | 303 | 51897.69 |
| January 01 | 304 | 51933.67 |
| May 01 | 307 | 52035.48 |
| June 01 | 308 | 52071.16 |
| August 02 | 320 | 52492.96 |
| November 02 | 323 | 52599.32 |
| December 02 | 324 | 52634.01 |
| October 04 | 343 | 53300.95 |
| July 05 | 351 | 53577.35 |
1 Cycle numbering according to Staubert et al. (2009)
2 Observations
Her X-1 has been repeatedly observed by RXTE since 1996. We analyzed observations of eleven 35 d Main-Ons for which there was photon statistics of sufficient high quality to allow a spectral analysis. Those cycles were those of numbers (nos.) 257, 269, 303, 304, 307, 308, 320, 323, 324, 343 and 351. For the definition of cycle counting we refer to Staubert et al. (2009) (cycle no. 313 was not included, despite the high quality statistics, because no ASM observations were available). We cover a period of ten years of observation from July 1996 (no. 257) to July 2005 (no. 351), see Table 1. Here we used data from both RXTE instruments: PCA in the energy range 3.5–60 keV, and HEXTE in the energy range 20–75 keV.
3 Spectral analysis
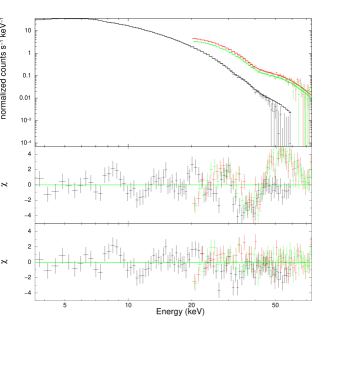
For the spectral analysis, we used XSPEC111http://heasarc.gsfc.nasa.gov/docs/xanadu/xspec (12.6.0) and generated spectra for all observed Main-Ons, summing all available data. For each spectrum (one for each Main-On), two quantities were determined: the central energy Ecyc of the cyclotron absorption feature and the integrated flux in the range 3.5–60 keV (in units of ). As the spectral function, we used the highecut1 model (based on a power-law continuum with an exponential cut-off) and a multiplicative Gaussian absorption line for the cyclotron resonant scattering feature (CRSF), in the same way as e.g. Coburn et al. (2002) and Staubert et al. (2007). Data from both RXTE instruments were used: PCA (PCU2 only) in the energy range 3.5–60 keV, and HEXTE in the energy range 20–75 keV. Cold material absorption was taken into account in each fit. All values were consistent to within two standard deviations with the mean value of = cm-2. We note that in the original analysis PCA data were used only up to 25 keV to define the continuum at the lower energies. New response matrices are now available222http://www.universe.nasa.gov/xrays/programs/rxte/pca/doc/rmf/ pcarmf-11.7 that allow us to use the PCA up to 50 keV, but we found that the PCA can indeed be used up to 60 keV, thereby contributing information about the cyclotron line around 40 keV. This choice is confirmed by the agreement between the PCA and HEXTE spectra in the overlapping region of the two instruments (40–60 keV). This is also confirmed in the analysis by Rothschild et al. (2011) of RXTE observations of Cen A in which PCA data were successfully used up to 60 keV. In the new spectral fits, we also added systematic uncertainties of 0.5% (which are recommended for use with the new response matrices2), while in the original analysis by Staubert et al. (2007) 1% uncertainty was added.
For this spectral re-analysis, only data of RXTE PCU2 were used to ensure maximum uniformity in the data set, analyzed in a uniform way. Fig. 1 shows an example of a spectral fit to data of July 1996 (cycle no. 257). The observation is centered at MJD 52599.36 and the total integration time is 31 ks for PCA/PCU2 and 10 ks for each of the two HEXTE clusters.
The bolometric flux for the individual spectra was found by integrating the fit function (over the 3.5–60 keV range), using the XSPEC routine flux1. The X-ray flux of Her X-1 varies as a function of phase of the 35 d modulation because of variable absorption by the accretion disk.


| 35 d cycle | Ecyc(1) [keV] | max. flux (2–10 keV) | Ecyc(2) [keV] | max. flux (3.5–60 keV) 2 |
|---|---|---|---|---|
| number1 | ASM [] | [] | ||
| (Staubert et al. (2007)) | (Staubert et al. (2007)) | (this work) | (this work) | |
| 257 | ||||
| 269 | ||||
| 303 | ||||
| 304 | ||||
| 307 | ||||
| 308 | ||||
| 320 | ||||
| 323 | ||||
| 324 | ||||
| 343 | ||||
| 351 |
1 Note that for 35 d cycle numbers 303 and larger the corresponding numbers
in Staubert et al. (2007) are larger by 1. This reflects the observation that there must have been an extra
cycle during the long anomalous low before cycle 303. However, using the numbers as given here
allows to use them in an ephemeris for a rough prediction of the 35 d turn-ons using a mean period of 35.88 d.
We do not doubt the physical reality of the extra cycle found by Staubert et al. (2007).
2 The flux in Col. 5 represents the 35 d maximum flux in the 3.5–60 keV range (see text).
The sampling of the various Main-Ons in groups of pointed observations was rather different, and the fluxes determined from the spectra are mean values of the observations, which happened to be made at different phases of the 35 d modulation.These fluxes cannot directly be compared to the maximum X-ray flux of the respective Main-On. To find the comparable bolometric fluxes in the 3.5–60 keV range that represent the maximum flux for the particular cycle, it was necessary to scale the fluxes found in the individual spectra to the maximum flux. The scaling factor is the ratio of the maximum flux to the mean flux of the complete light curve, that is of the same data used to generate the spectra. To find the maximum flux, all observed RXTE/PCA light curves were fitted by a function representing a template of the mean 35 d Main-On modulation, the shape of which was taken from an overlay of many 35 d light curves observed by RXTE/ASM (see e.g. Klochkov et al. 2006). For this procedure, we are only interested in the overall 35 d modulation, that is without eclipses and dips, which was described by the analytical function:


under the condition that negative functional values are set to zero. Here is the flux as a function of time in MJD, is the amplitude in units of (3-20 keV) PCA per PCU, =1.25, =1.87, and =0.80 are fixed functional parameters, is the time reference in MJD, and =+8.4 d (this offset represents the length of the standard Main-On). The time of reference was fixed to the MJD of the turn-on that had been determined from the corresponding ASM light curve. The amplitude is the only free-fitting parameter. The maximum of the fitting function (on average found to be equal to -5.4 ) is then taken as the maximum flux (in units of PCA ) for this cycle. Dividing this maximum flux by the corresponding mean flux of the complete light curve (containing all the photons that are also used in generating the corresponding spectrum) leads to a scaling factor. Multiplying the 3.5–60 keV flux found from the spectra by this scaling factor then leads to the maximum bolometric flux (in units of ). These bolometric flux values can now be compared to the maximum ASM flux values used in the earlier work by Staubert et al. (2007).
To test whether the above procedure in determining the maximum bolometric fluxes could be influenced by systematic changes of the spectral shape over the 35 d phase, we have investigated spectra of cycle no. 323 which provides a good coverage of a complete Main-On. Systematic changes were only found in one spectral parameter, the power-law index, with a magnitude of %, which corresponds to a negligible relative change of the integrated flux of less than .
The uncertainties in the bolometric flux values are dominated by the uncertainties in the scaling factors, which in turn are dominated by systematic uncertainties in determining the maximum Main-On flux in fitting the observed light curve by the common analytical function. These systematic uncertainties are estimated to be 3%, the main contributions being the uncertainty in the turn-on time and the fluctuations in the shape of the modulation from cycle to cycle.
Table 2 compares the results of this re-analysis to those of the original analysis by Staubert et al. (2007).
4 Results and discussion
In Fig. 2 (left), we plot the newly determined cyclotron line energies against those from the original analysis. Overall, we find a very good agreement between the new values for Ecyc and those from the original analysis: considering the respective uncertainties, the differences are smaller than 0.79 standard deviations for ten of the eleven values and 2.1 standard deviations for one value (cycle no. 323).
In Fig. 2 (right), the 3.5–60 keV maximum bolometric fluxes are plotted against the corresponding ASM fluxes of the original analysis. There is a good linear relationship between the two fluxes: the slope (taking the uncertainties in both variables into account) is 0.88 ()/(ASM cts s-1), and the Pearson correlation coefficient is 0.82, corresponding to a chance probability of no correlation of P. This demonstrates that the maximum ASM flux can be taken as a good measure of the maximum bolometric X-ray flux (and luminosity) of Her X-1 during the respective 35 d cycle. The variation in flux from one 35 d cycle to the next is small, such that the maximum observed flux of a particular 35 d Main-On can be considered a good measure of the luminosity of the source during this particular cycle. This is why the maximum ASM flux was used as a reference in the original analysis by Staubert et al. (2007).
The final correlation between the cyclotron line energy and the X-ray flux is given in Fig. 3 in two ways: we correlate Ecyc from the re-analysis with the scaled 3.5–60 keV maximum Main-On flux (Fig. 3, left), as well as the maximum ASM flux (Fig. 3, right). The corresponding slopes of the linear fits to these data (taking the uncertainties of both variables into account) and the corresponding Pearson correlation coefficients r are: (i) for the Main-On flux presented in Fig. 3 (left) slope = 0.62 (keV)/() and r = 0.62 (P=); (ii) for the maximum ASM flux presented in Fig. 3 (right) slope = 0.67 (keV)/(ASM cts s-1) and r = 0.90 (P=).
The correlation seen in Fig. 3 (left) is somewhat less convincing than that of Fig. 3 (right) (and that in the original analysis of Staubert et al. 2007). We attribute this to the unavoidably larger uncertainties associated mainly with the scaling of the bolometric flux measured for the individual spectrum to the flux that does describe the maximum flux of the particular 35 d cycle. The originally used maximum ASM fluxes are, in contrast, simple direct measurements.
5 Summary
We have re-analyzed observations of Her X-1 in its Main-On state by RXTE between 1996 and 2005 with respect to its X-ray spectrum. Using data from both instruments (PCA and HEXTE) we performed a spectral analysis of observations of eleven Main-Ons and determined the cyclotron line energy Ecyc and the 3.5–60 keV flux for each of those Main-Ons. This observed flux was then scaled to a flux representing the maximum flux of the particular Main-On. We conclude that the maximum ASM flux used in the original analysis (Staubert et al., 2007) can really be taken as a measure of the luminosity of the source because it scales well with the maximum 5–60 keV flux estimated through the spectral analysis. This is evident from Fig. 2 (right) that shows there is a good linear relationship between the bolometric 3.5–60 keV flux with the 2–10 keV flux measured by RXTE/ASM (both fluxes refer to the maximum 35 d Main-On flux).
The information contained in Figs. 2 and 3 (left and right) provides an internally consistent picture. We consider the combined evidence of all the correlations shown as proof of the correctness of the positive correlation between the cyclotron line energy and source luminosity as suggested in Staubert et al. (2007). A direct comparison to the original analysis can be made by considering Fig. 3 (right): the slope of the linear best fit is determined to (0.67) keV/(), which is in good agreement with the (0.66) keV/() found in the original analysis. The final and confirmed result with respect to this correlation can then be stated as follows: the value of the cyclotron line energy Ecyc increases by 7% for a change in flux of a factor of two.
In conclusion, we briefly describe the physical significance of the observed dependence - of either sign - of the cyclotron line energy with source luminosity. The negative correlation (decrease of Ecyc with luminosity), which has been repeatedly observed for high luminosity transients such as V 0332+53 and 4U 0115+63 (Mihara et al., 1998; Mowlavi et al., 2006; Nakajima et al., 2006; Tsygankov et al., 2006), has been interpreted in the following way: when the mass accretion rate (and hence the luminosity) increases, the height of the radiative shock above the neutron star surface increases, leading to a decrease in the effective magnetic field strength in the scattering region and therefore to a decrease in Ecyc. This is in line with theoretical considerations about accretion in the (locally) super-Eddington regime (Burnard et al., 1991). In the sub-Eddington regime, however, believed to be realized in Her X-1, the deceleration of the accreted material is thought to be due to Coulomb drag and collective plasma effects (Nelson et al., 1993). In this case, under an increased accretion rate the atmosphere is compressed by the ram pressure of the infalling material and the scattering region moves closer to the neutron star surface. This is equivalent to an increase in effective field strength and an increase in Ecyc, hence to a positive correlation with luminosity (Staubert et al., 2007).
We would also like to add that the recent analysis of Klochkov et al. (2011) supports the physical correlation between the cyclotron line energy and the luminosity of three sources: 4U 0115+63, V 0332+53, and Her X-1. In this analysis data from a short time interval were used, and spectra were generated by summing up photons belonging to individual pulses in selected ranges of pulse amplitude. In this pulse-to-pulse variability study, the variations in X-ray flux (source luminosity) occur on timescales comparable to the duration of the individual pulses (the period of rotation of the neutron star). The previously found correlations (based on flux variations on much longer timescales) between the cyclotron line energy and the X-ray flux are reproduced: that is a negative correlation for the super-Eddington transient sources 4U 0115+63 and V 0332+53, and a positive correlation for the sub-Eddington source Her X-1.
Acknowledgements.
D.V. and coauthors thank DLR for financial support through grant 50 OR 0702References
- Burnard et al. (1991) Burnard, D., Arons, J., & Klein, R. 1991, ApJ, 367, 575
- Coburn et al. (2002) Coburn, W., Heindl, W. A., Rothschild, R. E., et al. 2002, ApJ, 580, 394
- Gerend & Boynton (1976) Gerend, D. & Boynton, P. 1976, ApJ, 209, 562
- Klochkov et al. (2011) Klochkov, D., Santangelo, A., Staubert, R., & Rothschild, R. 2011, in Proc. 8th INTEGRAL Workshop ”The Restless Gamma-ray Universe”, PoS(INTEGRAL2010)061
- Klochkov et al. (2006) Klochkov, D. K., Shakura, N. I., Postnov, K. A., et al. 2006, Astronomy Letters, 32, 804
- Mihara et al. (1998) Mihara, T., Makishima, K., & Nagase, F. 1998, Advances in Space Research, 22, 987
- Mowlavi et al. (2006) Mowlavi, N., Kreykenbohm, I., Shaw, S. E., et al. 2006, A&A, 451, 187
- Nakajima et al. (2006) Nakajima, M., Mihara, T., Makishima, K., & Niko, H. 2006, ApJ, 646, 1125
- Nelson et al. (1993) Nelson, R., Salpeter, E., & Wassermann, I. 1993, ApJ, 418, 874
- Rothschild et al. (2011) Rothschild, R. E., Markowitz, A., Rivers, E., et al. 2011, ApJ, 733, 23
- Staubert et al. (2009) Staubert, R., Klochkov, D., Postnov, K., et al. 2009, A&A, 494, 1025
- Staubert et al. (2007) Staubert, R., Shakura, N. I., Postnov, K., et al. 2007, A&A, 465, L25
- Trümper et al. (1978) Trümper, J., Pietsch, W., Reppin, C., et al. 1978, ApJ, 219, L105
- Tsygankov et al. (2006) Tsygankov, S. S., Lutovinov, A. A., Churazov, E. M., & Sunyaev, R. A. 2006, MNRAS, 371, 19