Charmonium & Bottomonium at e+​eβˆ’superscript𝑒superscript𝑒e^{+}e^{-} colliders

Valentina Santoro 111on behalf of the BABAR Collaboration

INFN Ferrara , via Saragat 1, Ferrara, 44122, Italy

Abstract


We review recent charmonium and bottomonium spectroscopy results from the B-factories Belle and BABAR . A particular focus is given to the new Ξ·c​(1​S)subscriptπœ‚π‘1𝑆\eta_{c}(1S) and Ξ·c​(2​S)subscriptπœ‚π‘2𝑆\eta_{c}(2S) measurement and to the radiative transitions from Ξ₯​(2​S)Ξ₯2𝑆\Upsilon(2S) and Ξ₯​(3​S)Ξ₯3𝑆\Upsilon(3S) with converted photons.

PRESENTED AT


The Ninth International Conference on
Flavor Physics and CP Violation
(FPCP 2011)
Maale Hachamisha, Israel, May 23–27, 2011

1 Introduction

In the last few years, quarkonium spectroscopy received significant contributions from the B-Factories BABAR and Belle. The impressive amount of data recorded by the two experiments allowed to study rare decay chains and to look for undiscovered resonances in the charmonium and bottomonium mass regions. The results presented here are based on different subsamples collected by the two experiments not only at the Ξ₯​(4​S)Ξ₯4𝑆\Upsilon(4S) but also at the Ξ₯​(3​S)Ξ₯3𝑆\Upsilon(3S) and Ξ₯​(2​S)Ξ₯2𝑆\Upsilon(2S) center mass energy.

2 Charmonium Spectroscopy

The charmonium spectrum consists of eight narrow states below the open charm threshold (3.73GeV) and several tens of states above the threshold, some of them wide (because they decay to D​D¯𝐷¯𝐷D\overline{D}), some of them still narrow, because their decay to open charm is forbidden by some conservation rule. Below the threshold almost all states are well established, with the possible exception of the 11​P1​(hc)superscript11subscript𝑃1subscriptβ„Žπ‘1^{1}P_{1}~{}(h_{c}) which has been observed recently but whose properties still need to be measured accurately. On the other hand, very little is known above the threshold. Only one state has been positively identified as a charmonium D𝐷D state, the Οˆβ€‹(3770)πœ“3770\psi(3770), then there are several new β€œCharmonium-like” states that are very difficult to accommodate in the charmonium spectrum.
The B-factories are an ideal place to study charmonium since charmonium states are copiously produced in a variety of processes:

  • β€’

    B decays: B mesons decay to charmonium in about 3% of cases.

  • β€’

    β€œDouble-charmonium production”: in this process, observed for the first time by Belle [1], a J/Οˆπ½πœ“J/\psi or a Οˆβ€‹(2​S)πœ“2𝑆\psi(2S) is produced together and exclusively with another charmonium state.

  • β€’

    γ​γ𝛾𝛾\gamma\gamma fusion: in this process two virtual photons are emitted by the colliding e+​eβˆ’superscript𝑒superscript𝑒e^{+}e^{-} pair (e+eβˆ’β†’e+eβˆ’Ξ³βˆ—Ξ³βˆ—β†’e+eβˆ’(ccΒ―)(e^{+}e^{-}\to e^{+}e^{-}\gamma^{*}\gamma^{*}\to e^{+}e^{-}(c\overline{c})). States with C=+1 are formed.

  • β€’

    Initial state radiation (ISR): where a photon is emitted by the incoming electron or positron (e+​eβˆ’β†’Ξ³β€‹(c​cΒ―))β†’superscript𝑒superscript𝑒𝛾𝑐¯𝑐(e^{+}e^{-}\to\gamma(c\overline{c})), only states with JP​C=1βˆ’βˆ’superscript𝐽𝑃𝐢superscript1absentJ^{PC}=1^{--} are formed.

2.1 Ξ·c​(1​S)subscriptπœ‚π‘1𝑆\eta_{c}(1S) & Ξ·c​(2​S)subscriptπœ‚π‘2𝑆\eta_{c}(2S)

The Ξ·c​(1​S)subscriptπœ‚π‘1𝑆\eta_{c}(1S) was discovered by Crystal BALL in 1980 [2] after that this resonance has been measured by several different experiments [3, 4, 5, 6, 7] with a large spread in the width measurements: in the case of J/Οˆπ½πœ“J/\psi and Οˆβ€‹(2​S)πœ“2𝑆\psi(2S) radiative decays its width is around 15 MeV while in B-decays and in γ​γ𝛾𝛾\gamma\gamma fusion is around 30MeV. The Ξ·c​(2​S)subscriptπœ‚π‘2𝑆\eta_{c}(2S) was discovered by BELLE in 2002 [8] and until recently it has only been observed in exclusive decay to K​KΒ―β€‹Ο€πΎΒ―πΎπœ‹K\overline{K}\pi. Precise measurement on m​(Ξ·c​(2​S))π‘šsubscriptπœ‚π‘2𝑆m(\eta_{c}(2S)) will help discriminate among different charmonium models.
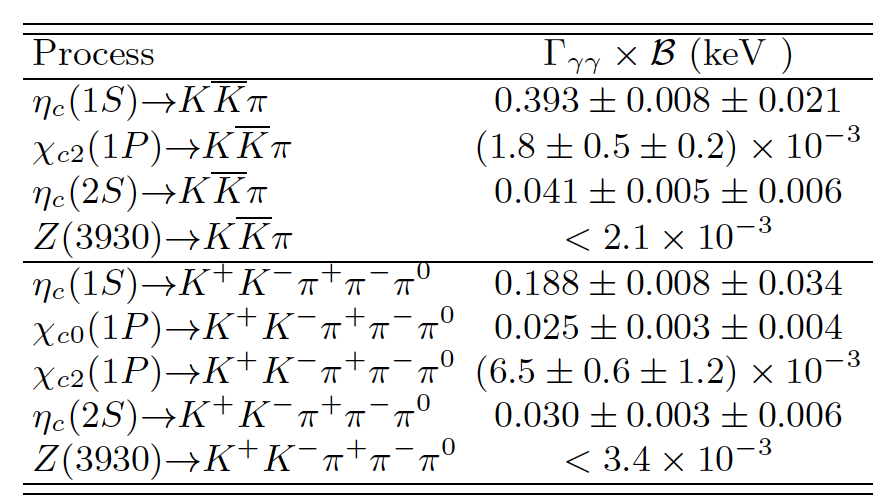
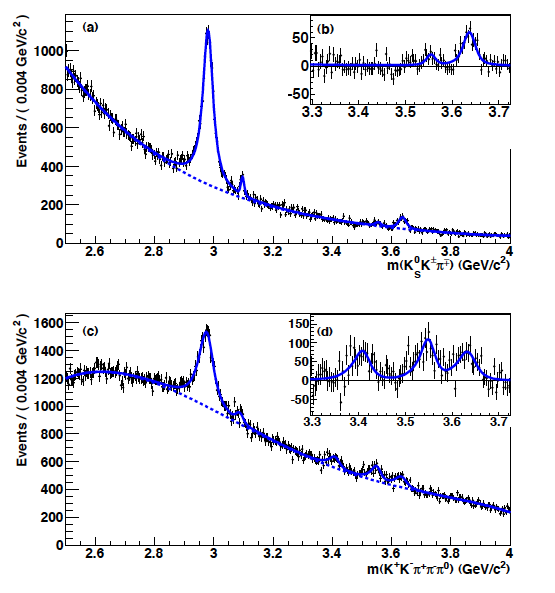
BABAR studied using 519.2 f​bβˆ’1𝑓superscript𝑏1fb^{-1}[9] collected at the Ξ₯​(4​S)Ξ₯4𝑆\Upsilon(4S), Ξ₯​(3​S)Ξ₯3𝑆\Upsilon(3S) and Ξ₯​(2​S)Ξ₯2𝑆\Upsilon(2S) the processes e+​eβˆ’β†’e+​eβˆ’β€‹Ξ³β€‹Ξ³β†’superscript𝑒superscript𝑒superscript𝑒superscript𝑒𝛾𝛾e^{+}e^{-}\to e^{+}e^{-}\gamma\gamma β†’e+​eβˆ’β€‹fβ†’absentsuperscript𝑒superscript𝑒𝑓\to e^{+}e^{-}f where f𝑓f denotes K+​Kβˆ’β€‹Ο€+β€‹Ο€βˆ’β€‹Ο€0superscript𝐾superscript𝐾superscriptπœ‹superscriptπœ‹superscriptπœ‹0K^{+}K^{-}\pi^{+}\pi^{-}\pi^{0} or KS0​KΒ±β€‹Ο€βˆ“superscriptsubscript𝐾𝑆0superscript𝐾plus-or-minussuperscriptπœ‹minus-or-plusK_{S}^{0}K^{\pm}\pi^{\mp} final states. The allowed JP​Csuperscript𝐽𝑃𝐢J^{PC} values of the initial state are 0Β±+,2Β±+,4Β±+,…;3++,5++superscript0plus-or-minusabsentsuperscript2plus-or-minusabsentsuperscript4plus-or-minusabsent…superscript3absentsuperscript5absent0^{\pm+},2^{\pm+},4^{\pm+},...;3^{++},5^{++}. Angular momentum, parity conservation, and charge conjugation invariance, then imply that these quantum numbers apply to the final states f𝑓f also, except that the KS0​KΒ±β€‹Ο€βˆ“superscriptsubscript𝐾𝑆0superscript𝐾plus-or-minussuperscriptπœ‹minus-or-plusK_{S}^{0}K^{\pm}\pi^{\mp} state cannot have JP=0+superscript𝐽𝑃superscript0J^{P}=0^{+}. The KS0​KΒ±β€‹Ο€βˆ“superscriptsubscript𝐾𝑆0superscript𝐾plus-or-minussuperscriptπœ‹minus-or-plusK_{S}^{0}K^{\pm}\pi^{\mp} and K+​Kβˆ’β€‹Ο€+β€‹Ο€βˆ’β€‹Ο€0superscript𝐾superscript𝐾superscriptπœ‹superscriptπœ‹superscriptπœ‹0K^{+}K^{-}\pi^{+}\pi^{-}\pi^{0} mass spectra are shown on Fig. 1. There are signals at the position of the Ξ·c​(1​S)subscriptπœ‚π‘1𝑆\eta_{c}(1S), J/Οˆπ½πœ“J/\psi, Ο‡c​0​(1​P)subscriptπœ’π‘01𝑃\chi_{c0}(1P), Ο‡c​2​(1​P)subscriptπœ’π‘21𝑃\chi_{c2}(1P) and Ξ·c​(2​S)subscriptπœ‚π‘2𝑆\eta_{c}(2S) states. The mass and the width of the Ξ·c​(1​S)subscriptπœ‚π‘1𝑆\eta_{c}(1S) and Ξ·c​(2​S)subscriptπœ‚π‘2𝑆\eta_{c}(2S), extracted using a binned extended maximum likelihood fit, are respectively 2982.5Β±0.4Β±1.4​MeV/c2plus-or-minus2982.50.41.4MeVsuperscriptc22982.5\pm 0.4\pm 1.4~{}\mathrm{MeV/c^{2}}, 3638.5Β±1.5Β±0.8​MeV/c2plus-or-minus3638.51.50.8MeVsuperscriptc23638.5\pm 1.5\pm 0.8~{}\mathrm{MeV/c^{2}} and 32.1Β±1.1Β±1.3​MeVplus-or-minus32.11.11.3MeV32.1\pm 1.1\pm 1.3~{}\mathrm{MeV}, 13.4Β±4.6Β±3.2​MeVplus-or-minus13.44.63.2MeV13.4\pm 4.6\pm 3.2~{}\mathrm{MeV}. The results for Γγ​γ×ℬsubscriptΓ𝛾𝛾ℬ\Gamma_{\gamma\gamma}\times\cal{B} for each resonance in K​KΒ―β€‹Ο€πΎΒ―πΎπœ‹K\overline{K}\pi and K+​Kβˆ’β€‹Ο€+β€‹Ο€βˆ’β€‹Ο€0superscript𝐾superscript𝐾superscriptπœ‹superscriptπœ‹superscriptπœ‹0K^{+}K^{-}\pi^{+}\pi^{-}\pi^{0} are reported in Fig. 2. The first uncertainty is statistical, the second systematic. Upper limits are computed at 90% confidence level.
Another recent result on the Ξ·c​(1​S)subscriptπœ‚π‘1𝑆\eta_{c}(1S) and Ξ·c​(2​S)subscriptπœ‚π‘2𝑆\eta_{c}(2S) is the study of the BΒ±β†’K±​ηc​(1​S)β†’superscript𝐡plus-or-minussuperscript𝐾plus-or-minussubscriptπœ‚π‘1𝑆B^{\pm}\to K^{\pm}\eta_{c}(1S) and BΒ±β†’K±​ηc​(2​S)β†’superscript𝐡plus-or-minussuperscript𝐾plus-or-minussubscriptπœ‚π‘2𝑆B^{\pm}\to K^{\pm}\eta_{c}(2S) performed by Belle [10]. Using 492 f​bβˆ’1𝑓superscript𝑏1fb^{-1} the Ξ·c​(1​S)subscriptπœ‚π‘1𝑆\eta_{c}(1S) and Ξ·c​(2​S)subscriptπœ‚π‘2𝑆\eta_{c}(2S) are reconstructed in the KS​K​πsubscriptπΎπ‘†πΎπœ‹K_{S}K\pi channel, in addition to these resonances is also found the presence of signal with the same final state of the resonant decay. This contribution is referred as the non-resonant contribution. Since the final state is the same, this amplitude interferes with the resonant component. The mass and the width for the Ξ·c​(1​S)subscriptπœ‚π‘1𝑆\eta_{c}(1S) are similar with and without interference but in the case of the Ξ·c​(2​S)subscriptπœ‚π‘2𝑆\eta_{c}(2S) the width for the interference hypothesis is: 6.6βˆ’5.1βˆ’0.9+8.4+2.6​MeVsubscriptsuperscript6.68.42.65.10.9MeV6.6^{+8.4+2.6}_{-5.1-0.9}\mathrm{MeV} while for the no interference hypothesis is 41.1Β±12.0βˆ’10.9+6.4​MeVplus-or-minus41.1subscriptsuperscript12.06.410.9MeV41.1\pm 12.0^{+6.4}_{-10.9}~{}\mathrm{MeV}. This result suggests that the interference effect is important.
Refer to caption
Figure 1: Fit to the KS0​KΒ±β€‹Ο€βˆ“superscriptsubscript𝐾𝑆0superscript𝐾plus-or-minussuperscriptπœ‹minus-or-plusK_{S}^{0}K^{\pm}\pi^{\mp} (a) and K+​Kβˆ’β€‹Ο€+β€‹Ο€βˆ’β€‹Ο€0superscript𝐾superscript𝐾superscriptπœ‹superscriptπœ‹superscriptπœ‹0K^{+}K^{-}\pi^{+}\pi^{-}\pi^{0} (c) mass spectra. The solid curves represent the total fit functions and the dashed curves show the combinatorial background contributions. The background-subtracted distributions are shown in (b) and (d).
Refer to caption
Figure 2: Results for Γγ​γ×ℬsubscriptΓ𝛾𝛾ℬ\Gamma_{\gamma\gamma}\times{\cal B} for each resonaces in K​KΒ―β€‹Ο€πΎΒ―πΎπœ‹K\overline{K}\pi and K+​Kβˆ’β€‹Ο€+β€‹Ο€βˆ’β€‹Ο€0superscript𝐾superscript𝐾superscriptπœ‹superscriptπœ‹superscriptπœ‹0K^{+}K^{-}\pi^{+}\pi^{-}\pi^{0} final states.

3 Bottomonium Spectroscopy

The bound states of b​b¯𝑏¯𝑏b\overline{b}, the bottomonium states, are the heaviest and most compact bound states of quarks and anti quarks in nature. Spectroscopic measurements of fine and hyperfine structure splittings of hadronic and radiative transitions in the bottomonium system are very important since they allow to test calculations of NRQCD, QCDME and lattice QCD.
The B-factories are not usually considered ideal facilities for the study of the bottomonium spectrum since their energy is tuned to the peak of the Ξ₯​(4​S)Ξ₯4𝑆\Upsilon(4S) resonance, which decays in almost 100% of cases to a B​B¯𝐡¯𝐡B\overline{B} pair. But both BABAR and Belle have recorded data samples at various energies in the bottomonium region that made possible to perform several measurements in the bottomonium sector and discoveries like the Ξ·b​(1​S)​[11]subscriptπœ‚π‘1𝑆[11]\eta_{b}(1S)\cite[cite]{[\@@bibref{}{:2008vj}{}{}]}, hb​(1​P)subscriptβ„Žπ‘1𝑃h_{b}(1P)[12, 13] and hb​(2​P)subscriptβ„Žπ‘2𝑃h_{b}(2P) [13].

4 Radiative transitions from the Ξ₯​(2​S,3​S)Ξ₯2𝑆3𝑆\Upsilon(2S,3S) with converted photons

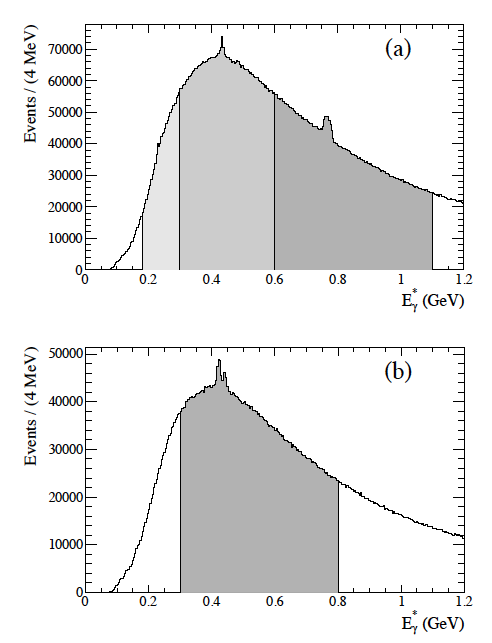
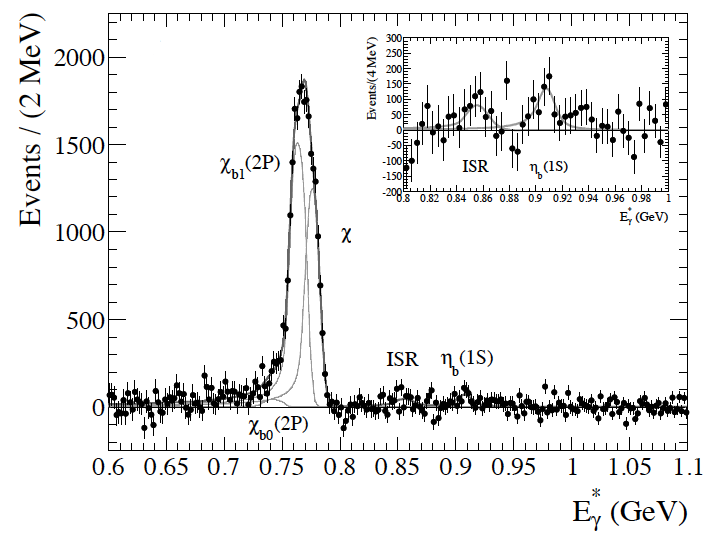
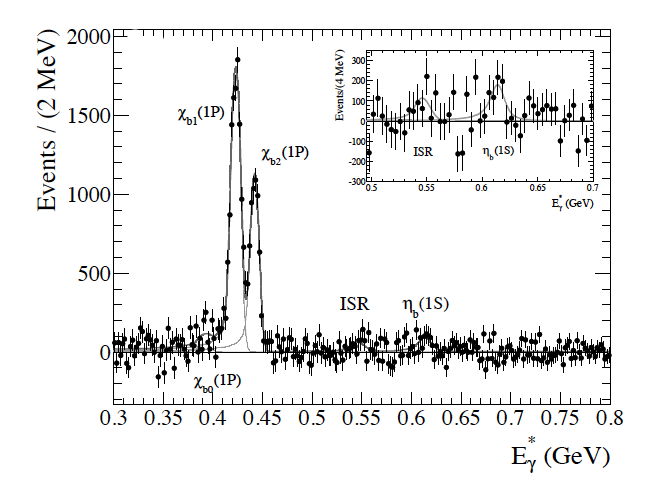
BABAR studied the radiative transitions from the Ξ₯​(2​S,3​S)Ξ₯2𝑆3𝑆\Upsilon(2S,3S) [14] using photons converted to e+​eβˆ’superscript𝑒superscript𝑒e^{+}e^{-} pairs in the detector material, leading to a large improvement in the EΞ³βˆ—subscriptsuperscript𝐸𝛾E^{*}_{\gamma} resolution at the cost of a reduced event yield. The signals appear as peaks in the inclusive photon energy spectra: E(Ξ³)C​M=((s)2βˆ’mf​i​n​a​l​s​t​a​t​e2)/2s)E(\gamma)_{CM}=((\sqrt{s})^{2}-m^{2}_{final~{}state})/2\sqrt{s}). Fig. 3 shows the inclusive distributions of the resulting reconstructed converted photon energy. The data are divided into four energy ranges, as indicated by the shaded regions in Fig. 3. These ranges and the corresponding bottomonium transitions of interest are, in Ξ₯​(3​S)Ξ₯3𝑆\Upsilon(3S) data:

  • β€’

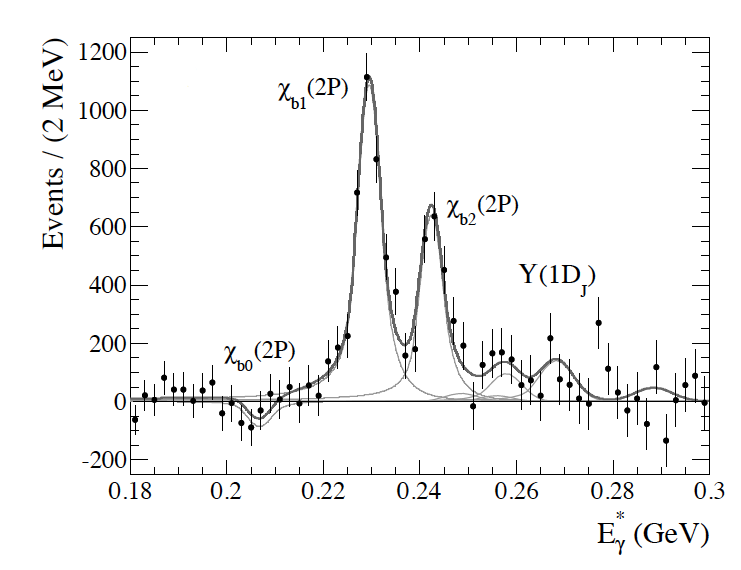
    180≀EΞ³βˆ—β‰€300​M​e​V180subscriptsuperscript𝐸𝛾300MeV180\leq E^{*}_{\gamma}\leq 300\mathrm{MeV}: the main purpose of the fit to this region is to study the transitions Ο‡b​J​(2​P)→γ​Ξ₯​(2​S)β†’subscriptπœ’π‘π½2𝑃𝛾Ξ₯2𝑆\chi_{bJ}(2P)\rightarrow\gamma\Upsilon(2S). The corresponding background subtracted plot is shown on Fig. 4.(a). There are clear peaks for Ο‡b​J​(2​P)subscriptπœ’π‘π½2𝑃\chi_{bJ}(2P) and even a hint for the Y​(1​D)π‘Œ1𝐷Y(1D).

  • β€’

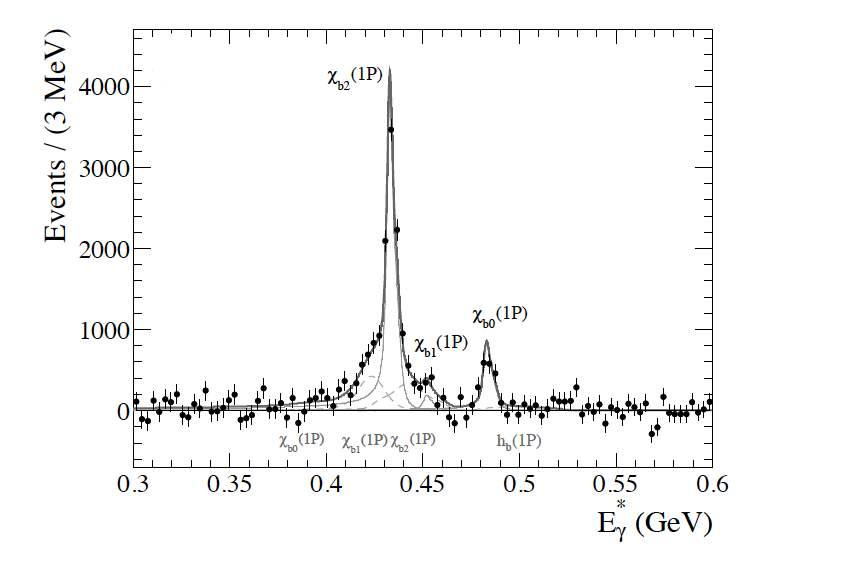
    300≀EΞ³βˆ—β‰€600​M​e​V::300subscriptsuperscript𝐸𝛾600MeVabsent300\leq E^{*}_{\gamma}\leq 600\mathrm{MeV}: the main purpose of the fit to this region is to study the transitions Ξ₯​(3​S)→γ​χb​J​(1​P)β†’Ξ₯3𝑆𝛾subscriptπœ’π‘π½1𝑃\Upsilon(3S)\rightarrow\gamma\chi_{bJ}(1P). The corresponding background subtracted plot is shown on Fig. 4.(b). The clear peaks for Ο‡b​J​(1​P)subscriptπœ’π‘π½1𝑃\chi_{bJ}(1P) are the most precise measurement for the transitions Ξ₯​(3​S)→γ​χb​0,2​(1​P)β†’Ξ₯3𝑆𝛾subscriptπœ’π‘021𝑃\Upsilon(3S)\rightarrow\gamma\chi_{b0,2}(1P).

  • β€’

    600≀EΞ³βˆ—β‰€1100​M​e​V::600subscriptsuperscript𝐸𝛾1100MeVabsent600\leq E^{*}_{\gamma}\leq 1100\mathrm{MeV}: the main purpose of the fit to this region is to study the transitions Ο‡b​J​(2​P)→γ​Ξ₯​(1​S)β†’subscriptπœ’π‘π½2𝑃𝛾Ξ₯1𝑆~{}\chi_{bJ}(2P)\rightarrow\gamma\Upsilon(1S) and to look for Ξ₯​(3​S)→γ​ηb​(1​S)β†’Ξ₯3𝑆𝛾subscriptπœ‚π‘1𝑆\Upsilon(3S)\to\gamma\eta_{b}(1S). The corresponding background subtracted plot is shown on Fig. 4.(c). There are clear peaks for Ο‡b​J​(2​P)subscriptπœ’π‘π½2𝑃\chi_{bJ}(2P), but there is no significance evidence for Ξ·b​(1​S)subscriptπœ‚π‘1𝑆\eta_{b}(1S).

and in the Ξ₯​(2​S)Ξ₯2𝑆\Upsilon(2S) data:

  • β€’

    300≀EΞ³βˆ—β‰€800​M​e​V::300subscriptsuperscript𝐸𝛾800MeVabsent300\leq E^{*}_{\gamma}\leq 800\mathrm{MeV}: the main purpose of the fit to this region is to study the transitions Ο‡b​J​(1​P)→γ​Ξ₯​(1​S)β†’subscriptπœ’π‘π½1𝑃𝛾Ξ₯1𝑆\chi_{bJ}(1P)\rightarrow\gamma\Upsilon(1S) and Ξ₯​(2​S)→γ​ηb​(1​S)β†’Ξ₯2𝑆𝛾subscriptπœ‚π‘1𝑆\Upsilon(2S)\rightarrow\gamma\eta_{b}(1S). The corresponding background subtracted plot is shown on Fig. 4.(d). There are clear peaks for Ο‡b​J​(1​P)subscriptπœ’π‘π½1𝑃\chi_{bJ}(1P), and a hint for the Ξ·b​(1​S)subscriptπœ‚π‘1𝑆\eta_{b}(1S).

Refer to caption
Figure 3: Inclusive converted photon energy spectrum from (a) Ξ₯​(3​S)Ξ₯3𝑆\Upsilon(3S) and (b) Ξ₯​(2​S)Ξ₯2𝑆\Upsilon(2S) decays. The shaded areas indicate different regions of interest considered in details in this analysis.
Refer to caption
Refer to caption
Refer to caption
Refer to caption
Figure 4: Fit to the inclusive converted photon energy mass spectrum for different energies of the Ξ₯​(3​S)Ξ₯3𝑆\Upsilon(3S) and Ξ₯​(2​S)Ξ₯2𝑆\Upsilon(2S) data.
Refer to caption
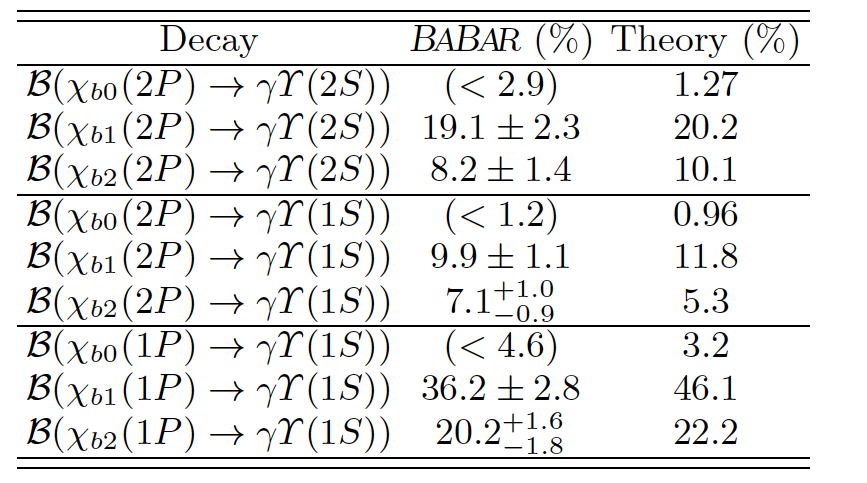
Figure 5: Comparison of the experimental branching fraction from the BABAR results and some theoretical predictions [15].

The measured branching fractions with the comparison with the theoretical predictions are shown in Fig. 5. There is a good overall agreement between theory [15] and experiment.

5 Inclusive dipion transition in Ξ₯​(3​S)Ξ₯3𝑆\Upsilon(3S) decays

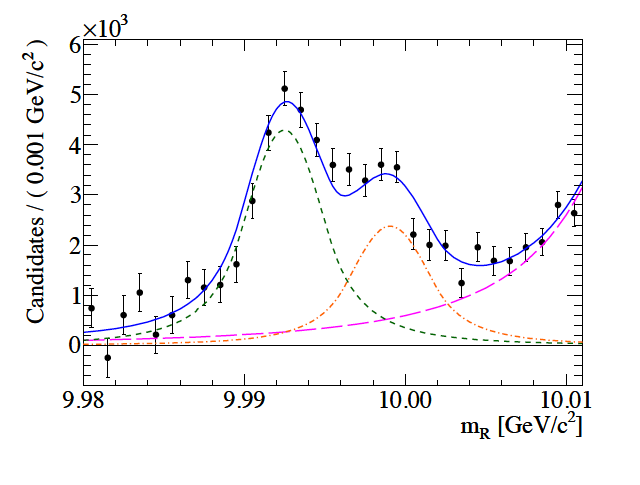
BABAR in a search for the hb​(1​P)subscriptβ„Žπ‘1𝑃h_{b}(1P) [16] using a sample of 108Γ—106​Ξ₯​(3​S)108superscript106Ξ₯3𝑆108\times 10^{6}~{}\Upsilon(3S) decays analyzed the inclusive di-pion decays. These transitions are studied using a fit to the spectrum of the mass mRsubscriptπ‘šπ‘…m_{R} recoiling against the Ο€+β€‹Ο€βˆ’superscriptπœ‹superscriptπœ‹\pi^{+}\pi^{-} system defined as: mR2=(MΞ₯​(3​S)βˆ’EΟ€β€‹Ο€βˆ—)2βˆ’|PΟ€β€‹Ο€βˆ—|2superscriptsubscriptπ‘šπ‘…2superscriptsubscript𝑀Ξ₯3𝑆subscriptsuperscriptπΈπœ‹πœ‹2superscriptsubscriptsuperscriptπ‘ƒπœ‹πœ‹2m_{R}^{2}=(M_{\Upsilon(3S)}-E^{*}_{\pi\pi})^{2}-|P^{*}_{\pi\pi}|^{2}. The result showed no evidence for the bottomonium spin-singlet state hb​(1​P)subscriptβ„Žπ‘1𝑃h_{b}(1P) but the transitions Ο‡b​J​(2​P)β†’Ο€+β€‹Ο€βˆ’β€‹Ο‡b​J​(1​P),Ξ₯​(3​S)β†’Ο€+β€‹Ο€βˆ’β€‹Ξ₯​(2​S)formulae-sequenceβ†’subscriptπœ’π‘π½2𝑃superscriptπœ‹superscriptπœ‹subscriptπœ’π‘π½1𝑃→Ξ₯3𝑆superscriptπœ‹superscriptπœ‹Ξ₯2𝑆\chi_{bJ}(2P)\rightarrow\pi^{+}\pi^{-}\chi_{bJ}(1P),~{}\Upsilon(3S)\rightarrow\pi^{+}\pi^{-}\Upsilon(2S), and Ξ₯​(2​S)β†’Ο€+β€‹Ο€βˆ’β€‹Ξ₯​(1​S)β†’Ξ₯2𝑆superscriptπœ‹superscriptπœ‹Ξ₯1𝑆\Upsilon(2S)\rightarrow\pi^{+}\pi^{-}\Upsilon(1S) have been investigated. In Fig. 6 is shown the mRsubscriptπ‘šπ‘…m_{R} spectrum in the region between 9.98–10.01 GeV/c2 after subtraction of continuum and KS0subscriptsuperscript𝐾0𝑆K^{0}_{S} background components: there are clear signals for the Ο‡b​Jsubscriptπœ’π‘π½\chi_{bJ} transitions, the extracted BF values are the following: ℬ​[Ο‡b​1​(2​P)β†’Ο€+β€‹Ο€βˆ’β€‹Ο‡b​1​(1​P)]=9.2Β±0.6Β±0.9Γ—10βˆ’3ℬdelimited-[]β†’subscriptπœ’π‘12𝑃superscriptπœ‹superscriptπœ‹subscriptπœ’π‘11𝑃plus-or-minus9.20.60.9superscript103{\cal B}[\chi_{b1}(2P)\rightarrow\pi^{+}\pi^{-}\chi_{b1}(1P)]=9.2\pm 0.6\pm 0.9\times 10^{-3} and ℬ​[Ο‡b​2​(2​P)β†’Ο€+β€‹Ο€βˆ’β€‹Ο‡b​2​(1​P)]=4.9Β±0.4Β±0.6Γ—10βˆ’3ℬdelimited-[]β†’subscriptπœ’π‘22𝑃superscriptπœ‹superscriptπœ‹subscriptπœ’π‘21𝑃plus-or-minus4.90.40.6superscript103{\cal B}[\chi_{b2}(2P)\rightarrow\pi^{+}\pi^{-}\chi_{b2}(1P)]=4.9\pm 0.4\pm 0.6\times 10^{-3}. In addition to these measurements is also extracted the ℬ​[Ξ₯​(3​S)β†’Ο€+β€‹Ο€βˆ’β€‹Ξ₯​(2​S)]=3.00Β±0.002​(s​t​a​t)Β±0.14​(s​y​s​t)%ℬdelimited-[]β†’Ξ₯3𝑆superscriptπœ‹superscriptπœ‹Ξ₯2𝑆plus-or-minus3.000.002π‘ π‘‘π‘Žπ‘‘0.14percent𝑠𝑦𝑠𝑑{\cal B}[\Upsilon(3S)\rightarrow\pi^{+}\pi^{-}\Upsilon(2S)]=3.00\pm 0.002(stat)\pm 0.14(syst)\% and the difference between the mass of the Ξ₯​(3​S)Ξ₯3𝑆\Upsilon(3S) and Ξ₯​(2​S)Ξ₯2𝑆\Upsilon(2S) mass: m​(Ξ₯​(3​S)βˆ’Ξ₯​(2​S))=331.50Β±0.02​(s​t​a​t)Β±0.13​(s​y​s​t)​MeV/c2π‘šΞ₯3𝑆Ξ₯2𝑆plus-or-minus331.500.02π‘ π‘‘π‘Žπ‘‘0.13𝑠𝑦𝑠𝑑MeVsuperscriptc2m(\Upsilon(3S)-\Upsilon(2S))=331.50\pm 0.02(stat)\pm 0.13(syst)\mathrm{MeV/c^{2}}. The last two values are more precise that the current world average [17].
Refer to caption
Figure 6: The mRsubscriptπ‘šπ‘…m_{R} spectrum in the region between 9.98–10.01 GeV/c2 after subtraction of continuum and and KS0subscriptsuperscript𝐾0𝑆K^{0}_{S} background components: points represent data, while the curves represent the Ο‡b​1​(2​P)β†’Ο‡b​1​(1​P)β†’subscriptπœ’π‘12𝑃subscriptπœ’π‘11𝑃\chi_{b1}(2P)\rightarrow\chi_{b1}(1P) (dashed), Ο‡b​2​(2​P)β†’Ο‡b​2​(1​P)β†’subscriptπœ’π‘22𝑃subscriptπœ’π‘21𝑃\chi_{b2}(2P)\rightarrow\chi_{b2}(1P) (dot-dashed), and Ξ₯​(3​S)β†’Ξ₯​(2​S)β†’Ξ₯3𝑆Ξ₯2𝑆\Upsilon(3S)\to\Upsilon(2S) (long-dashed) components.

6 Conclusion

Charmonium and Bottomonium spectroscopy has been revitalized by the B-factories discoveries made possible by their very large data sample. BABAR and Belle using 1.6 a​bβˆ’1π‘Žsuperscript𝑏1ab^{-1} discovered five missing pieces in the charmonium and bottomonium spectrum (Ξ·c​(2​S),subscriptπœ‚π‘2𝑆\eta_{c}(2S), Ο‡c​2​(2​P)subscriptπœ’π‘22𝑃\chi_{c2}(2P), Ξ·b(1S),hb(1P),hb(2P))\eta_{b}(1S),~{}h_{b}(1P),~{}h_{b}(2P)), several unexpected new states, and performed many precise measurements. New exciting results are still coming from BABAR and Belle, but given the fact that the next generation of B-factories being realized, even more exciting new results can be anticipated in the not-too-distant future.

References

  • [1] K.Β Abe et al. [Belle Collaboration], Phys.Β Rev.Β Lett.Β  89, 142001 (2002)
  • [2] R.Β Partridge et al., Phys.Β Rev.Β Lett.Β  45, 1150 (1980).
  • [3] B.Β Aubert et al. [BABAR Collaboration], Phys.Β Rev.Β  D 78, 012006 (2008) [arXiv:0804.1208 [hep-ex]].
  • [4] S.Β Uehara et al. [Belle Collaboration], Eur.Β Phys.Β J.Β  C 53, 1 (2008) [arXiv:0706.3955 [hep-ex]].
  • [5] D.Β M.Β Asner et al. [CLEO Collaboration], Phys.Β Rev.Β Lett.Β  92, 142001 (2004) [arXiv:hep-ex/0312058].
  • [6] M.Β Ambrogiani et al. [Fermilab E835 Collaboration], Phys.Β Lett.Β  B 566, 45 (2003).
  • [7] J.Β Z.Β Bai et al. [BES Collaboration], Phys.Β Lett.Β  B 555, 174 (2003) [arXiv:hep-ex/0301004].
  • [8] S.Β K.Β Choi et al. [Belle collaboration], Phys.Β Rev.Β Lett.Β  89, 102001 (2002) [Erratum-ibid.Β  89, 129901 (2002)]
  • [9] P. del Amo Sanchez et al. [BABAR collaboration], arXiv:1103.3971v2
  • [10] A. Vinokurova, et al. [Belle collaboration], arXiv:1105.0978v2
  • [11] B.Β Aubert et al. [BABAR Collaboration], Phys.Β Rev.Β Lett.Β  101, 071801 (2008) [Erratum-ibid.Β  102, 029901 (2009)]
  • [12] J. P. Lees et al. arXiv:1102.4565v1
  • [13] I. Adachi et al. arXiv:1103.3419v1
  • [14] J. P. Lees et al. arXiv:1104.5254v1
  • [15] W.Β Kwong and J.Β L.Β Rosner, Phys.Β Rev.Β  D 38, 279 (1988).
  • [16] J. P. Lees et al. arXiv:1105.4234v1
  • [17] K. Nakamura et al., J. Phys. G 37, 075021 (2010).