Annealing of single lamella nanoparticles of polyethylene
Abstract
We study the change of the size and structure of freely suspended single lamella nanoparticles of polyethylene during thermal annealing in aqueous solutions. Using small-angle x-ray scattering and cryogenic transmission electron microscopy, it is shown that a doubling of the crystalline lamella sandwiched between two amorphous polymer layers is obtained by annealing the nanoparticles at . This thickening of the crystalline lamella can be understood in terms of an unlooping of polymer chains within a single nanoparticle. In addition a variation of the annealing temperature from to demonstrates that the inverse of the crystalline lamellar thickness increases linearly with the annealing temperatures leading to a recrystallization line in a Gibbs-Thomson graph. Since the nanoparticles consist of about only eight polymer chains, they can be considered as a ideal candidates for the experimental realization of equilibrium polymer crystals.
I Introduction
The crystallization of high molecular weight polymer chains such as polyethylene (PE) differs qualitatively from the crystallization of simple fluids in a number of important aspects such as entanglements. At a microscopic scale, entanglements arise from the fact that linear polymer chains are one-dimensionally connected objects which cannot cross each other. The resulting topological interaction strongly affects the crystallization process since it imposes constraints on the motion of the polymer chains. A perfect parallel alignment of all polymer chains in a crystalline state cannot be obtained starting from a melt because it would take too long time to disentangle them. By now it is well-established that the crystallization process leads to a two-phase structure consisting of platelike crystallites which are separated by amorphous regions. Within a crystallite, the polymer chains are aligned parallel to the main axis of the platelet, while the remaining entanglements are located in the amorphous regions. A given polymer chain may fold back into the same crystallite after a transit into the adjacent amorphous region because the chain length is considerably larger than the height of the platelike cystallites.
However, it is still under debate whether polymer crystallization is kinetically or thermodynamically controlled (see, e.g., refs kell:94 ; hoff:97 ; kell:98 ; welc:01 ; muth:03 ; alle:05 ; somm:06 ; stro:06 ; stro:09 ; lan:10 and further references therein). The fact that the melting temperature and the crystallization temperature are different points to a decisive role of kinetics in polymer crystallization. However, computer simulations and theory welc:01 ; muth:03 ; somm:06 ; lari:05 have demonstrated the existence of equilibrium polymer crystals in the case that only a few polymer chains form a crystal. Polymer nanocrystals with small amorphous regions are ideal candidates for reaching thermodynamic equilibrium due the high mobility of the polymer repeat units.
Up to now, the overwhelming majority of studies have been done using bulk samples of PE. If the molecular weight is high enough, entanglements will play an important role for crystallization in these bulk samples. Working with single crystals of the respective polymer has been a way around this problem and single crystals of PE have been studied since many years. kell:68 Thus, crystals of PE with a thickness of about 10 - 15 nm and lateral dimensions of the order of 100 nm to a few m can be generated by crystallization from a highly dilute solution. kwan:01 ; mago:03 ; mago:06 These crystals can be used to study the lamellar thickening of the semi-crystalline PE upon annealing. The morphological changes involved in these processes can be easily studied using atomic force microscopy. tian:01 ; mago:06 Thus, Tian and Loos observed that simultaneous thickening of single crystals of PE was accompanied by the formation of cavities within the crystal. tian:01 It is evident that research on single crystals allows us to monitor subtle morphological changes that take place upon annealing. However, in most investigations the PE crystals are lying on a solid substrate which may exert a decisive influence on the shape transformation (see the discussion of this point in ref mago:06 ).
Recently, the progress of catalytic polymerization has led to the generation of single crystals of PE with dimensions in the nanometric range. The catalytic polymerization technique yields stable aqueous suspensions of well-defined PE nanoparticles that can be studied by a wide variety of techniques in-situ. Thus, small platelike crystallites of PE have been prepared in this way. webe:07 ; chen:07 Using a combination of cryogenic transmission electron microscopy (cryo-TEM) and small-angle x-ray scattering (SAXS), it has been demonstrated that these freely suspended PE platelets consist of a single crystalline lamella with a thickness of 6.3 nm. The overall thickness of 9 nm pointed to a small amorphous layer that could also be inferred precisely from the analysis of the SAXS-data. The facets of these crystals were clearly visible in micrographs taken by cryogenic transmission electron microscopy (cryo-TEM). Hence, the new method to create thin nanometric PE platelets provides the opportunity for new experiments on polymer crystallization using single PE crystals. chen:07
Here we present the first study of the thickening of single lamellar PE nanoplatelets by thermal annealing. Earlier studies of this process involved either PE crystals supported by a solid substrate or bulk PE (see, e.g., refs drey:70 ; barh:89 ; sadl:89 ; rast:97 ; xue:00 ; tian:01 ; tian:04 ; loos:06 ; naka:08 and references given therein). In particular, Tong et al. tong:09 presented the first systematic study of the lamellar thickening of PE nanocrystals on a solid surface by AFM. They showed that thermal annealing leads to considerable thickening of the crystals. Since the PE nanocrystals are freely suspended in an inert medium, any influence from solid substrates can be ruled out. Moreover, the small size allows us to monitor the overall shape and internal structure by a combination of cryo-TEM and SAXS. The present data can thus be compared to results obtained on solid substrates tian:01 ; tong:09 and on bulk samples.
II Experimental details and analysis of SAXS-data
II.1 Experimental
The systems have been prepared by catalytic polymerization in aqueous solution as discussed in refs baue:01 ; goet:06 ; yu:09 . Our samples contain 1.6 wt % PE of molecular weight g/mol and the surfactant sodium dodecyl sulfate (SDS) to stabilize the PE particles against coagulation. The weight fractions of SDS are 0.87 wt % and 0.36 wt % for the two samples S87 and S36, respectively. For sample S87 the amount of SDS used during the synthesis of the PE particles has been increased as compared to our previous studywebe:07 in order to ensure colloidal stability even at rather high temperatures during annealing processes. Surface tension measurements have indicated that virtually all surfactant molecules are adsorbed onto the strongly hydrophobic PE particles.
Specimens for cryo-TEM have been prepared by vitrification of a thin liquid film of a PE dispersion supported by a copper grid in liquid ethane at its freezing point. Examinations were carried out at temperatures around . Moreover, no staining agent has been used to enhance the contrast between the PE particles and the surrounding medium. All images have been recorded digitally by a bottom-mounted CCD camera system and processed with a digital imaging processing system.webe:07
The SAXS measurements have been performed using either a custom-built Kratky compact camera or synchrotron radiation using the beamline ID02 at the ESRF. The scattering intensities of both the empty capillary and the solvent have been subtracted from the scattering intensities presented in the next section. As in our previous study a contrast variation between the PE particles and the solvent has been used by adding various amounts of glucose to the solutions. In this way the individual contributions of the amorphous and crystalline regions of the PE particles to the scattering intensity become available. This allows for consistency checks of the theoretical modelling.
II.2 Scattering intensity
SAXS determines the scattering intensity as a function of the magnitude of the scattering vector and the PE particle number density . For a system consisting of monodisperse PE particles the scattering intensity can be written as
| (1) |
where describes how the scattering intensity is modulated by interference effects between radiation scattered by different parts of the same PE particle. The structure factor is related to mutual interactions between different PE particles. Therefore it is dependent on the degree of order of the PE particles in the samples. For noninteracting particles the structure factor is unity. Moreover, the contribution to the scattering intensity due to concentrations fluctuations of PE chains in the amorphous regions becomes only important for large scattering vectors.
The scattering intensity of a single PE particle is described in terms of
| (2) |
with
| (3) | |||||
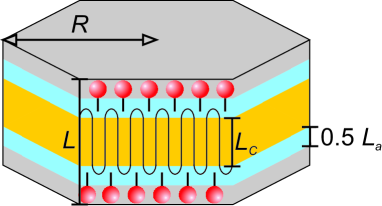
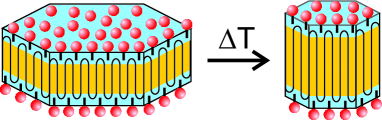
Here is the radius of a circular platelet consisting of a crystalline layer of height sandwiched between layers of amorphous PE and SDS as is shown in Figure 1. As already discussed in previous work, the faceted nanocrystals can be treated in good approximation as circular platelets for the SAXS analysis.webe:07 The height of the amorphous PE regions including the hydrocarbon SDS tails is given by , while denotes the total height of the platelet (see Figure 1). The electron contrasts are defined as , , and , where nm-3, nm-3, nm-3, and are the electron densities of the amorphous PE layers including the hydrocarbon SDS tails, the crystalline PE layer, the SDS headgroup layer, and the solvent, respectively. The value of the electron density of the solvent is determined by the concentrations of water and added contrast agent. Moreover, in eq 3 denotes the cylindrical Bessel function of first order. The effect of size polydispersity of the PE particles is taken into account by an appropriate average using a distribution function characterizing the degree of polydispersity.
We have used an integral equation theory harn:09 in order to calculate structure factors which characterize intermolecular correlations between different PE particles. This theoretical approach has been successfully applied to various suspensions consisting of platelike particles. harn:01 ; rose:06 ; harn:07
Finally, the contribution of concentration fluctuations of the PE chains in the amorphous phase reads
| (4) |
where is the correlation length and determines the contribution at vanishing scattering vector.
III Results and Discussion
III.1 Increase of lamellar thickness
We first discuss the modification of the PE particles of sample S87 due to thermal annealing. A 5 ml glass bottle has been filled with about 2 ml of the original PE suspension. Thereafter, it has been kept in a metal vessel located on a heating plate at for 20 minutes. Finally, the sample has been cooled down to . Evaporation of water could not be avoided completely leading to 1.74 wt % PE and 0.90 wt % SDS after annealing as compared to 1.70 wt % PE and 0.87 wt % SDS before annealing. Figures 2 (a) and (b) show typical cryo-TEM micrographs of the suspension before and after annealing, respectively. The PE particles are platelets with rather narrow size distribution. The hexagonal facetting of the nanocrystals is clearly visible.webe:07 Evidently, the platelets do not form aggregates due to the added SDS molecules. Those PE particles that appear to be very close to each other are located along the optical path (perpendicular to the plane of the figures) but at different depths inside the suspension. Moreover, it is worthwhile to mention that the different gray scales for different platelets are also related to different angles between the normal of the platelets and the direction of the electron beam. The length of the optical path through a platelet with its normal oriented perpendicular to the electron beam is larger than that through a platelet with its normal oriented parallel to the electron beam.
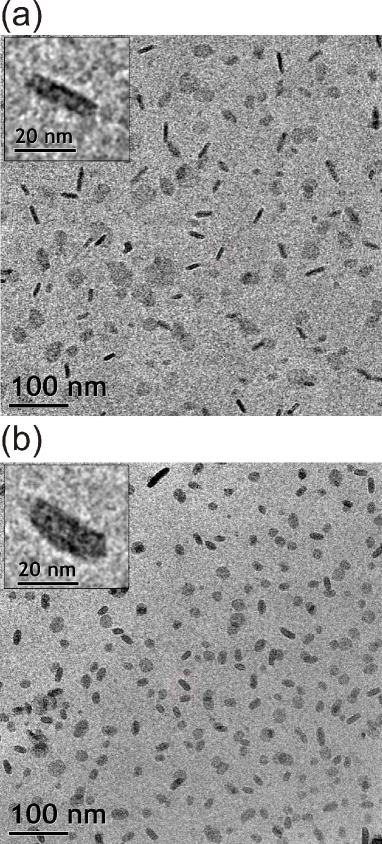
From the cryo-TEM images we have determined platelet radii of nm and nm before and after annealing, respectively. The corresponding heights of the platelets have been estimated to be nm and nm before and after annealing. These values have been derived from the image analysis of 20 particles with their normal oriented perpendicular to the electron beam. On the basis of this analysis one may conclude that a pronounced change of the shape of the PE nanoplatelets occurred during the annealing process (see also the insets of Figure 2). However, one has to take into account that it is not possible to detect amorphous PE with the help of the cryo-TEM micrographs shown in Figures 2 (a) and (b) because the electron density of amorphous PE is very similar to the one of the surrounding low density amorphous ice. webe:07 However, the images shown in Figure 2 demonstrate clearly that the process of annealing did not lead to formation of cavities, disintegration, or any other gross morphological change of the platelets. In order to elucidate the shape and the structure of the PE particles in more detail, the systems have been investigated using SAXS.
Figures 3 (a) and (b) display SAXS intensities of the PE nanoplatelets before and after annealing, respectively. These scattering intensities have been measured at different contrasts starting from a stock solution of the nanoplatelets dispersed in pure water. The different contrasts have been adjusted by adding different amounts of glucose. The volume fraction of added glucose increases from 0 (lower symbols in Figures 3 (a) and (b)) to 0.14 (upper symbols in Figures 3 (a) and (b)) while the corresponding volume fractions of the nanoparticles decrease upon increasing the amount of added glucose. For clarity, the scattering intensities related to different contrast have been shifted vertically in Figure 3.
Figure 3 demonstrates that annealing the sample leads to marked differences in the scattering intensities. Moreover, contrast variation furthermore enhances the difference between these states. Hence, the change of shape and internal structure of the platelets can be studied with high precision. The lines show the results obtained from eqs 1 - 4 for noninteracting particles (dashed lines), i.e., , and interacting particles (solid lines). For small magnitudes of the scattering vector the calculated scattering intensities for noninteracting particles (dashed lines) on the one hand, and the integral equation results for interacting particles (solid lines) as well as the experimental data (symbols) on the other hand deviate due to strong repulsive electrostatic interactions between the particles brought about by the adsorbed SDS molecules. The correlation length associated with the peak of the scattering intensities at nm-1 is given by = 45 nm and is related to the average distance between two platelets (see also Figure 2). Both this correlation length and the isothermal compressibility which is related to harn:09 are the same before and after annealing. Hence, the intermolecular pair correlations and the equation of state of the suspension are not influenced by the annealing process. This corroborates our finding that the number of platelets before and after annealing is equal (see Figure 2).
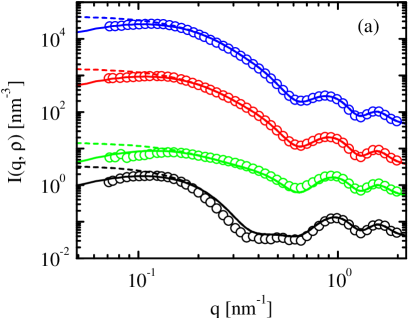
The overall dimensions following from the theoretical description of the scattering intensities are the average radius nm and nm as well as the thickness of the crystalline layer nm and nm before and after annealing, respectively. The thickness of the amorphous layer slightly increases from nm to nm during the annealing process. The change of the shape of the platelets can be directly seen from the shift of the location of the side maxima of the scattering intensities to lower values after annealing. The model parameters characterizing the size of the platelets can be expressed in terms of dimensionless scaling variables , , , and according to equation 3. Hence a variation of the location of the values of the side maxima of the scattering intensity implies a change of these model parameters. The pronounced suppression of the scattering intensities for the samples with 4.5 vol. % added glucose is due to the fact that the electron density of the solvent, i.e., water and added glucose, is similar to that of the crystalline layer. Therefore, there is only a minor contribution of the crystalline layer to the scattering intensities in this case. From the model parameters and by taking into account the densities of the amorphous and crystalline phase reported in the literature geil:63 , we have calculated that about CH2 groups are forming each nanoparticle. Given the molecular weight g/mol this corresponds to approximately 8 polyethylene chains by particle. Furthermore, we emphasize that we haven’t found alternative models which lead to agreement with the experimental data shown in Figure 3.
The analysis of the SAXS data and the TEM micrographs leads to the conclusion that annealing the sample S87 at for about 20 minutes leads to a doubling of the thickness of the crystalline lamella from nm to nm. We have checked that longer annealing times (up to 60 minutes) do not lead to further increase of . The thickening of the crystalline lamella during annealing can be understood in terms of an unlooping within a single lamella drey:70 ; barh:89 as is illustrated in Figure 4. With increasing temperature the chain mobility increases leading to cooperative motion of repeat units parallel to the main axis of a crystalline platelet (see, e.g., refs wang:09 ; rast:09 and references therein). In doing so the chains can partly unfold and reduce the amount of amorphous loops. As a result the height of the platelets increases while their radius decreases.
It must be kept in mind that the number of particles inferred from SAXS is the same before and after annealing. This is in agreement with the cryo-TEM micrographs. Within the present investigation this is an important observation because the alternative scenario, namely the stacking of adjacent lamella rast:97 ; xue:00 can be ruled out definitely. In this model the thickening is due to a fusion of two crystalline layers. Such a model may be invoked for solution crystallized films involving a semicrystalline polymer gel in which the crystalline domains are connected by amorphous material. For the present system a stacking of lamellae would lead to the reduction of the number of particle number by a factor two after annealing which is not observed.
For comparison we note that a simple theoretical model muth:03 ; somm:06 for the equilibrium shape of a cylindrical polymer crystal yields
| (5) |
where is the solvent-crystalline layer interfacial tension and is the effective solvent-amorphous layer interfacial tension that includes entropic and bending contributions harn:99a ; harn:99b of the PE chains. The temperature dependence of is discussed in Ref. somm:06 on the basis of a statistical model that takes into account loops and tails of polymer chains in the amorphous regions. Depending on the model parameters decreases or increases upon increasing the temperature (see Figure 7 in Ref. somm:06 ). Equation 5 follows from a minimization of the free energy
| (6) |
with respect to under the constraint that const. Here is the energy gain per volume of the bulk crystalline phase as compared to the bulk amorphous phase. After annealing, the shape of the PE nanocrystals under consideration is characterized by the ratio implying that if the nanocrystals are thermodynamically stable. In view of the fact that no direct experimental values for the interfacial tensions are available, we note that for polymer crystal melt interfaces according to a very recent computer simulation study. miln:10 The presence of the SDS molecules and the solvent water will lead to a ratio , but at the moment it is not possible to decide whether the PE nanocrystals after annealing exhibit their equilibrium shape or not. Nevertheless, the size ratio of the PE nanocrystals is remarkably large as compared to the corresponding ratios of the well known PE crystals with a thickness of about 10 - 15 nm and lateral dimensions of the order of 100 nm to a few m. Moreover, the scattering intensities shown in Figure 3 (b) can be modelled using a size polydispersity with a constant size ratio according to equation 5. Based on these results we see avenues for future research devoted to the experimental realization of equilibrium polymer nanocrystals.
III.2 Variation of annealing temperature
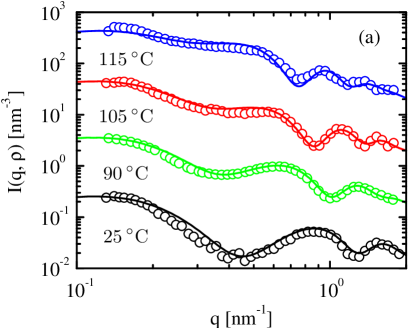
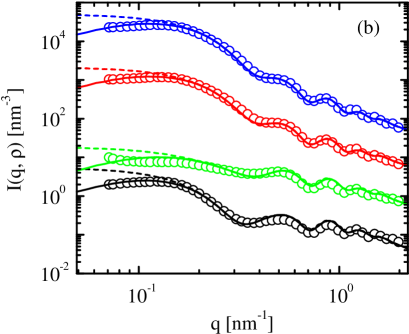
The results of the previous subsection show that thermal annealing at the high temperature leads to a strong increase of the height of the crystalline lamella of the order of two. We now study possible changes of the PE platelets after annealing at lower temperatures using the sample S36 which contains a smaller amount of added SDS as compared to the sample S87 studied in the last subsection. Figure 5 (a) displays SAXS intensities of the original sample together with the measured scattering intensities after annealing for about 20 minutes at , , and (from bottom to top).
These scattering intensities have been obtained from a solution of PE platelets dispersed in pure water. For clarity, the three lowermost scattering intensities have been shifted vertically. The increase of the height of the nanoplatelets upon increasing the annealing temperature can be directly seen from the shift of the side maxima and minima to lower -values. Longer annealing times (up to 60 minutes) do not lead to further changes of the scattering intensities. We note that the differences between the measured scattering intensities of the original sample S36 (lower symbols in Figure 5 (a)) and the original sample S87 (lower symbols in Figure 3 (a)) are due to the different amounts of added SDS. However, the amount of added surfactant does not influence the size and structure of the PE nanoparticles.
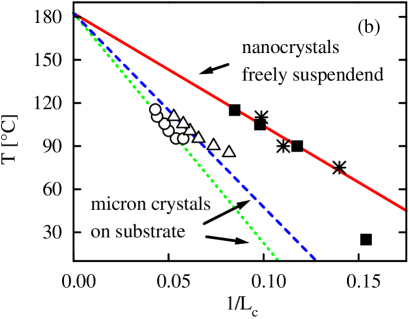
The solid lines in Figure 5 (a) show the calculated scattering intensities for interacting platelets using nm for the original sample and nm, nm, nm for the samples which have been annealed at , , and , respectively. Figure 5 (b) displays a plot of the annealing temperature against the reciprocal thickness as suggested by the Gibbs-Thomson equation
| (7) |
where is the heat of fusion, the surface free energy of the lamellae, and the temperature limit referring to fully crystalline samples. The open symbols refer to the respective data taken from micron-sized PE crystals on a solid substrate. These data have been taken from the work of Tian and Loos. tian:01 Evidently, the temperatures obtained by extrapolation of PE crystals of different sizes agree within prescribed limits of error. This is to be expected since the influence of both the SDS molecules in the case of the freely suspended nanocrystals and the solid substrate in the case of the micron crystals on the recrystallization process is vanishing in the limit of infinitely long polymer chains. Moreover, the data obtained by Tong et al.tong:09 on the thickening of PE-nanocrystals lying on a solid substrate (crosses in Figure 5 (b)) fit very well on this line.
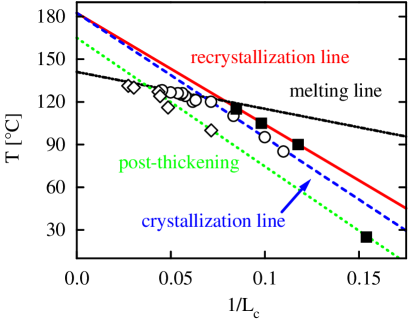
It is also interesting to compare the lamella thickening of the PE nanocrystals with crystallization results obtained on PE bulk samples. Figure 6 displays the recrystallization line (solid line) of the PE nanocrystals together with the crystallization line (dashed line) of PE crystallized from melt. barh:85 In the limit the recrystallization line and the crystallization line lead to the same temperature . Note that here the initial thickness of the lamellae has been used for this plot (see the discussion of this point in ref. stro:05 ). Together with the extrapolation shown in Figure 5 this plot demonstrates that is a well-founded number describing the melting point of a fully crystalline PE-sample. However, in case of bulk sample, the recrystallization process ends at the intersection of the recrystallization line with the melting line (dash-dotted line in Figure 6) which is given by according to ref wund:77 .
For comparison the supercooling dependence of the crystalline lamellar thickness after post-crystallization reorganization is shown by the dotted line. After initial crystallization, the PE chains are known to reorganize toward the equilibrium state leading to an increase of the crystalline lamella thickness. The PE nanoparticles (lowermost square in Figure 6) went through post-thickening after initial crystallization. Extrapolation of these data according to eq. (7) would lead to a considerably smaller value for .
IV Conclusion
In conclusion, our findings elucidate the change of the size and the structure of individual polyethylene nanocrystals during annealing. The nanoparticles have been synthesized and stabilized by a nickel-catalyzed polymerization in aqueous solution. Hence freely suspended polymer nanocrystals can be studied, while earlier studies of larger polyethylene crystals involved either the bulk polymer phase or a supporting solid substrate. The combination of small-angle x-ray scattering and cryogenic transmission electron microscopy demonstrates that the thickening of the crystalline lamella can be controlled by varying the annealing temperature. The resulting recrystallization line defines a linear relationship between the annealing temperature and the reciprocal of the crystalline lamellar thickness. The recrystallization lines for both the present PE nanocrystals and for micron-sized PE crystals (see Figure 5) lead to the same temperature as the crystallization line for for bulk samples (see Figure 6). All data obtained herein point to a thermodynamic control of the thickness of the lamellae. The finite thickness measured after annealing can be rationalized by a simple theoretical model muth:03 ; somm:06 for the equilibrium shape of a cylindrical polymer crystal.
V Acknowledgment
This work was partly funded by the German Excellence Initiative (Q.T. and S.M.). M.B. acknowledges gratefully financial support by the DFG.
References
- (1) Keller, A.; Hikosaka, M.; Rastogi, S.; Toda, A.; Barham, P. J.; Goldbeck-Wood, G. J. Mater. Sci. 1994, 29, 2579-2604.
- (2) Hoffman, J. D.; Miller, R. L. Polymer 1997, 38, 3151-3212.
- (3) Keller, A.; Cheng, Z. D. Polymer 1998, 39, 4461-4487.
- (4) Welch, P.; Muthukumar, M. Phys. Rev. Lett. 2001, 87, 218302(1)-218302(4).
- (5) Muthukumar, M. Phil. Trans. R. Soc. Lond. A 2003, 361, 539-556.
- (6) Allegra, G.; Meille, S. V. Adv. Polym. Sci. 2005, 191, 87-135.
- (7) Sommer, J.-U. Eur. Phys. J. E 2006, 19, 413-422.
- (8) Strobl, G. Prog. Polym. Sci. 2006, 31, 398-442.
- (9) Strobl, G. Rev. Mod. Phys. 2009, 81, 1287-1300.
- (10) Lan, Y.-K.; Su, A.-C. Macromolecules 2010, 43, 7908-7912.
- (11) Larini, L.; Barbieri, A.; Prevosto, D.; Rolla, P. A.; Leporini, D.; J. Phys.: Condens. Matter 2005, 17, L199-L208.
- (12) Keller, A. Rep. Progr. Phys. 1968, 31, 623-704.
- (13) Kwan, A. T.; Efremov, M. Y.; Olson, E. A.; Schiettekatte, F.; Zhang, M.; Geil, P. H.; Allen, L. H. J. Polym. Sci.: Part B: Polym. Phys. 2001, 39, 1237-1245.
- (14) Magonov, S. N.; Yerina, N. A.; Ungar, G.; Reneker, D. H.; Ivanov, D. A. Macromolecules 2003, 36, 5637-5649.
- (15) Magonov, S. N.; Yerina, N. A.; Godovsky, Y. K.; Reneker, D. H. J. Macromol. Sci. Part B: Physics 2006, 45, 169-194.
- (16) Tian, M.; Loos, J. J. Polym. Sci.: Part B: Polym. Phys. 2001, 39, 763-770.
- (17) Weber, C. H. M.; Chiche, A.; Krausch, G.; Rosenfeldt, S.; Ballauff, M.; Harnau, L.; Göttker-Schnetmann, I.; Tong, Q.; Mecking, S. Nano Lett. 2007, 7, 2024-2029.
- (18) Cheng, S. Z. D. Nature 2007, 448, 1006-1007.
- (19) Dreyfuss, P.; Keller, A. J. Macromol. Sci., Phys. 1970, 4, 811-836.
- (20) Barham, P. J.; Keller, A. J. Polym. Sci., Part B: Polym. Phys. 1989, 27, 1029-1042.
- (21) Sadler, D. M.; Spells, S. J. Macromolecules 1989, 22, 3941-3948.
- (22) Rastogi, S.; Spoelstra, A. B.; Groossens, J. G. P.; Lemstra, P. J. Macromolecules 1997, 30, 7880-7889.
- (23) Xue, Y.-Q.; Tervoort, T. A.; Rastogi, S.; Lemstra, P. J. Macromolecules 2000, 33, 7084-7087.
- (24) Tian, M.; Dosiere, M.; Hocquet, S., Lemstra, P. J., Loos, J. Macromolecules 2004, 37, 1333-1341.
- (25) Loos, J.; Tian, M. Polymer 2006, 47, 5574-5581.
- (26) Nakamura, J.; Tsuji, M.; Nakayama, A.; Kawaguchi, A.; Macromolecules 2008, 41, 1358-1363.
- (27) Tong, Q.; Mecking, S. J. Polym. Sci.: Part A: Polym. Chem. 2009, 47, 6420-6432.
- (28) Bauers, F. M.; Mecking, S. Angew. Chem. Int. Ed. 2001, 40, 3020-3022
- (29) Göttker-Schnetmann, I.; Korthals, B.; Mecking, S. J. Am. Chem. Soc. 2006, 128, 7708-7709.
- (30) Yu, S.-M.; Mecking, S. Macromolecules 2009, 42, 3669-3673.
- (31) Harnau, L. Molec. Phys. 2008, 106, 1975-2000.
- (32) Harnau, L.; Costa, D.; Hansen, J.-P. Europhys. Lett. 2001, 53, 729-734.
- (33) Rosenfeldt, S.; Karpuk, E.; Lehmann, M.; Meier, H.; Lindner, P.; Harnau, L; Ballauff, M. ChemPhysChem 2006, 7, 2097-2104.
- (34) Harnau, L.; Rosenfeldt, S.; Ballauff, M. J. Chem. Phys. 2007, 127, 014901(1)-014901(6).
- (35) Geil, P. H. Poylmer Single Crystal; Wiley: New York, 1963.
- (36) Wang, L.; Gao, X.; Sun, Z.; Feng, J. J. Chem. Phys. 2009, 130, 184709(1)-184709(6).
- (37) Rastogi, S.; Yao, Y.; Lippits, D. R.; Höhne, G. W. H.; Graf, R.; Spiess, H. W.; Lemstra, P. J. Macromol. Rapid Commun. 2009, 30, 826-839.
- (38) Wunderlich, B.; Czornyj, G. Macromolecules 1977, 10, 906-913.
- (39) Barham, P. J.; Chivers, R. A.; Keller, A.; Martinez-Salazar, J.; Organ, S. J. J. Mater. Sci. 1985, 20, 1625-1630.
- (40) Harnau, L.; Winkler, R. G.; Reineker, P.; Europhys. Lett. 1999, 45, 488-494.
- (41) Harnau, L.; Winkler, R. G.; Reineker, P.; Phys. Rev. Lett. 1999, 82, 2408-2408.
- (42) Milner, S. T.; cond-mat.soft 2010, arXiv:1009.4245v1.
- (43) Strobl, G. Eur. Phys. J. E 2005, 18, 295-309.
- (44) Voigt-Martin, I. G.; Mandelkern, L. J. Polym. Sci.: Polym. Phys. 1981, 19, 1769-1790.