Evolution of the Solar Nebula. IX. Gradients in the Spatial Heterogeneity of the Short-Lived Radioisotopes 60Fe and 26Al and the Stable Oxygen Isotopes
Abstract
Short-lived radioisotopes (SLRI) such as 60Fe and 26Al were likely injected into the solar nebula in a spatially and temporally heterogeneous manner. Marginally gravitationally unstable (MGU) disks, of the type required to form gas giant planets, are capable of rapid homogenization of isotopic heterogeneity as well as of rapid radial transport of dust grains and gases throughout a protoplanetary disk. Two different types of new models of a MGU disk in orbit around a solar-mass protostar are presented. The first set has variations in the number of terms in the spherical harmonic solution for the gravitational potential, effectively studying the effect of varying the spatial resolution of the gravitational torques responsible for MGU disk evolution. The second set explores the effects of varying the initial minimum value of the Toomre stability parameter, from values of 1.4 to 2.5, i.e., toward increasingly less unstable disks. The new models show that the basic results are largely independent of both sets of variations. MGU disk models robustly result in rapid mixing of initially highly heterogeneous distributions of SLRIs to levels of 10% in both the inner ( 5 AU) and outer ( 10 AU) disk regions, and to even lower levels ( 2%) in intermediate regions, where gravitational torques are most effective at mixing. These gradients should have cosmochemical implications for the distribution of SLRIs and stable oxygen isotopes contained in planetesimals (e.g., comets) formed in the giant planet region ( 5 to 10 AU) compared to those formed elsewhere.
1 Introduction
The short-lived radioisotope (SLRI) 60Fe appears to have been synthesized in a Type II supernova (Mostefaoui, Lugmair, & Hoppe 2005; Tachibana et al. 2006) and injected into the presolar cloud (Boss et al. 2008, 2010; Boss & Keiser 2010) from the same massive star that is likely to be the source of the bulk of the solar nebula’s 26Al (Limongi & Chieffi 2006; Sahijpal & Soni 2006). Given the injection of SLRIs into the presolar cloud by Rayleigh-Taylor fingers (Boss et al. 2008, 2010; Boss & Keiser 2010), it might be expected that the SLRIs would be initially highly spatially and temporally heterogeneous in their distribution in the solar nebula. However, the nearly identical Fe and Ni isotopic compositions of iron meteorites, chondrites, and the Earth require that the injected 60Fe must have been mixed to less than 10% heterogeneity in the solar nebula (Dauphas et al. 2008). A similar constraint arises from the need to preserve the use of 26Al as an accurate nebular chronometer (e.g., Thrane, Bizzarro, & Baker 2006), while simultaneously allowing for the spread of stable oxygen isotope ratios (Lyons & Young 2005; Lee, Bergin, & Lyons 2008). Three-dimensional hydrodynamical models of the evolution of a marginally gravitationally unstable (MGU) solar nebula have shown that mixing of initially highly heterogeneous distributions of SLRIs can indeed reduce the level of heterogeneity to 10% or lower in less than 1000 yrs (Boss 2004a, 2006, 2007, 2008).
The discovery of refractory grains among the particles collected from Comet 81P/Wild 2 by the Stardust spacecraft (Brownlee et al. 2006; Simon et al. 2008; Nakamura et al. 2008) provided the first ground truth for large-scale transport of materials formed in high temperature regions close to the protosun outward to the comet-forming regions of the solar nebula. One refractory particle found by Stardust, Coki, has an age 1.7 Myr younger (Matzel et al. 2010) than that of calcium, aluminum-rich inclusions (CAIs), implying that outward radial transport continued for millions of years after CAI formation. Measurements of the iron sulfide content of particles from Wild 2 imply that over half of the comet’s mass derived from the inner solar nebula (Westphal et al. 2009). Similar hydrogen, nitrogen, and oxygen isotopic anomalies occur in both primitive meteorites and in cometary dust particles, implying that meteorites and comets both formed from the same basic mixture of disk material (Busemann et al. 2009; Aléon et al. 2009).
Observations of disks around young stars often find evidence for crystalline silicate grains at distances ranging from inside 3 AU to beyond 5 AU, in both the disk’s midplane and its surface layers (e.g., Merín et al. 2007). Only the most massive AGB stars produce significant quantities of crystalline grains (Speck et al. 2008); grains in the interstellar medium are primarily amorphous. Crystalline silicate grains could have been produced through thermal annealing of amorphous grains (e.g., Sargent et al. 2009a,b) by the hot disk temperatures reached only within the innermost disk, well inside 1 AU. Crystalline and amorphous silicate grains in most protoplanetary disks may thus have experienced the same large-scale transport phases as the refractory particles found in Wild 2.
While accretion disk models driven by a generic turbulent viscosity have long been invoked as a means to explain large-scale transport (Gail 2001, 2002, 2004; Tscharnuter & Gail 2007; Ciesla 2007, 2008, 2009, 2010a,b; Birnstiel et al. 2009; Hughes & Armitage 2010; Heinzeller et al. 2011; Jacquet et al. 2011), the detailed physics behind -viscosity remains unclear, especially considering that the magneto-rotational instability (MRI) often assumed to be the source of the -viscosity is unable to drive disk evolution in the magnetically dead midplane regions (e.g., Matsumura & Pudritz 2006) of most interest for planetary formation. Objections have also been raised to the assumption that angular momentum transport in a MRI-driven disk can be described by the standard model for -viscosity (Pessah, Chan, & Psaltis 2008). In contrast, a MGU disk presents a self-consistent mechanism for studying mixing and transport in protoplanetary disks, with no free parameters beyond the initial choice of a disk massive enough, and cold enough, to be MGU.
We present here a new set of three-dimensional MGU disk models similar to those studied previously (e.g., Boss 2004a, 2006, 2007, 2008), but with several variations intended to test the robustness of the conclusions about mixing and transport of the previous models. Given that a MGU disk appears to be a likely requirement for the formation of gas giant planets, by either core accretion (e.g., Inaba et al. 2003; Chambers 2008) or by disk instability (e.g., Boss 2010), these MGU models are intended to learn what cosmochemical consequences might also derive from such phases of rapid disk evolution.
2 Numerical Methods
The disk evolution calculations were performed with a numerical code that uses finite differences to solve the three-dimensional equations of hydrodynamics, radiative transfer, and the Poisson equation for the gravitational potential. The code is the same as that used in the previous studies of mixing and transport in disks (Boss 2004a, 2006, 2007, 2008). The code has been shown to be second-order-accurate in both space and time through convergence testing (Boss & Myhill 1992). The equations are solved on a spherical coordinate grid. The number of grid points in each spatial direction is: , in , and . This relatively low degree of numerical spatial resolution (compared to high resolution disk instability models, e.g., Boss 2010) was chosen in order to evolve the disks as far forward in time as possible in several years of computing on a dedicated workstation. The radial grid is uniformly spaced between 1 and 10 AU, with boundary conditions at both the inner and outer edges chosen to absorb radial velocity perturbations. The grid is compressed into the midplane to ensure adequate vertical resolution ( at the midplane). The grid is uniformly spaced, to prevent any bias in the azimuthal direction. The central protostar wobbles in response to the growth of nonaxisymmetry in the disk, thereby rigorously preserving the location of the center of mass of the star and disk system. The number of terms in the spherical harmonic expansion for the gravitational potential of the disk is for the standard model, but has been varied to or 48 in certain models, as noted below. The Jeans length constraint (e.g., Boss 2010) is monitored throughout the evolutions to ensure that the spatial resolution remains adequate.
As in Boss (2004a, 2006, 2007, 2008), the models treat radiative transfer in the diffusion approximation, which should be valid near the disk midplane and throughout most of the disk, because of the high vertical optical depth. The energy equation is solved explicitly in conservation law form, as are the four other hydrodynamic equations. Artificial viscosity is not employed.
In order to follow the transport of injected SLRIs, the evolution of a color field is calculated (e.g., Foster & Boss 1997; Boss 2004a). SLRI or oxygen anomalies that reside in the gas or in particles with sizes of mm to cm or smaller will remain tied to the gas over timescales of 1000 yrs or so, because the relative motions caused by gas drag result in differential migration by distances of less than 0.1 AU in 1000 yrs, which is negligible compared to the distances they are transported by the gas in that time, justifying their representation by the color field. The equation of motion for the color field density is exactly similar to the continuity equation for the mass density , namely
where is the disk gas velocity and is the time. The color equation is solved in the same manner as the five other equations of motion, using finite differences and explicit time differencing. The total amount of color is monitored throughout the evolution to ensure the reliability of the color field calculation, which is conserved in the same manner as the disk mass is conserved. While Boss (2004a) added the effects of an -viscosity to the color equation, the present models assume .
3 Initial Conditions
The models consist of a central protostar surrounded by a protoplanetary disk with a mass of 0.047 between 1 and 10 AU, as in Boss (2008). Figure 1 depicts an azimuthal cross section of the initial disk structure. The underlying disk structure is the same as that of the disk extending from 4 to 20 AU assumed in previous models (Boss 2004a, 2006, 2007). Disks with similar masses appear to be necessary to form gas giant planets by core accretion (e.g., Inaba et al. 2003; Chambers 2008) or by disk instability (e.g., Boss 2010). Protoplanetary disks are often believed to have masses in the range of 0.01 to 0.1 (Kitamura et al. 2002), but these disk masses may be underestimated by factors of up to 10 (Andrews & Williams 2007). More recent observations of low- and intermediate-mass pre-main-sequence stars imply disk masses in the range of 0.05-0.4 (Isella et al. 2009). The disk all start from an axisymmetric density distribution with density perturbations of 1% in the , 2, 3, and 4 modes.
In the standard model 9S of Boss (2008), the disk starts with an outer disk temperature K, rising to temperatures greater than 1500 K in the inner disk, as shown in Figure 2, based on the disk midplane temperature profiles calculated by Boss (1996). This initial temperature distribution leads to a minimum in the initial Toomre value of 1.4 at the outer boundary of the active disk at 10 AU (Figure 3). Inside 5 AU, rises to values 10 because of the much higher disk temperatures closer to the protosun. A value of 1.4 implies marginal instability to the growth of gravitationally-driven perturbations, while implies a high degree of stability. Five other models (Table 1) explore the effects of different initial values of the outer disk temperature, 60, 70, 80, 100, and 120 K, resulting in initial minimum Toomre values of 1.8, 1.9, 2.0, 2.3, and 2.5, respectively.
In all of these models, a color field representing SLRI is sprayed onto the outer surface of the disk at a radial distance centered on 8.5 AU (Figure 1) into a 90 degree (in the azimuthal direction) sector of a ring of width 1 AU, simulating the arrival of a Rayleigh-Taylor finger carrying SLRI (e.g., Boss et al. 2008, 2010; Boss & Keiser 2010). While Boss (2004a) found that models with injection into a 90 degree sector evolved in much the same way as models with injection into a 360 degree ring, it would be interesting in the future to investigate injection into sectors smaller than 90 degrees, which might better represent the extent of Rayleigh-Taylor fingers upon impact with the solar nebula.
4 Results
We present here the results of eight new models (Table 1). Model 1.4 is the continuation in time of model 9S from Boss (2008). Models 16 and 48 are identical to the model 1.4, except for having the number of terms in the spherical harmonic expansion for the gravitational potential solver changed from to either 16 or 48. Since MGU disks evolve solely as a result of gravitational torques, these changes have the effect of varying the numerical resolution. Models 1.8, 1.9, 2.0, 2.3, and 2.5 are identical to model 1.4, except for starting with a more gravitationally stable disk, as quantified by initial minimum Toomre Q values of 1.8, 1.9, 2.0, 2.3, and 2.5, respectively, instead of 1.4.
4.1 Evolution of the Disk
Model 2.5 serves to demonstrate the common evolutionary outcome of all of these MGU disks, and so will be described in some detail.
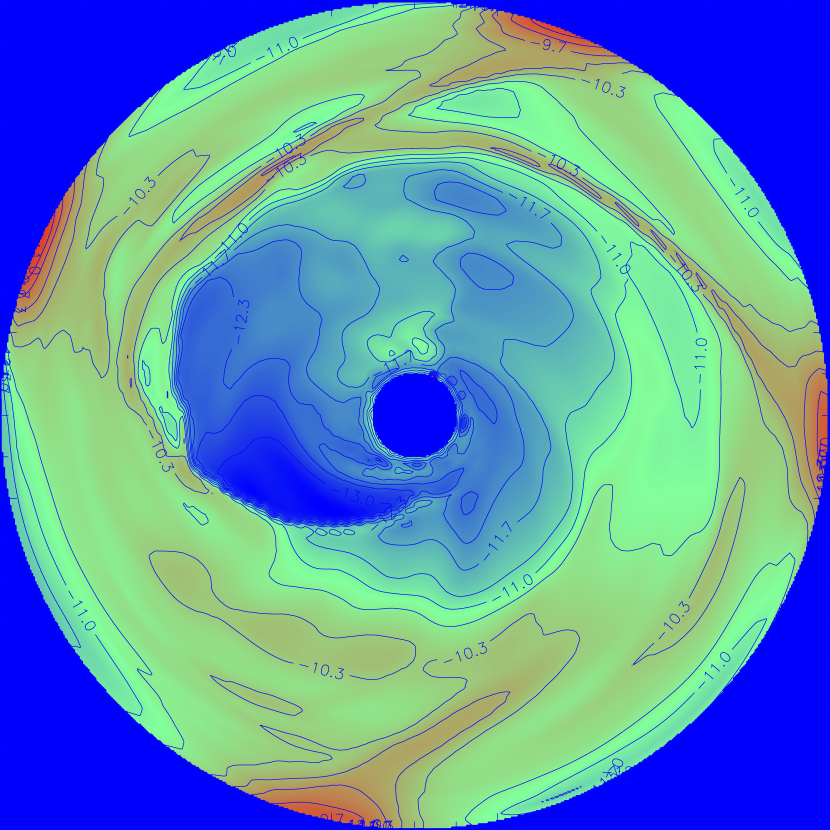
Figures 4 and 5 display the midplane density and temperature distributions for model 2.5 after 1548 yr of evolution. While model 2.5 is initially the most gravitationally stable model calculated to date, it is clear that even in model 2.5, the growth of spiral arms in the outer disk drives the formation of non-axisymetric structures even in the highly gravitationally stable inner disk. Figure 4 shows that the outer spiral arms have driven a one-armed trailing spiral (the disks rotate in the counter-clockwise direction) right down to the central protostar. Such an inner one-armed spiral is a likely means for accomplishing the thermal processing in a shock front that appears to be necessary to account for chondrule formation (Boss & Durisen 2005). Figure 5 shows that while the hot inner disk remains thermally axisymmetric, non-axisymmetric temperatures accompany the spiral features in the cooler outer disk. The temperature distribution in the outer disk is nevertheless more uniform than the density distribution, because of the restriction that the temperature cannot drop below the initial value of 120 K for model 2.5, which is considerably higher than that ( 50 K) to be expected for the solar nebula (Boss 1996). Restrictions on the temperature fields are imposed in order to err on the conservative side with respect to the possible growth of clumps in disk instability models of gas giant planet formation (e.g., Boss 2010).
4.2 Evolution of the Color Field
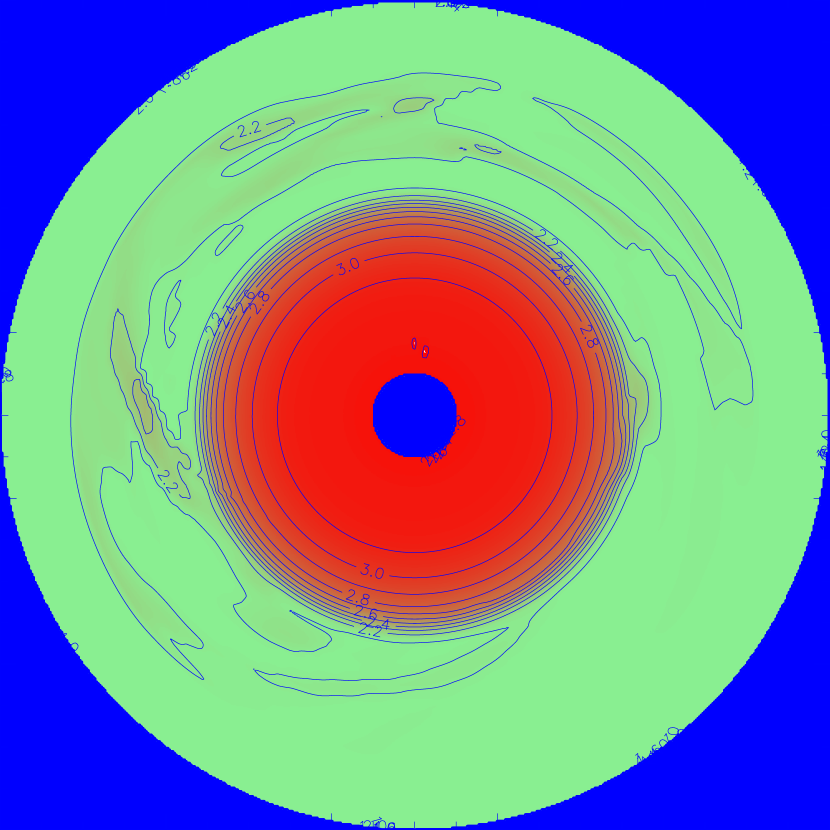
Figure 6 shows the midplane distribution of the color field for model 2.5 after only 112 yr of evolution, or 3.6 orbital periods at the 10 AU edge of the disk. By this early time, the color has already been transported downward to the midplane from the disk’s surface (Figure 1) as well as azimuthally around the disk, to all azimuthal angles, compared to the initial 90 degree sector. Given the initial injection at 8.5 AU, where the orbital period is 25 yr, onto the disk’s surface in a sector between 9 o’clock and 6 o’clock, by 112 yr any material orbiting at 8.5 AU should have made 4.5 orbits, so in the absence of any other effects, the color field should have a maximum between 3 o’clock and 12 o’clock in Figure 6 (the disk rotates in the counterclockwise direction). The fact that the color field’s maximum is instead at 12 o’clock is due to color field maximum having been transported inward by 112 yr to a distance of 8.0 AU, where the orbital period is only 22 yr, allowing the color field maximum to have orbited further than the prediction based on an 8.5 AU orbit.
Figure 6 also shows that some of the color field has already been transported to the inner edge of the disk, where is it beginning to accrete onto the central protostar. The rapid vertical transport appears to be due at least in part to convective-like motions driven by the superadiabatic vertical temperature gradients between the disk’s midplane and its upper layers that develop as the disk evolves (Boss 2004b). In addition, the global mass transport driven in the midplane by the spiral arms (Figure 4) clearly results in rapid radial and azimuthal transport. Figure 7 shows the same model 2.5 after another 1436 yr of evolution (same time as Figure 4), where it can be seen that the color field has been preferentially trapped in the clumps and spiral arms in the disk midplane, where the gas density is highest and where the gravitational potential minima occur. Significant amounts of color have been accreted by the protostar, and have also piled up at the outer boundary of the active computational disk, indicative of the fact that MGU disks drive transport both inwards and outwards in the disk. By the time that model 2.5 was stopped, after 1548 yr, 25% of the initial color field had been accreted by the central protostar. For comparison, model 1.8 by that same time had accreted 42% of the color field onto the protostar, indicative of faster inward accretion rates in a lower disk, as expected.
A comparison of Figures 6 and 7 would seem to indicate, however, that the color field is becoming more heterogeneously distributed with time, rather than becoming homogenized. This is misleading, because what is important for cosmochemical heterogeneity is the relative abundances of SLRIs (e.g., the abundance ratio 26Al/27Al), not their absolute abundance (e.g., the number of 26Al atoms). Figures 8 and 9 display the color field density divided by the gas field density, i.e., 26Al/27Al (most of the 27Al resides in the pre-injection cloud), for model 2.5 at the same two times as shown in Figures 6 and 7. Figure 8 shows that 112 yr after injection, the color field is strongly heterogeneous, having been freshly injected, whereas by 1548 yr (Figure 9), the MGU disk has rather thoroughly homogenized the color field with respect to the underlying gas density field. The absence of contours in most of Figure 9 shows that the color field has been homogenized to less than 25% variations for the entire disk, with the exception of the innermost few AU.
4.3 Evolution of the Color Field Dispersion
In order to follow the extent to which the color field is homogenized in MGU disks, the time evolution of the dispersion of the color field is computed. The dispersion is defined to be the square root of the sum of the squares of the color field divided by the gas density, subtracted from the mean value of the color field divided by the gas density, where the sum is taken over the midplane grid points and is normalized by the number of grid points being summed over (e.g., Boss 2006, 2007, 2008). The sum excludes the regions closest to the inner and outer disk boundaries, in order to minimize the effect of the artificial disk boundaries.
Figure 10 shows the time evolution of the dispersion for models 1.4, 16, and 48, where the only difference in the models is in the number of terms retained in the spherical harmonic expansion for the gravitational potential solver, 32, 16, and 48, respectively. All of the models start off from a highly heterogeneous initial condition, with a dispersion much greater than 1. Figure 10 shows that the dispersion in all three models thereafter behaves in much the same way, though the rate at which the disk is homogenized depends slightly on the gravitational potential resolution. In model 48, the dispersion decreases somewhat faster than in model 1.4, which drops somewhat faster than in model 16, as expected, as the homogenization is being performed by the spiral arms, which become increasingly vigorous as the spatial resolution is effectively improved. However, Figure 10 shows that, at least over the range investigated here, the degree of spatial resolution of the spiral arms does not have a significant effect on the evolution of the dispersion, i.e., these MGU disk models appear to be adequately resolved.
Figure 11 presents the evolution of the dispersion for models 1.4, 1.8, and 2.5. Again the behaviors are quite similar to each other, though model 2.5 clearly is lagging behind models 1.4 and 1.8 in achieving homogenization. Even still, the dispersion in model 2.5 drops down to a low value within 500 yr of evolution, compared to within 300 yr for models 1.4 and 1.8. Again, the rate at which a MGU disk homogenizes an initial heterogeneity appears to be relatively independent of the initial degree of gravitational instability, at least for the range of disk models examined here. Furthermore, the degree to which the dispersion is reduced also appears to be relatively independent of the initial Toomre value.
Figures 10 and 11 imply that the dispersion drops rapidly to equally low values for MGU disks, but that the dispersion does not fall to zero. In order to investigate the extent to which the dispersion might reach an asymptotic or steady level, several of the models were evolved for considerably longer periods of time than in the previous 10 AU disk models (Boss 2008), none of which were calculated for more than 1500 yr.
Figure 12 shows the evolution of the dispersion for model 1.4 for nearly 3000 yr, with the dispersion being plotted separately for both the inner (1 to 5.5 AU) and outer (5.5 to 10 AU) disks. Figure 12 shows that over time periods of 3000 yr, the dispersion does not disappear, but remains finite at a level of less than 15%. Figure 13 replots the same data as Figure 12, but with the vertical scale altered to reveal the finer details of the evolution of the dispersion in model 1.4. Clearly mixing and transport in a MGU disk are chaotic processes, with transient periods of variable heterogeneity, though to some extent this apparent variability is caused by the transient behavior of the underlying gas density field, as it is being accreted by the central protostar, or is being piled up artificially at the outer disk boundary. Since the gas density field is a normalizing factor in the calculation of the dispersion, the chaotic behavior seen in Figure 13 cannot be attributed solely to mixing and transport of the color field. Nevertheless, the gross features evident in Figure 13 are clearly driven by the color field evolution, as shown by previous models, where, e.g., very low gas density regions were excluded from the dispersion calculation (Boss 2007).
Figure 13 shows that for model 1.4, the dispersion is typically significantly lower in the outer disk than in the inner disk. Figures 14, 15, and 16 display the evolution of the dispersions for models 16, 1.8, and 2.5, respectively, showing that this same trend of lower dispersion in the outer disk compared to the inner disk is independent of both the disk’s effective gravitational spatial resolution (model 16) and the disk’s initial degree of gravitational instability (models 1.8 and 2.5). Note that while Figures 14 and 15 imply dispersions that are increasing somewhat after 1500 yr, a comparison with Figure 12 for model 1.4 shows that such increases are likely only transitory, and that if calculated further, the dispersions for models 16 and 1.8 would also behave like that of model 1.4.
It is useful to compare these results with those from model 15S of Boss (2006), which is identical to the present model 1.4 (9S) except for having the injection occur at 15 AU on the surface of a disk extending from 4 to 20 AU. Model 15S thus explores the evolution of the dispersion at greater radial distances than the present models do. Figure 17 shows the evolution of the dispersion for model 15S over a time period up to 6000 yr, showing that in this disk, the dispersion hovers around values of 10% to 15% in the outer disk (12 to 20 AU) and around values of 1% to 2% from 4 to 12 AU. In a sense, this is in the reverse sense of the models in this paper, but in reality this is entirely consistent: MGU disks result in the most efficient homogenization in the region where the gas giant planets are trying to form, roughly 5 to 10 AU, where the gravitational torques are the strongest, while the degree of homogenization attained is measurably lesser in the regions both interior to (i.e., inside 5 AU) and exterior to (i.e., outside 10 AU) the gas giant planet formation region.
It is also interesting to determine the extent to which the MGU disk evolves during the time periods covered by these models. Figure 18 shows the time evolution of the mass accretion rate from the disk onto the central protostar for model 1.8, which effectively means any disk mass that passes through the inner disk boundary at 1 AU. Figure 18 shows that mass accretion rate in these MGU disks is highly variable, with mass accretion rates that can vary by almost 10 orders of magnitude over time periods of a few hundred years. However, the initially highly variable accretion rates must be in part a result of starting off the evolutions from a nearly axisymmetric, yet MGU disk: the disk must then quickly adust to the fact that it should be highly non-axisymmetric. [Note that Boss (2007) studied injection onto disks that had already been evolving for several hundred years, and found similar evolutions of the color field dispersion as in the present models, so the choice of the initial disk model does not seem to have a significant effect on the mixing and transport processes.] After several hundred years of evolution, the mass accretion rate becomes less chaotic, though it still varies by factors of to over short time scales. The evolution of the dispersion during this latter time period appears to be more or less independent of this decrease in the mean mass accretion rate (Figures 12 and 13), implying that the degree of homogeneity achieved is not strongly dependent on the central protostar’s mass accretion rate.
During the model 1.8 evolution for 2244 yr, the mean mass accretion rate drops from about yr-1 to yr-1. Even the latter rate is quite high, however, and ultimately unsustainable for a MGU disk. Figure 19 plots the growth in mass of the central protostar for model 1.8, showing that the protostar gains during the evolution, i.e., about 60% of the total available initial disk mass of . During the same time period, the protostar accretes 48% of the initial color field, a somewhat smaller fraction, given the need for the color field to be first transported inward 7.5 AU before it can pass inside 1 AU. Because the inner disk is initially color free, yet begins accreting onto the protostar as soon as the evolution starts, the accreted material is initially color-free, which could reduce the RSS dispersion even if no mixing were occurring. By 268 yr for model 1.8, 20% of the disk mass has entered the protostar, while only 1% of the color field has been accreted. As a result, a portion of the sharp initial declines in the dispersions seen in Figure 11 could be due to the initial accretion of necessarily color-free disk gas, given the color field injection at 8.5 AU. However, this initial effect must be a small portion of the total drop seen in Figure 11, since the dispersion is defined to be the root of the sum of the squares [RSS] of the differences from the mean of the color field density divided by the gas density, and in regions where the color field is zero, the gas density is irrelevant, as their ratio is zero regardless of the value of the gas density. Hence color-free regions enter into the dispersion with the same weight, regardless of their gas density. This conclusion is supported by the fact that the same sharp drops in dispersion are seen in models identical to model 1.4 except for having the color field injected at 2 AU rather than at 8.5 AU (Boss 2008), so that the color field is much more quickly accreted onto the protostar. Hence this initial color-free accretion phase does not appear to be the dominant effect seen in Figure 11; rather, mixing in the MGU disk dominates.
The MGU phase for model 1.8 is winding down toward the end of the evolution, as can be seen in Figure 19 by the approach of the central protostar mass toward an asymptotic value. MGU disks thus appear to evolve in an inherently transient manner: some process, such as MRI instability in the ionized surface or outer disk layers, or onging accretion from the placental dense molecular cloud core, may lead to a pile-up of disk mass that initiates a new phase of MGU evolution.
5 Discussion
5.1 Cosmochemical Constraints
Cosmochemical studies of meteoritical and terrestrial samples have constrained the degree of isotopic heterogeneity in the inner solar system, and hence of the inner solar nebula at the time of formation of the first solids. The SLRI 26Al appears to have been homogeneously distributed to within percentages ranging from 5% (Bouvier & Wadhwa 2010) to 10% (Villeneuve et al. 2009) to 30% (Schiller et al. 2010). Similarly, the SLRI 60Fe appears to have been homogeneously distributed to within percentages ranging from 10% (Dauphas et al. 2008) to 15% (Moynier et al. 2009). The SLRI 41Ca appears to have been even much more homogeneously distributed to within 0.1% (Simon & DePaolo 2010). Similarly, 54Cr appears to have been homogeneously distributed to within 0.1% (Dauphas et al. 2010; Yamakawa et al. 2010; Qin et al. 2010; Yamashita et al. 2010), as was Ti (Leya et al. 2009; Trinquier et al. 2009).
Stable oxygen isotope variations, on the other hand, vary by as much as 10% (Clayton 1993) to 20% (Sakamoto et al. 2007) across the solar system. Variations in the stable oxygen isotope ratios measured in the rim of a single CAI imply that this CAI had been transported to regions of the solar nebula with oxygen isotope ratios varying by as much as 3% above the most 16O-poor regions (Simon et al. 2011).
Some of the finite heterogeneity inferred for the meteoritical samples may have been caused by parent body processing rather than by nebular heterogeneity (Yokoyama, Alexander, & Walker 2011), implying that the nebula may have been even more homogeneous than these studies suggest. However, the planetary accretion process itself tends to homogenize bulk compositions (e.g., Simon, DePaolo, & Moynier 2009), which works in the opposite direction of allowing greater nebular isotopic heterogeneity. While the cosmochemical record thus cannot be considered to be perfectly clear, the need for a physical mechanism capable of homogenizing initial isotopic heterogeneities to dispersions ranging from as small as 0.1% to as large as 10% seems to be required. This finite level of residual nebular spatial heterogeneity appears to be related to the relatively coarse mixing achieved by spiral arms, with radial widths of order 1 AU, over time scales of up to 3000 yr, as shown by the present and previous models (e.g., Boss 2006, 2007).
5.2 Observational Constraints
Observations of the turbulent linewidths of molecular species in protoplanetary disks imply a turbulent viscosity parameter with a value of (Hughes et al. 2011). While Ciesla (2007) showed results for 0.002 and 0.0002, Ciesla (2010b) studied particle trajectories in disks with ranging from 0.01 to 0.0001, finding that in the former disks, particles were transported rapidly through the disk, while in the latter, transport was much slower. Boss (2004a) estimated that the effective -viscosity of the MGU disks he studied was 0.001. MGU disks evolve to a certain degree in a manner similar to generic turbulent viscosity accretion disks (Lodato & Rice 2004, 2005), so one could just as well imagine the driving mechanism for generic accretion disk evolution to be due to MGU as to MRI.
Crystalline mass fractions in 1 to 2 Myr-old disks do not appear to correlate with properties such as stellar mass or luminosity, stellar accretion rate, disk mass, or disk to star ratio, as might be expected for any mechanism based on large-scale transport (Watson et al. 2009). Other arguments have been presented as well in favor of local heating processes rather than large-scale transport, namely differences in the abundances of different crystalline silicate species between the hot innermost disk ( 1 AU) and the cooler outer disk beyond 5 AU (Bouwman et al. 2008). However, the present models show that the extent of mixing and transport in MGU disks is not strongly dependent on the initial Toomre stability parameter, implying that any variation with observational parameters such as stellar mass, disk mass, etc., may also not be as strong as might otherwise be expected.
Miller et al. (2011) detected an FU Orionis outburst in a classical T Tauri star, a Class II-type object where the disk is typically thought to be no more massive that . However, this occurence of an FU Orionis outburst in LkH 188-G4 shows that even the disks around Class II-type objects can be subject to transient instabilities that produce high mass acretion rates onto the central protostar. Gravitational instabilities of the type studied here are the leading candidate for producing FU Orionis outbursts (e.g., Zhu et al. 2009); the mass accretion rates shown in Figure 18 strongly support this candidacy.
6 Conclusions
All eight of these new models evolve in much the same manner as model 9S of Boss (2008): the initially high degree of SLRI heterogeneity is lowered by mixing within 500 yrs to a dispersion of 10% inside 5 AU and 2% from 5 AU to 10 AU. Combined with previous results for disks extending to 20 AU (Boss 2007), yielding dispersions of 10% beyond 10 AU, gradients in isotopic heterogeneity are to be expected in MGU disks. MGU disk models thus make a clear prediction: solids that accreted in the gas giant planet region from 5 to 10 AU should be significantly more isotopically homogenized than those that formed interior to, or exterior to, this region. This bold prediction must be taken with a grain of salt, however, as it presumes locally closed system behavior, and does not take into account other factors, such as the arrival of multiple Rayleigh-Taylor fingers with varying time intervals, or ongoing photochemistry due to self-shielding of CO molecules at the disk’s surfaces.
Given that all meteoritical samples are believed to originate from planetestimals formed in the inner solar nebula, there may not be any measurable cosmochemical consequence of this predicted gradient in isotopic heterogeneity. Nevertheless, the robustness of the present MGU disk models supports the idea of the existence of a low degree of spatial heterogeneity of SLRIs in the inner solar nebula, consistent with the long-held belief that cosmochemical variations in inferred initial 26Al/27Al ratios can be used as accurate chronometers for the timing of planetesimal and planet formation events in the inner solar system. While the FUN inclusions show no evidence for live 26Al and so are thought to have formed prior to the arrival of the first Rayleigh-Taylor finger (Sahijpal & Goswami 1998), most refractory inclusions have 26Al/27Al ratios that scatter by no more than 10% around the mean value of (MacPherson et al. 1995; Young et al. 2005). This level of scatter in 26Al/27Al ratios appears to be consistent with the 10% dispersion expected in the inner regions of disks that have experienced a MGU phase.
However, there may well be a cosmochemically observable signature of this predicted isotopic heterogeneity gradient in comets, and in the interplanetary dust particles (IDPs) that originate in comets. Comets that formed in the region of the gas giant planets are believed to have been kicked outward by close encounters with the giant planets, either to hyperbolic orbits, or to highly eccentric orbits, i.e., to the Oort Cloud (e.g., Paulech et al. 2010). Long-period comets are believed to be derived from the Oort Cloud and thus to have originated from the most isotopically homogeneous region of a MGU disk. Short-period comets, on the other hand, are thought to be derived from the Kuiper Belt, i.e., from an origin in the outer disk (e.g., Levison et al. 2008), where the same high degree of isotopic homogeneity would not have occurred in a MGU disk. Assuming that these ideas about the origins of long-period and short-period comets are correct, MGU disk models make a clear prediction: long-period comets should be more isotopically homogeneous than short-period comets. In addition, both types of comet should contain refractory particles similar to CAIs, such as the Coki particle in Wild 2.
References
- (1)
- (2) Aléon, J., Engrand, C., Leshin, L. A., & McKeegan, K. D. 2009, Geochim. Cosmochim. Acta, 73, 4558
- (3)
- (4) Andrews, S. M., & Williams, J. P. 2007, ApJ, 659, 705
- (5)
- (6) Birnstiel, T., Dullemond. C. P., & Brauer, F. 2009, A&A, 503, L5
- (7)
- (8) Boss, A. P. 1996, ApJ, 469, 906
- (9)
- (10) Boss, A. P. 2004a, ApJ, 616, 1265
- (11)
- (12) Boss, A. P. 2004b, ApJ, 610, 456
- (13)
- (14) Boss, A. P. 2006, Meteorit. Planet. Sci., 41, 1695
- (15)
- (16) Boss, A. P. 2007, ApJ, 660, 1707
- (17)
- (18) Boss, A. P. 2008, Earth Planet. Sci. Lett., 268, 102
- (19)
- (20) Boss, A. P. 2010, ApJ, 725, L145
- (21)
- (22) Boss, A. P., & Durisen, R. H. 2005, ApJ, 621, L137
- (23)
- (24) Boss, A. P., & Keiser, S. A. 2010, ApJ, 717, L1
- (25)
- (26) Boss, A. P., & Myhill, E. A. 1992, ApJS, 83, 311
- (27)
- (28) Boss, A. P., et al. 2008, ApJ, 686, L119
- (29)
- (30) Boss, A. P., et al. 2010, ApJ, 708, 1268
- (31)
- (32) Bouvier, A., & Wadhwa, M. 2010, Nature Geoscience, 3, 637
- (33)
- (34) Bouwman, J., et al. 2008, ApJ, 683, 479
- (35)
- (36) Brownlee, D. E. et al. 2006, Science, 314, 1711
- (37)
- (38) Busemann, H., Nguyen, A. N., Cody, G. D., Hoppe, P., Kilcoyne, A. L. D., Stroud, R. M., Zega, T. J., & Nittler, L. R. 2009, Earth Planet. Sci. Lett., 288, 44
- (39)
- (40) Chambers, J. E. 2008, Icarus, 198, 256
- (41)
- (42) Ciesla, F. J. 2007, Science, 318, 613
- (43)
- (44) Ciesla, F. J. 2008, Meteorit. Planet. Sci., 43, 639
- (45)
- (46) Ciesla, F. J. 2009, Icarus, 200, 655
- (47)
- (48) Ciesla, F. J. 2010a, Icarus, 208, 455
- (49)
- (50) Ciesla, F. J. 2010b, ApJ, 723, 514
- (51)
- (52) Clayton, R. N. 1993, AREPS, 21, 115
- (53)
- (54) Dauphas, N., et al. 2008, ApJ, 686, 560
- (55)
- (56) Dauphas, N., et al. 2010, ApJ, 720, 1577
- (57)
- (58) Gail, H.-P. 2001, A&A, 378, 192
- (59)
- (60) Gail, H.-P. 2002, A&A, 390, 253
- (61)
- (62) Gail, H.-P. 2004, A&A, 413, 571
- (63)
- (64) Foster, P. N., & Boss, A. P. 1997, ApJ, 489, 346
- (65)
- (66) Heinzeller, D., Nomura, H., Walsh, C., & Millar, T. J. 2011, ApJ, 731, 115
- (67)
- (68) Hughes, A. L. H., & Armitage, P. J. 2010, ApJ, 719, 1633
- (69)
- (70) Hughes, A. M., Wilner, D. J., Andrews, S. M., Qi, C., & Hogerheijde, M. R. 2011, ApJ, 727, 85
- (71)
- (72) Inaba, S., Wetherill, G. W., & Ikoma, M. 2003, Icarus, 166, 46
- (73)
- (74) Isella, A., Carpenter, J. M., & Sargent, A. I. 2009, ApJ, 701, 260
- (75)
- (76) Jacquet, E., Fromang, S., & Gounelle, M. 2011, A&A, 526, L8
- (77)
- (78) Kitamura, Y., et al. 2002, ApJ, 581, 357
- (79)
- (80) Lee, J.-E., Bergin, E. A., & Lyons, J. R. 2008, Meteorit. Planet. Sci., 43, 1351
- (81)
- (82) Levison, H. F., Morbidelli, A., VanLaerhoven, C., Gomes, R., & Tsiganis, K. 2008, Icarus, 196, 258
- (83)
- (84) Leya, I., Schönbächler, M., Krähenbühl, U., & Halliday, A. N. 2009, ApJ, 702, 1118
- (85)
- (86) Limongi, M., & Chieffi, A. 2006, ApJ, 647, 1483
- (87)
- (88) Lodato, G., & Rice, W. K. M. 2004, MNRAS, 351, 630
- (89)
- (90) Lodato, G., & Rice, W. K. M. 2005, MNRAS, 358, 1489
- (91)
- (92) Lyons, J. R., & Young, E. D. 2005, Nature, 435, 317
- (93)
- (94) MacPherson, G. J., Davis, A. M. & Zinner, E. K. 1995, Meteoritics, 30, 365
- (95)
- (96) Matsumura, S., & Pudritz, R. E. 2006), MNRAS, 365, 572
- (97)
- (98) Matzel, J. E. P., et al. 2010, Science, 328, 483
- (99)
- (100) Merín, B., et al. 2007, ApJ, 661, 361
- (101)
- (102) Miller, A. A., et al. 2011, ApJ, 730, 80
- (103)
- (104) Mostefaoui, S., Lugmair, G. & Hoppe, P. 2005, ApJ, 625, 271
- (105)
- (106) Moynier, F., Dauphas, N., & Podosek, F. A. 2009, ApJ, 700, L92
- (107)
- (108) Nakamura, T., et al. 2008, Science, 321, 1664
- (109)
- (110) Paulech, T., Jakubík, M., Neslusán, L., Dybczyński, P. A., & Leto, G. 2010, A&A, 509, A48
- (111)
- (112) Pessah, M. E., Chan, C., & Psaltis, D. 2008, MNRAS, 383, 683
- (113)
- (114) Qin, L., Alexander, C. M. O’D., Carlson, R. W., Horan, M. F., & Yokoyama, T. 2010, Geochim. Cosmochim. Acta, 74, 1122
- (115)
- (116) Sahijpal, S., & Goswami, J. N. 1998, ApJ, 509, L137
- (117)
- (118) Sahijpal, S., & Soni, P. 2006, Meteorit. Planet. Sci., 41, 953
- (119)
- (120) Sakamoto, N., Seto, Y. Itoh, S., Kuramoto, K, Fujino, K., Nagashima, K., Krot, A. N., & Yurimoto, H. 2007, Science, 317, 231
- (121)
- (122) Sargent, B. A., et al. 2009a, ApJ, 690, 1193
- (123)
- (124) Sargent, B. A., et al. 2009b, ApJS, 182, 477
- (125)
- (126) Schiller, M., Handler, M. R., & Baker, J. A. 2010, Earth Planet. Sci. Lett., 297, 165
- (127)
- (128) Simon, J. I., & DePaolo, D. J. 2010, Earth Planet. Sci. Lett., 289, 457
- (129)
- (130) Simon, J. I., DePaolo, D. J., & Moynier, F. 2009, ApJ, 702, 707
- (131)
- (132) Simon, J. I., et al. 2011, Science, 331, 1175
- (133)
- (134) Simon, S. B., et al. 2008, Meteorit. Planet. Sci., 43, 1861
- (135)
- (136) Speck, A. K., Whittingdon, A. G., & Tartar, J. B. 2008, ApJ, 687, L91
- (137)
- (138) Tachibana, S., et al. 2006, ApJ, 639, L87
- (139)
- (140) Thrane, K., Bizzarro, M., & Baker, J. A. 2006, ApJ, 646, L159
- (141)
- (142) Trinquier, A., Elliott, T., Ulfbeck, D., Coath, C., Krot, A. N., & Bizzarro, M. 2009, Science, 324, 374
- (143)
- (144) Tscharnuter, W. M., & Gail, H.-P. 2007, A&A, 463, 369
- (145)
- (146) Villeneuve, J., Chaussidon, M., & Libourel, G. 2009, Science, 325, 985
- (147)
- (148) Watson, D. M., et al. 2009, ApJS, 180, 84
- (149)
- (150) Westphal, A. J., Fakra, S. C., Gainsforth, Z., Marcus, M. A., Ogliore, R. C., & Butterworth, A. L. 2009, ApJ, 694, 18
- (151)
- (152) Yamakawa, A., Yamashita, K., Makashima, A., & Nakamura, E. 2010, ApJ, 720, 150
- (153)
- (154) Yamashita, K., Maruyama, S., Yamakawa, A., & Nakamura, E. 2010, ApJ, 723, 20
- (155)
- (156) Yokoyama, T., Alexander, C. M. O’D., & Walker, R. J. 2011, Earth Planet. Sci. Lett., 305, 115
- (157)
- (158) Young, E. D., Simon, J. I., Galy, A., Russell, S. S., Tonui, E., & Lovera, O. 2005, Science, 308, 223
- (159)
- (160) Zhu, Z., Hartmann, L., Gammie, C., & McKinney, J. C. 2009, ApJ, 701, 620
- (161)
| model | ||||
|---|---|---|---|---|
| 16 | 16 | 1.4 | 40 | 1621 |
| 48 | 48 | 1.4 | 40 | 455 |
| 1.4 | 32 | 1.4 | 40 | 2834 |
| 1.8 | 32 | 1.8 | 60 | 2244 |
| 1.9 | 32 | 1.9 | 70 | 2258 |
| 2.0 | 32 | 2.0 | 80 | 275 |
| 2.3 | 32 | 2.3 | 100 | 1588 |
| 2.5 | 32 | 2.5 | 120 | 1548 |