CP Violation with at the Tevatron
Brad Abbott
University of Oklahoma, Norman, OK, 73019, USA
Abstract
Recent results using decays for measuring the CP violating phase, , and the decay width difference for the two mass eigenstates, , are presented from the CDF and D0 experiments at the Fermilab Tevatron collider.
PRESENTED AT
The Ninth International Conference on
Flavor Physics and CP Violation
(FPCP 2011)
Maale Hachamisha, Israel, May 23–27, 2011
1 Introduction
In the Standard Model (SM) the heavy (H) and light (L) mass eigenstates in the system are predicted to have a large decay width difference, . For decays, a CP-violating phase appears due to the interference in the decay with and without mixing. This CP violating phase, , is expected to be small and have a value = -0.038 0.002 [1, 2]. Beyond the SM physics processes can alter this phase to providing an unambiguous measurement of new physics if the measured CP violating phase is large.
2 Measurement using decays
The decay of involves the decay of a pseudo-scalar into two vector mesons. In the rest frame of the there are three possible angular momentum states L=0,1,2. The final state is an admixture of CP even (L=0,2) and CP-odd (L=1) states so an angular analysis must be performed to disentangle the final states. For this purpose, the transversity basis [3] is used by both experiments as it gives direct access to the CP related quantities.
In the transversity basis there are 3 independent complex amplitudes , , and . By measuring the angles , and it is possible to disentangle the 3 final states and measure the CP eigenstates. The time dependent angular distribution is a function of various parameters:
where and are strong phases. By fitting the time dependent angular distribution, it is possible to extract the parameters of interest.
Flavor tagging the initial state is very useful in this measurement. Without flavor tagging, there is a sign ambiguity on the weak phase for a given . Flavor tagging the initial state as a or a allows the removal of this ambiguity and also provides an improved measurement of the parameters and .
The first measurements by D0 and CDF were made with 1 fb-1 of data [4, 5]. Both experiments performed untagged analyses and found results consistent with the SM at 1.5 . The D0 experiment measured = 0.79 0.56 (stat) (syst.) and = 0.17 0.09(stat) 0.02(syst.). CDF measured the probability of a deviation from the SM as large as was observed in the data at 15%.
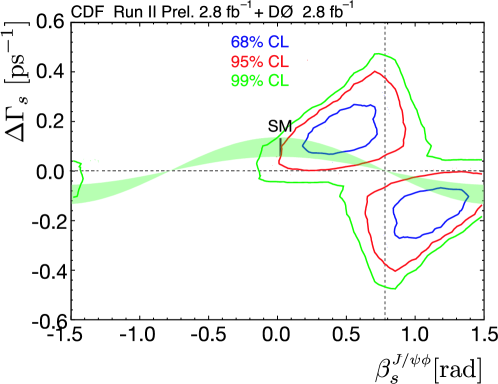
With a larger data set of 2.8 fb-1 both experiments performed a flavor tagged analysis [6, 7]. The results from both experiments were consistent and both showed an approximately 1.8 deviation from the SM expectations. The two experiments combined their results [8] giving a 2.1 deviation from the SM expectation (SM p-value=3.4%), see Figure 1.
3 Recent Results
Larger data sets have allowed additional parameters to be extracted from the fits and have reduced the uncertainties on the measurements. In addition, improved event selection from D0 and improved particle ID, use of a neural net, improved same side flavor tagging and potential S-wave contributions have been incorporated by CDF.
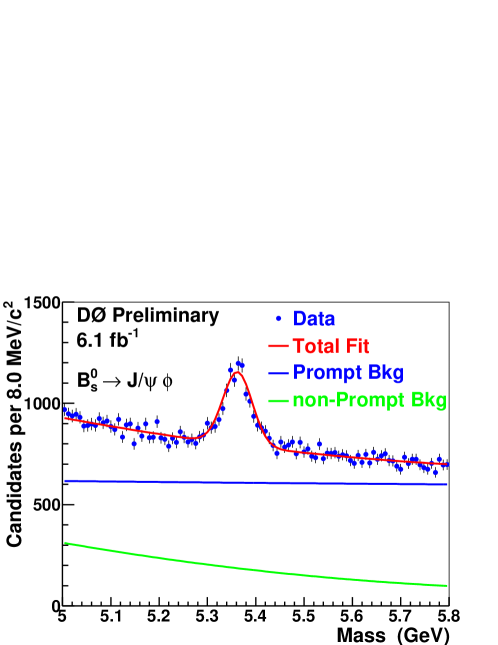
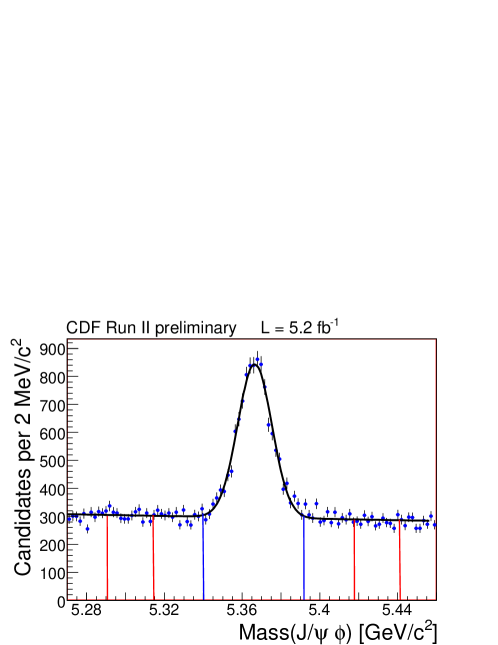
Both experiments apply similar event selection based on kinematical quantities (Transverse momentum of , kaons and ) and both experiments require good quality on all four tracks used to reconstruct the , and the four track vertex must have a minimum value. In addition, CDF applies an additional neural net selection by combining particle ID with the kinematical variables. Figures 2 and 3 show the yields from D0 (6.1 fb-1) and CDF (5.2 fb-1).
Flavor tagging has also been improved from both experiments. For opposite side tagging, both experiments use a likelihood ratio or neural net as a discriminating variable using an electron or muon from the opposite side decay, the charge of the reconstructed opposite decay vertex and opposite tracks charge (D0).
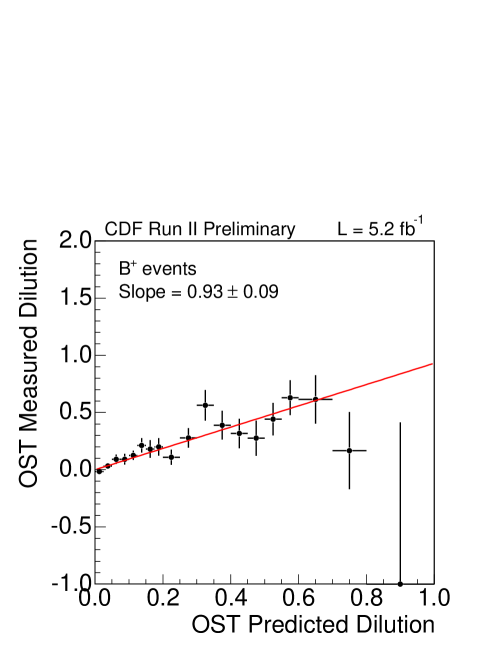
The flavor tagging power can be characterized as where is the efficiency to provide a flavor tag and is the dilution defined as .
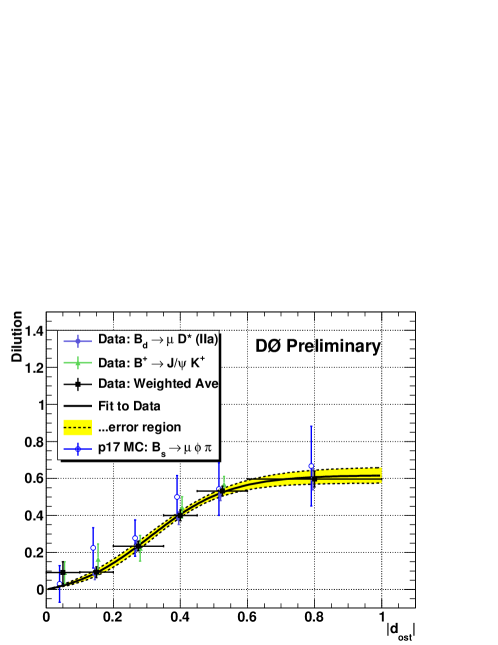
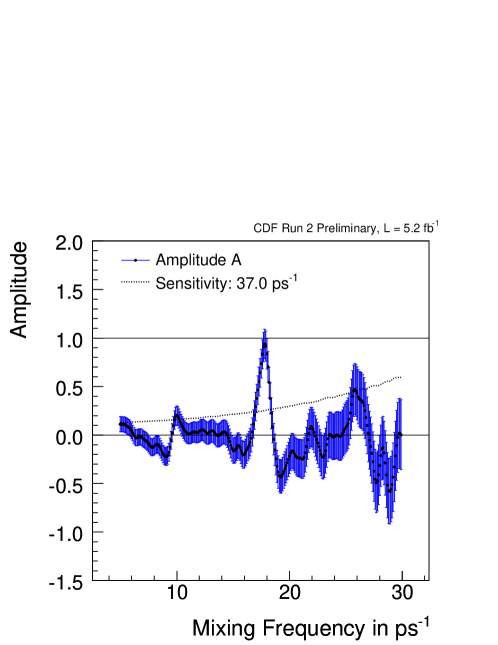
In addition, CDF uses same sign tagging by using the sign of the charged kaon produced during fragmentation. Charged kaons are identified by using dE/dx information and the time of flight. The same sign kaon tagging was recalibrated for this measurement by using mixing using several different decay modes. The value of found from the calibration is 17.79 0.07(stat) fb-1, see Figure 6, which is consistent with the PDG [9]. The measured amplitude is used to scale the same side tagger.
The opposite side tagging power measured at D0 is 2.5%. CDF measures an opposite side tagger power of 1.2% and a same side tagging power of 3.1%. During fitting, the measured value of the dilution is included on an event-by-event basis as a tagging probability.
Possible S-wave contributions can arise due to or non-resonant production. Both of these contributions give a flat distribution under the mass peak. CDF has measured the S-wave contribution, finding a value of less than 6.7% for 1.009 1.028 GeV at the 95% C.L.
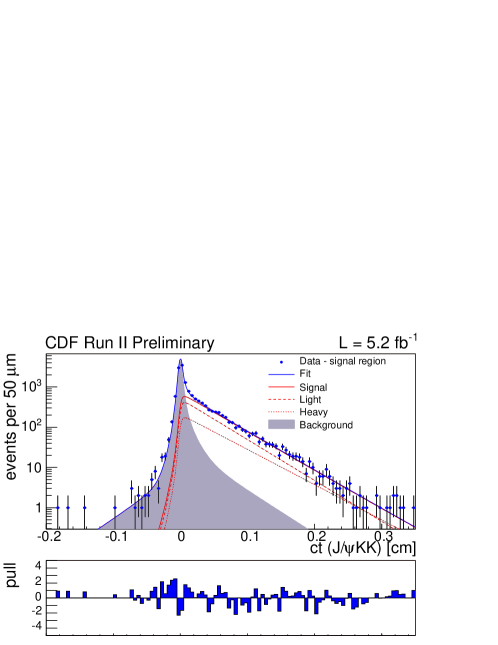
The lifetime distribution obtained at CDF is shown in Figure 7. Assuming no CP violation in the system, CDF obtains the most precise single measurements of lifetime and decay width difference: = 1.53 0.025(stat) 0.012 (syst.) ps and = 0.075 0.025 (stat) 0.01 (syst.) ps-1.
For D0 a multidimensional fit is performed applying a Gaussian constraint on [9] and on the strong phases . The values of are obtained from decays under a U(3) flavor asymmetry assumption. D0 additionally assumes that the S-wave contribution is small and is not included in the fit.
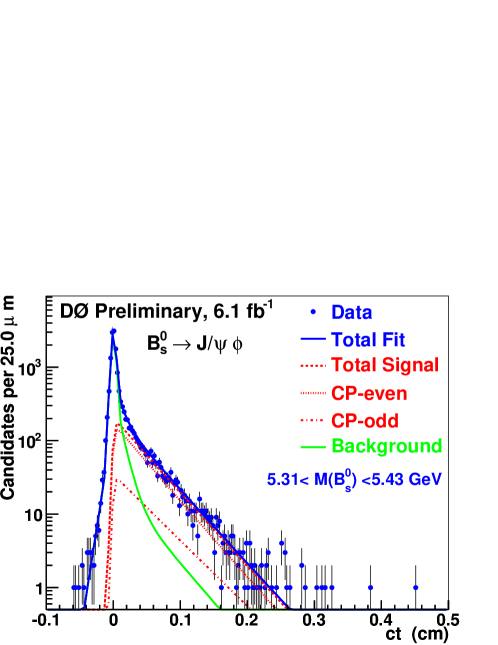
Figure 8 shows the lifetime distribution obtained at D0. D0 obtains: = 1.45 0.04(stat) 0.01 (syst.) ps and = 0.15 0.06(stat) 0.01(syst.) ps-1 and = -0.76 0.37 (stat) 0.02(syst.).
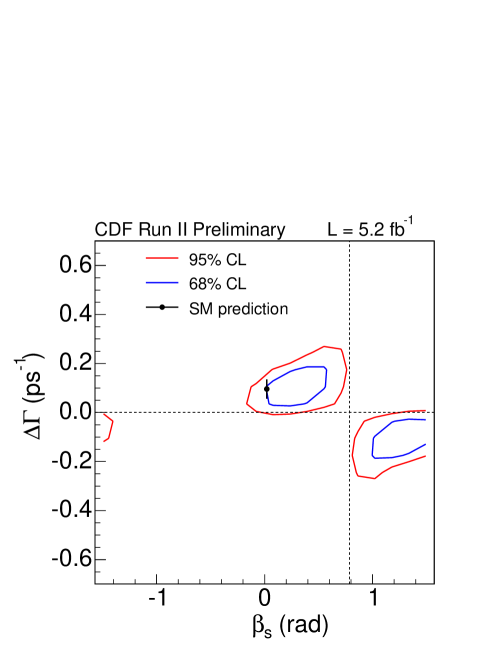
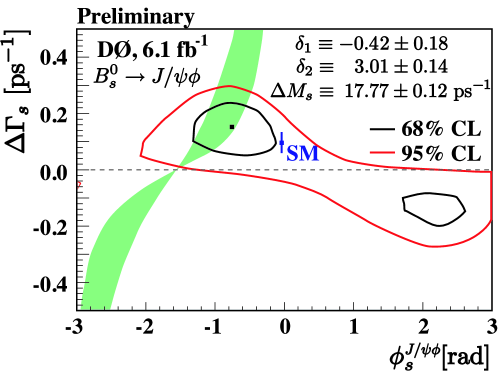
Contours in the - plane (- plane) are generated for each experiment and are shown in Figures 9 and 10. D0 measures 0.014 .263 ps-1 with -1.65 0.24 and -0.235 -0.040 ps-1 with 1.14 2.93 at the 95% C.L. CDF finds [0.02,0.52] [1.08,1.55] at the 68% C.L. The p-value of the SM central point = 44% (0.8 deviation from SM)
4 Conclusion
Using 5.2 fb-1 and 6.1 fb-1 of data respectively, the CDF and D0 experiments at the Tevatron have made the most direct and precise experimental measurements on the CP violating phase and the mass eigenstates width difference using decays. The latest results have significantly reduced uncertainties and are consistent with previous results. Both experiments are planning on updating their measurements using improved analysis techniques with the full data set.
References
- [1] A. Lenz and U. Nierste, J. High Energy Physics 0706,072 (2007)
- [2] M. Bona et al., J. High Energy Physics bf 0610,081 (2006)
- [3] A. Dighe, I. Dunietz, H. Lipkin, J. Rosner, PLB 369, 144 (1996)
- [4] V.M. Abazov et al., (D0 collaboration) Phys. Rev. Lett. 98, 121801 (2007)
- [5] T. Aaltonen et al., (CDF collaboration) Phys. Rev. Lett. 100, 161802 (2008)
- [6] V.M. Abazov et al., (D0 collaboration) Phys. Rev. Lett. 101, 241801 (2008)
-
[7]
CDF collaboration, public note 9458
http://www-cdf.fnal.gov/physics/new/bottom/
080724.blessed-taggedBsJPsiPhiupdateprelim/ -
[8]
D0 public note 5928
http://www-d0.fnal.gov/Run2Physics/WWW/results/prelim/B/B59/ - [9] K. Nakamura et al., (Particle Data Group), J. Phys. G 37, 075021 (2010).