Defect and solute properties in dilute Fe-Cr-Ni austenitic alloys from first principles
Abstract
We present results of an extensive set of first-principles density functional theory calculations of point defect formation, binding and clustering energies in austenitic Fe with dilute concentrations of Cr and Ni solutes. A large number of possible collinear magnetic structures were investigated as appropriate reference states for austenite. We found that the antiferromagnetic single- and double-layer structures with tetragonal relaxation of the unit cell were the most suitable reference states and highlighted the inherent instabilities in the ferromagnetic states. Test calculations for the presence and influence of non-collinear magnetism were performed but proved mostly negative. We calculate the vacancy formation energy to be between 1.8 and 1.95 eV. Vacancy cluster binding was initially weak at 0.1 eV for divacancies but rapidly increased with additional vacancies. Clusters of up to six vacancies were studied and a highly stable octahedral cluster and stacking fault tetrahedron were found with total binding energies of 2.5 and 2.3 eV, respectively. The dumbbell was found to be the most stable self-interstitial with a formation energy of between 3.2 and 3.6 eV and was found to form strongly bound clusters, consistent with other fcc metals. Pair interaction models were found to be capable of capturing the trends in the defect cluster binding energy data. Solute-solute interactions were found to be weak in general, with a maximal positive binding of 0.1 eV found for Ni-Ni pairs and maximum repulsion found for Cr-Cr pairs of -0.1 eV. Solute cluster binding was found to be consistent with a pair interaction model, with Ni-rich clusters being the most stable. Solute-defect interactions were consistent with Ni and Cr being modestly oversized and undersized solutes, respectively, which is exactly opposite to the experimentally derived size factors for Ni and Cr solutes in type 316 stainless steel and in the pure materials. Ni was found to bind to the vacancy and to the dumbbell in the tensile site by 0.1 eV and was repelled from mixed and compressive sites. In contrast, Cr showed a preferential binding to interstitials. Calculation of tracer diffusion coefficients found that Ni diffuses significantly more slowly than both Cr and Fe, which is consistent with the standard mechanism used to explain radiation-induced segregation effects in Fe-Cr-Ni austenitic alloys by vacancy-mediated diffusion. Comparison of our results with those for bcc Fe showed strong similarity for pure Fe and no correlation with dilute Ni and Cr.
pacs:
61.82.Bg, 71.15.Mb, 75.50.BbI Introduction
Austenitic, face-centred cubic (fcc), -Fe based steels are key materials in many applications. However, modelling the basic form, -Fe, is challenging because it is metastable under the zero-temperature conditions typically used in quantum mechanical calculation. The high temperature stabilisation of fcc over ferromagnetic (fm) body centred cubic (bcc) -Fe at 1185 K is due primarily to the onset of paramagnetism which contributes a considerable amount of entropy in the fcc form. Phonon and electronic entropy also contribute, but the primacy of the magnetic effect is underlined by the return to paramagnetic bcc -Fe at still higher temperature (1667 K).
There has been considerable experimental effort to stabilise -Fe at lower temperatures, primarily by epitaxial growth of thin films on Cu substrates (e.g. MeyerheimMeyerheim ) and by the formation of -Fe precipitates by heat treatment of dilute alloys of Fe in fcc Cu (e.g. TsunodaTsunoda and HinesHines ). For a review of earlier work see Marsman and HafnerGammaFeMarsman . The principal motivation behind this effort has been to study the structural and magnetic properties of -Fe at temperatures low enough for stable magnetic ordering. The study of point defects in these systems has not been attempted.
First-principles calculations have proved to be a very reliable method of obtaining information about radiation-induced defects, which previously had been unreliably calculated using empirical potentials. In non-magnetic elements such as molybdenum and vanadium it was shown that the pseudopotential plane-wave method reproduced experimentally-inferred self-interstitial migration energy barriers to within 0.1 eVMoV , giving confidence that experimentally inaccessible quantities such as interstitial formation energies would also be reliable. This is assisted by the discovery that the strain fields associated with interstitials are less extensive than had been predicted by interatomic potentialsMoV ; AcklandA ; VDiff ; EAM , such that calculations with supercells as small as 100 atoms can give near-converged solutions.
Application of density functional theory (DFT) to steels is of particular interest for radiation damage applications in which high-energy defects such as self-interstitials are formed. Modelling commercial steels is a more complicated task on account of their multicomponent nature, however, there has been much progress in ferritic Fe (e.g. the results of the European FP6 PERFECT projectabInitioPerfect and references therein) and Fe-Cr alloysFeCrOlssonA ; FeCrMirzoevA ; FeCrOlssonB ; FeCrKlaverA ; FeCrOlssonC ; FeCrKlaverB which showed a number of unexpected outcomes. In particular, isolated Cr atoms have a small negative heat of solution in -FeFeCrOlssonA ; FeCrMirzoevA , in apparent conflict with the phase diagramFeCrChen which shows a miscibility gap. This conundrum was resolvedFeCrOlssonB ; FeCrKlaverA when it was shown that Cr atoms in bcc Fe exhibit strong nearest neighbour repulsion, resulting from magnetic frustration, with weaker repulsion still present up to sixth-nearest-neighbour separationFeCrKlaverA . Consequently, a dilute solution of Cr in -Fe has a negative heat of formation only up to at most 10 at. % (at 0 K), a result that is consistent with experimental results for the heat of solution and short-range order parameter, as discussed by Bonny et al.FeCrBonny , but was not included in the extrapolations present in the phase diagram. The nonlinear variation of cohesive energy with concentration means that determining unambiguous energies for quantities such as the binding of a self-interstitial to a Cr solute proved impossible in concentrated alloysFeCrKlaverB since the calculated energy had a complex dependence, not only on the defect, but also on concentration and the atomic arrangement.
First-principles studies of -Fe with collinearGammaFeHerper ; GammaFeSpisak ; GammaFeDomain ; GammaFeJiang ; GammaFeKong and non-collinearGammaFeKorling ; GammaFeMarsman magnetism have found many distinct magnetically ordered and spin spiral (meta)stable states lying (approximately) between 0.08 and 0.15 eV/atom above the bcc ferromagnetic ground state, -Fe. However, techniques allowing reliable first-principles calculations of the paramagnetic state of -Fe are only just beginning to appear in the literature e.g. the work of Körmann et al. and references thereinKormann . There remains some debate about whether the paramagnetism is best represented as itinerant or involves localised moments on the ions, however, throughout this paper we interpret our results through the localised-moment picture. From a purely numerical point of view there are also difficulties. The Kohn-Sham functional applied in non-magnetic DFT has a single minimum with respect to the wavefunctions, but collinear-magnetic DFT may have up to minima for an N-atom supercell, corresponding to possible permutations of the spin. In practice, most of these will be unstable but one can never be sure that the lowest energy structure has been reached. The concept of metastability is also slippery, since the numerical algorithms used to find the minimum electronic energy do not correspond to physical pathways which the material can follow: The very definition of metastability is then, to some extent, algorithm dependent.
The Born-Oppenheimer approximation is used to decouple electronic and atomic degrees of freedom. The status of magnetic degrees of freedom in this approximation is debatable. One viewpoint is that, since magnetism is due to electrons, the Born-Oppenheimer surface is the one corresponding to the magnetic state with the lowest energy globally. An alternative view, which we adopt here, is that there are many Born-Oppenheimer surfaces, each corresponding to a given magnetic ordering. Many of the magnetic states in fcc Fe are sufficiently metastable to make this a useful distinction. It should, however, be borne in mind that DFT calculations are almost exclusively performed using a numerical algorithm which minimises the energy of the system with respect to the free parameters of a set of basis functions used to represent the wavefunction. This algorithm does not correspond to any physical trajectory which the electrons could follow (c.f. time dependent DFT). Consequently “local minimum” means a minimum from which the algorithm, in our case block DavidsonDavidson , cannot escape in this basis set. It does not guarantee that the spin-state will be a local minimum in reality.
To date (and to the best of our knowledge) only a few first-principles studies of solutes and impurities have been performed in austenitic FeGammaFeJiang ; GammaFeKong ; GavriljukA ; Boukhvalov ; FeCrMirzoevB ; Abrikosov ; GavriljukB ; Nazarov and only the work of NazarovNazarov includes defect calculations (in order to study vacancy-hydrogen interactions). There exists no comprehensive study of point defects and their interactions in pure fcc Fe or in dilute solid solutions of Ni and Cr in fcc Fe. We present here just such a study using a set of magnetically ordered states to represent the paramagnetic state of -Fe. By considering more than one magnetic state we are able to estimate the accuracy of this assumption. This approach is certainly not ideal but is consistent with the constraint presented by first-principles calculations, which are performed at 0 K, where the lowest energy states dominate. Any conclusions that we make for the paramagnetic state of -Fe are clearly within the confines of this approach.
We also intend this work to provide a basis for understanding the complex interactions present in concentrated Fe-Cr-Ni fcc alloys. We study the relatively simple dilute case here to gain insight into the Fe-Cr-Ni system and any extrapolations to concentrated alloys do not include possible many body concentration dependent effects.
The layout of the paper is as follows. Section II contains the computational details of the DFT calculations performed in this work. In Sec. III we present and discuss our results on the bulk properties and stability of the magnetic reference states. The energetics of point defects in pure Fe and their interactions are discussed in Sec. IV, as is their tendency to form small defect clusters relevant in the nucleation of microscopic defects such as voids and dislocation loops. The results of dilute Ni and Cr solute calculations in defect free Fe and in interaction with point defects are presented and discussed in Sec. V. Finally, we make our conclusions in Sec. VI.
II Computational Details
All of the following calculations have been performed using the mainstream DFT code VASPKresseHafner ; KresseFurthmuller , a plane-wave code that implements the projector augmented wave (PAW) methodBlochl ; KresseJoubert . Standard PAW potentials supplied with VASP were used with exchange and correlation in the generalised gradient approximation described by the parametrisation of Perdew and WangPW91 and spin interpolation of the correlation potential provided by the improved Vosko-Wilk-Nusair schemevwn . Potentials with 8, 6 and 10 valence electrons were used for Fe, Cr and Ni, respectively.
The local magnetic moments on atoms were initialised to impose the magnetic state ordering and were then allowed to relax. The relaxed local magnetic moments were determined by integrating the spin density within spheres centred on the atoms. Sphere radii of 1.302, 1.323 and 1.286 were used for Fe, Cr and Ni, respectively.
Calculations of the bulk properties for Fe, Cr and Ni were performed with a sufficiently high plane-wave cutoff energy (400 eV) and sufficiently dense -point sampling of the Brillouin zone (e.g. Monkhorst-Pack grid for a conventional bcc cell) to ensure convergence of the energy of the system to less than 1 meV per atom.
Elastic constants were determined numerically using stress tensor measurements after applying small (1-2%) strain deformations to the equilibrium structures. These were cross-checked, where possible, with comparable determinations using the energy. Ensuring convergence of the elastic constants placed significantly higher demands on our calculations than for other bulk properties. A plane-wave cutoff energy of 600 eV was used and sufficient -point sampling to ensure that the elastic constants were converged to 2 GPa, e.g. a Monkhorst-Pack grid for a conventional unit cell of the fcc ferromagnetic low-spin (fm-LS) magnetic state. It was also necessary to reduce the energy convergence criteria for electronic minimisation to eV.
Formation energies of defects and solutes were calculated in supercells of 256 (, ,…) atoms, with supercell dimensions held fixed at their equilibrium values and ionic positions free to relax. For these supercells a -point Monkhorst-Pack grid was used to sample the Brillouin zone. Test calculations showed this sampling to be sufficient to converge formation energies to less than 0.05 eV in all calculations except those involving interstitial defects, where the uncertainty could be as high as 0.1 eV Supp . Formation energy differences and binding energies were found to be converged to less than 0.03 eV except in calculations involving interstitial defects where the error was found to be 0.04 eV Supp . These errors are sufficiently small for our purposes. Performing calculations in a fixed supercell of volume, , results in a residual pressure, , for which an Eshelby-type elastic correction for finite size to the system energyAcklandA ; HanA of , where is the bulk modulus of the bulk material, can be applied and also serves to indicate the likely error. The size of these corrections is negligible in much of the work presented here, being smaller than other sources of error in our calculations. However, in the largest of our vacancy cluster calculation and in those containing overcoordinated defects these finite size corrections are of relevance and are discussed in the corresponding text.
Our data are the result of the merging of two sets of data, one calculated in the single-layer anti-ferromagnetic (afmI) face centred tetragonal (fct) state, the other mainly in the double layer anti-ferromagnetic (afmD) state in either of fcc and fct structures but also including some fct ferromagnetic high-spin (fm-HS) calculations. The plane-wave cutoff energy was taken to be 300 eV for the afmI calculations and 350 eV in all others. The non-convergence error in the formation energies from either of these plane-wave cutoff energies was found to be smaller than the -point sampling errorSupp . First-order () Methfessel and Paxton smearingMethfesselPaxton of the Fermi surface was used throughout with smearing width, , set to 0.3 eV for the afmI calculations and 0.2 eV in all others. Structural relaxations were considered converged when the forces on all atoms were less than 0.03 eV/ for afmI calculations and less than 0.01 eV/ for other magnetic states. Test calculations showed that the differences in force convergence criteria do not lead to any significant systematic errorSupp . The choice of , however, leads to a systematic effect comparable in size to the convergence error with respect to the number of -pointsSupp . This is still, however, smaller than the uncertainty arising from choice of reference state and is therefore sufficiently small for our purposes. Formation energy calculations in the afmI state have been performed at the equilibrium lattice parameters determined with those settings i.e. and and not with those presented in Table 1. The resulting differences in formation energy are, however, negligible.
Throughout this paper we define the formation energy, , of a configuration containing atoms for each element, X, relative to a set of reference states for each element using
| (1) |
where is the calculated energy of the configuration and is the reference state energy for element, X. Here we take the reference energies to be the energies per atom for the pure materials i.e. Ni in its fcc fm ground state, Cr in its bcc anti-ferromagnetic (afm) state and Fe in the specific ground state for the magnetic ordering we are studying.
We define the binding energy between a set of species, , where a species can be a defect, solute, cluster of defects and solutes etc., as
| (2) |
where is the formation energy of a configuration containing the single species, , and is the formation energy of a configuration containing all of the species. An energetically favoured configuration therefore has a positive binding energy.
III Bulk properties and reference states
Density functional theory has a number of energy minima corresponding to different magnetic states with crystal structures close enough to fcc to be plausible as reference states for austenite. We take fcc to mean that the unit cell has , in contrast with fct where the unit cell relaxed tetragonally i.e. . Our calculated energy versus volume curves for many of these collinear magnetic structures are shown in Fig. 1.
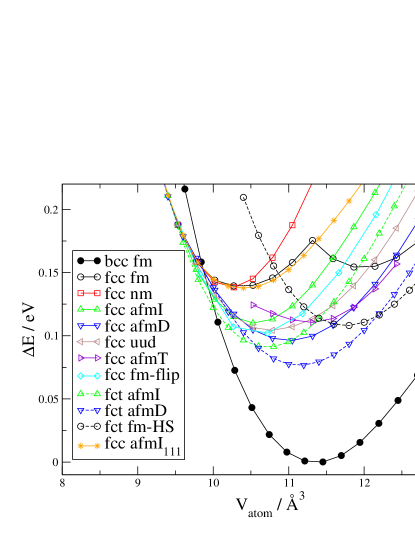
The results are consistent with, and extend, previous workGammaFeHerper ; GammaFeSpisak ; GammaFeDomain ; GammaFeJiang ; GammaFeKorling ; GammaFeMarsman . In a similar manner to these previous studies we have concentrated on (001) magnetic layered structures, which exhibit a common in-plane ferromagnetism but distinct spin orderings between planes. We have, however, considered other planar structures, such as the afmI111 state, which is ferromagnetic within (111) planes but antiferromagnetically ordered between planes, and non-planar structures, such as the fm-flip state. While we cannot be certain we have found the lowest energy structure within our finite dataset (as discussed earlier), our results do show the (001) magnetic layered structures to be generally more stable.
Overall our results show that there are many competing magnetic structures very close in energy. Indeed, the energy difference between the non-magnetic state and the most stable magnetic state is only 0.062 eV/atom. Test calculations in both the fcc afmI and fcc afmD structures showed that a single flipped magnetic moment was (meta)stable and cost 0.03 and 0.05 eV, respectively, in a 256 atom cell, again indicating how close different magnetic structures are in energy. Moment flips in the fcc fm-HS state proved costly at 0.5 eV and destabilised the fcc fm-LS state with partial relaxation towards one of the afm states. No (meta)stable moment flips were found for any of the fct structures.
It is worth drawing the reader’s attention to the fact that the afmI, afmD and fm-HS magnetic states in cubic cells have been found to be unstable with respect to tetragonal distortion. Both afmI and afmD transform spontaneously when the constraint is removed but the fcc fm-HS state is an unstable equilibrium position. Tetragonal distortion away from the perfect fcc structure either resulted in full relaxation to the ferromagnetic bcc ground state via the Bain pathBain , i.e. by setting , or to the fct fm-HS state with . For atomic volumes below about this unstable equilibrium position continuously becomes a stable equilibrium position for the fcc fm-LS state. Overall the fct parameter space exhibits many local ferromagnetic minima, the most stable being the bcc fm ground state (for ), a result most succinctly presented in the contour plots of Spišák and HafnerGammaFeSpisak .
The elastic moduli, , of the lowest energy structures representative of the distinct magnetic states considered here are presented along with the lattice parameters, magnetic moments and energy differences with respect to the lowest energy fct afmD state in Table 1. These elastic moduli correspond to the derivatives of the stress tensor with respect to strains and are only equal to the conventional elastic moduli, , which are proportional to the second derivative of the energy with respect to strain, in the case of a state of zero stressWallace . So for the fcc afmD state, which is not in equilibrium, the differ from the . For all others they are identical. In the case of zero stress the stability of the state with respect to tensile and shear strains can be examined by calculating the eigenvalues of the elastic constant matrix. Only if these eigenvalues are positive is the state an energy minimum with respect to strain. For an fct structure the eigenvalues, , are,
as well as , which is doubly degenerate and . The first three are given in Table 1.
| Structure | fcc afmD | fct afmD | fct afmI | fct fm-HS |
|---|---|---|---|---|
| / | 3.527 | 3.447 | 3.423 | 3.418 |
| / | 3.527 | 3.750 | 3.658 | 4.017 |
| 1.000 | 1.088 | 1.069 | 1.175 | |
| /eV | 0.020 | 0.000 | 0.014 | 0.031 |
| / | 1.80 | 1.99 | 1.50 | 2.40 |
| /GPa | 224 | 212 | 333 | 131 |
| /GPa | 147 | 211 | 241 | 267 |
| /GPa | 81 | 92 | 103 | 106 |
| /GPa | 90 | 92 | 103 | 106 |
| /GPa | 119 | 210 | 250 | 289 |
| /GPa | 87 | 73 | 173 | 56 |
| /GPa | 108 | 203 | 251 | 165 |
| /GPa | - | 1 | 92 | -136 |
| /GPa | - | 485 | 630 | 503 |
| /GPa | - | 148 | 194 | 184 |
The stability criterion for , i.e. , is not satisfied by the fct fm-HS state, showing that it is unstable with respect to an orthorhombic distortion breaking the symmetry in the lattice parameters. Despite being unstable it is still an equilibrium structure i.e. a saddle point in the energy landscape, which after a small orthorhombic symmetry-breaking perturbation relaxes directly to the bcc fm ground state. Note that although this barrier-free double shear route from fcc to bcc (via fct) is not the generally-considered Bain path, the relationship between the initial and final states is identical. One final point worth mentioning here is that the lattice parameter, for the fct fm-HS state is almost exactly times the bcc fm lattice parameter, which is 2.831 with the settings used here. In the Bain transformation from fcc to bcc two of the lattice parameters must increase to exactly this value. The conclusion is that if we only allow one lattice parameter to increase, i.e. by constraining to an fct cell with , the system will still relax that lattice parameter all the way towards bcc and not to an intermediate value.
The fct afmD state is stable, but is very soft with respect to a further orthorhombic distortion i.e. upon applying the eigen-strain associated with . By applying such a strain we confirmed the existence of a wide minimum about zero strain with direct measurements of yielding values between 5 and 10 GPa. This direct determination is still small but larger than the indirect measurement.
As well as considerations of structural stability any prospective reference state suitable for our purposes should be stable with respect to the introduction of simple point defects and solutes. The fcc fm-LS state, being unstable even to the introduction of a vacancy, is ruled out, as is the fcc afmI state which was found to disorder in some calculations. The fcc fm-HS state was unsurprisingly found to be unstable to defects breaking the fcc crystal symmetry. Using the fct fm-HS state, as will be shown, improved the situation, although it was still unstable to defects generating orthorhombic distortions. All other structures were found to be stable with respect to the introduction of defects.
The final consideration in our choice of reference states is the usefulness of our results as a solid foundation for understanding the complex results in concentrated Fe-Cr-Ni austenitic alloys. The afmI magnetic ordering has been found to be the only stable state for a concentrated austenitic alloy with composition Fe70Cr20Ni10KlaverConc . In addition there is evidence for the stability of a ferromagnetic state at other concentrationsAbrikosov ; Majumdar , indicating that the ferromagnetic state may be stabilised by alloying.
Given the considerations discussed above, we have concentrated on four main reference states for austenitic Fe and dilute Cr and Ni alloys in this work. These are as follows:
-
i/
The fct afmI state. It exhibits stability both in structure and against the introduction of defects and is of direct relevance in the study of concentrated alloys.
-
ii/
The fct afmD state. It shows reasonable structural stability, stability against the introduction of point defects and is the structure with the lowest energy of all collinear magnetic structures found in this work and elsewhere.
-
iii/
The fct fm-HS state. Despite its instabilities it best represents the ferromagnetic state and insights gleaned from its study have relevance for concentrated alloy systems. It also has the closest volume per atom to the paramagnetic state.
-
iv/
The fcc afmD state: It is stable against the introduction of point defects and is the lowest energy fcc state. Comparison with the fct afmD state allows the effect of tetragonal distortion on formation and binding energies to be studied.
It is worth reiterating that none of these structures can, by themselves, represent high temperature austenite or concentrated austenitic alloys. All the results in this paper must be accepted as approximations and only when a feature is common against multiple reference states are we confident that it is generalisable.
Before discussing our point defect and solute calculations in these reference states we comment on the effect of non-collinear magnetism, which is known to be present in fcc FeGammaFeKorling ; GammaFeMarsman . We calculated seven systems while allowing non-collinear solutions. The systems were a vacancy, dumbbell and an octahedral interstitial in pure Fe, single Cr and Ni solutes, a mixed Cr-Ni dumbbell interstitial and a Ni solute next to a vacancy. The initial moments were set in an afmI configuration, with most of the initial moments aligned collinearly. The directions of moments on a sufficient number of atoms were changed, however, to perturb the system away from the collinear solution. All moments were free to rotate into non-collinear directions in the calculations.
Six of these seven calculations converged to collinear solutions. Only in the case of a Ni solute situated next to a vacancy were clearly non-parallel directions of moments on atoms observed. Even then, the energy of the non-collinear solution was only marginally lower than for the collinear solution and by an amount below other sources of error. Therefore, while non-collinearity was observed, it can be omitted for our purposes.
IV Point defects in pure Fe
The basic quantities upon which all microstructural radiation-induced damage and segregation effects depend are the energies associated with point defect formation, interaction and diffusion i.e. the behaviour of the primary damage in radiation-induced displacement cascades. We calculate point defect formation and binding energies in pure -Fe based on our four different magnetic reference states for austenite. It should be borne in mind that the particular magnetic ordering and the presence of tetragonal distortion in these states lowers their symmetry relative to the perfect fcc crystal structure. As a result, some defects which would have been uniquely defined in fcc have multiple configurations with different energies. We refer to these differences as symmetry-breaking effects and they should primarily be taken as an additional source of uncertainty in our calculations when conclusions about austenite and austenitic alloys are made. In order to aid the discussion of our results we will refer to the planes of constant moment in the bulk afm structures and the planes perpendicular to the direction of tetragonal distortion in the fct fm-HS state by the term, “magnetic planes”. The results of our point defect calculations are shown in Table 2.
| Defect | fcc afmD | fct afmD | fct afmI | fct fm-HS |
|---|---|---|---|---|
| Vacancy | 1.672 | 1.819 | 1.953 | 1.692 |
| -6.67 | -2.50 | -2.74 | 1.50 | |
| Octa (1) | rlx (7) | rlx (7) | 4.353 | 3.620 |
| -4.92 | -0.71 | |||
| Tetra uu (2) | 3.581 | 3.864 | N/A | 3.039 |
| -6.04 | -2.82 | -4.91 | ||
| Tetra ud (3) | 3.332 | 3.663 | 4.322 | N/A |
| 0.00 | 0.00 | 0.06 | ||
| crowdion (4) | rlx (3) | rlx (3) | 4.799 | 3.305 |
| -5.51 | -3.10 | |||
| crowdion uu (5) | 3.771 | 4.255 | N/A | (-1.791) |
| -3.53 | -3.73 | -2.58 | ||
| crowdion ud (6) | 3.874 | 4.168 | 4.818 | N/A |
| 0.00 | 0.00 | 0.00 | ||
| dumbbell (7) | 2.978 | 3.316 | 3.531 | (-3.181) |
| -7.79 | -4.66 | -2.96 | -1.40 | |
| dumbbell (8) | 2.790 | 3.195 | 3.615 | 2.416 |
| -9.39 | -0.17 | 4.49 | -6.27 | |
| dumbbell (8b) | N/A | N/A | N/A | (-2.529) |
| -5.29 | ||||
| dumbbell (9) | 4.290 | 4.322 | 4.803 | 3.288 |
| -4.86 | -4.23 | -5.81 | -3.12 | |
| dumbbell (10) | rlx (7) | rlx (7) | rlx (7) | rlx (8b) |
| dumbbell (11) | rlx (3) | rlx (3) | 4.559 | 1.919 |
| -2.13 | 0.70 |
Problems with the fct fm-HS state are immediately apparent, i.e. negative interstitial formation energies. These are associated with extensive reconstruction throughout the unit cell. All defects exhibit significantly lower formation energies than the other reference states. Formation energies in the fcc afmD state are systematically lower than those in fct afmD by around 10%. The total configuration energies in fcc are, however, still significantly higher than the fct state. We associate the formation energy reductions in the fct fm-HS and fcc afmD states with the fact that these states are not minima with respect to strain. By contrast, the fct afmI and afmD states are minima and the influence of the defects is confined to the first few neighbour shells. The associated energies can therefore be regarded as attributable to the defect. We thus base our predictions for paramagnetic austenite on these two reference states, with their difference giving some indication of the error.
IV.1 Vacancy formation
We find that the vacancy formation energy lies in a range between 1.82 and 1.95 eV. This is slightly higher than the typical value of one third of the cohesive energy observed in other transition metalsKorhonen ; Ehrhart ; Wollenberger . The local influence of the vacancy on the lattice was found to be highly dependent on the reference state. Displacements of up to 0.24 towards the vacancy were found for atoms in the first nearest neighbour (1nn) shell in the fct fm-HS state whereas no displacements exceeded 0.02 in the fct afmI state. An intermediate value of 0.09 was found in the fct afmD state. The displacements for the fct afm states compare well with a value of 0.08 calculated with similar settings for fm bcc Fe. Those for the fct fm-HS, however, appear excessive and may well be attributable to the instability of this reference state, as discussed earlier.
Magnetic moments were typically enhanced in the 1nn shell, the effect being strongest within a magnetic plane. Increases of 0.2 were found for the fct afmD and fm-HS states and up to 0.35 in the afmI state. At 2nn, moments within a magnetic plane were consistently found to be reduced in magnitude but by less than the enhancement seen in the 1nn shell. The overall enhancement of moments suggests that there may be a significant magnetic contribution to the entropy of formation for the vacancy in paramagnetic austenite.
IV.2 Interstitial formation
All reference states give the dumbbell as the stable self-interstitial configuration. The fct afm states suggest a formation energy of between 3.2 and 3.6 eV, large enough to preclude the formation of thermal interstitials or Frenkel pairs. Therefore, these defects are only of importance in irradiated samples. The symmetry-breaking effect between the [001] and [100] dumbbells is approximately 0.1 eV i.e. around 3% of the formation energy. Experimental evidence in the fcc metals aluminium and copper indicates the dumbbell as the most stable self-interstitial defectErhart . Other measurementsWollenberger ; Schilling ; Young are consistent with this conclusion and also suggest the same to be true of fcc Ni. In summary all experimental evidence suggests that the dumbbell is the most stable self-interstitial in fcc metals, with theory in strong agreementabInitioPerfect ; EAM ; ATVF ; deVita ; Tucker here.
Magnetic moments on the dumbbell atoms were severely reduced or even flipped relative to the magnetic plane containing the dumbbell in all reference states. Moment flips were observed for the [001] dumbbell in the fm-HS state and for the [100] dumbbell in the afmI state. In all other cases the moments were reduced to values in the range from 0.1 to 0.5 . The influence of the dumbbell on the local lattice naturally splits the 1nn shell into tensile sites, lying within the plane perpendicular to the dumbbell axis, and compressive sites lying above and below that plane. The effect on the compressive sites is by far the most pronounced, exhibiting displacements of between 0.2 and 0.3 consistently for all reference states. Magnetic moments on these atoms were consistently reduced in magnitude by at least 0.33 with a greatest reduction of 0.92 observed in the afmI state for a [001] dumbbell. Atoms in the tensile sites at 1nn relaxed towards the dumbbell centre by between 0.06 and 0.13 and exhibited enhanced moments of 0.10 in the fm-HS state and between 0.21 and 0.44 in the afm states.
IV.3 Vacancy migration
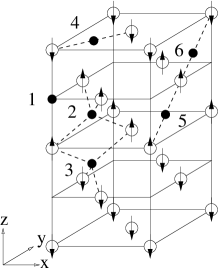
We present estimates of formation energies for the transition states involved in vacancy migration and the respective barrier heights above the energy of an isolated vacancy in Table 3.
| Path | fcc afmD | fct afmD | fct afmI | fct fm-HS | ||||
|---|---|---|---|---|---|---|---|---|
| 1a | 2.717 | 1.046 | 2.563 | 0.743 | 2.575 | 0.622 | 1.826 | 0.133 |
| 1b | 2.384 | 0.712 | 2.867 | 1.048 | N/A | (-3.935 | -5.627) | |
| 1c | 2.940 | 1.268 | 3.401 | 1.581 | 3.677 | 1.724 | N/A | |
The transition states used were those naturally suggested by symmetry with the migrating atom placed half way between the two lattice sites involved. Nudged elastic band (NEB) method calculations confirm this to be the correct choice for migration within the magnetic planes of the afmD state.
The results for the fct fm-HS state show clear signs of instability and are included here only to illustrate this point. The broken symmetry of the afm states means that there are several non-equivalent barriers. For path 1c the initial and final moments on the migrating atom are opposite in sign. The constraint of collinear magnetism means the moment must therefore either be zero at some point along the path, which is very likely to be the transition state in that case given the high energy cost of suppressing the moment in Fe, or discontinuously flip sign at some point. In our calculations a stable moment of zero was ensured by symmetry in the transition state, resulting in relatively large energy barriers. However, there is no reason to constrain the moment to be continuous along the migration path and the inclusion of discontinuous flips would very likely lower the barrier height and the values in Table 3 should therefore be taken as upper limits.
Along paths 1a and 1b the initial and final moments for the migrating atom have the same sign and so no moment flips are required. In the afmI state, however, the most stable moment for the migrating atom was found to have opposite sign to the initial and final points. A stable solution was found with the same sign of moment but this was found to be around 0.4 eV higher in energy. Despite this complication, our estimate of the barrier height still stands if we allow discontinuous moment flips along the migration path. Our data show that moment flips have an energy cost of around 0.05 eV and would therefore have no effect on barrier height. We therefore estimate the relevant barriers for vacancy migration in austenite to be in the range from 0.6 to 1.05 eV. Combined with the formation energy, this gives good agreement with the experimental activation energy for self-diffusion in austenite which is eVvacFediff .
One final point worth mentioning is that the moments on the migrating atoms in the transition state were consistently enhanced relative to bulk to between 2.51 and 2.68 , unless constrained to be zero. These increases exceed those found for atoms 1nn to a vacancy defect, as would be expected given the larger volume the migrating atoms occupy.
IV.4 Point defect interactions and clustering
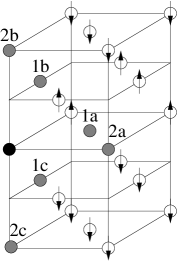
The fate of an irradiated material is initially dependent on the interactions between point defects. Calculations of such quantities are given in Tables 4 and 5. Again, the low symmetry of the reference states necessitates calculation of many configurations, however a clear picture emerges from this, that vacancies bind to form divacancies with an energy of order 0.1 eV (or in afmD up to 0.2 eV). This rather weak binding suggests that at elevated temperature, divacancies will not be thermodynamically stable and nucleation of voids will face a nucleation barrier. By contrast, interstitials bind strongly into pairs, with binding energies of around 1 eV for parallel [001] dumbbells on adjacent sites, just as was observed in similar calculations in fcc NiDomainNi where a binding of 0.97 eV was found. Such structures can form the nucleus of dislocation loops.
These geometric conclusions can be taken as robust, given the good agreement between the two magnetic structures. The elastic strain fields are still small ( eV) for divacancies, however, for di-interstitials the Eshelby correction lies between -0.2 and -0.3 eV. The effect on binding energies is smaller due to a partial cancellation of correction terms but is still significant, resulting in between 0.1 and 0.15 eV increases. However, the stable geometry is determined by the differences between binding energies, and these converge much more rapidly.
| Cfg. | fcc afmD | fct afmD | fct afmI | fct fm-HS | ||||
|---|---|---|---|---|---|---|---|---|
| 1a | 3.139 | 0.205 | 3.602 | 0.037 | 3.843 | 0.063 | 3.558 | -0.173 |
| 1b | 3.288 | 0.056 | 3.512 | 0.127 | N/A | (-2.586 | 5.970) | |
| 1c | 3.269 | 0.075 | 3.463 | 0.175 | 3.860 | 0.046 | N/A | |
| 2a | 3.322 | 0.022 | 3.702 | -0.064 | 3.883 | 0.023 | (-2.600 | 5.984) |
| 2b | 3.423 | -0.079 | 3.657 | -0.018 | 3.996 | -0.090 | 3.348 | 0.036 |
| A-B/Config. | fct afmD | fct afmI | ||
|---|---|---|---|---|
| -/1a | 5.541 | 0.850 | 6.423 | 0.807 |
| -/1b | 6.584 | -0.194 | N/A | |
| -/1c | 6.339 | 0.052 | 7.301 | -0.071 |
| -/2a | 6.556 | -0.165 | 7.789 | -0.559 |
| -/2b | 6.398 | -0.007 | 7.344 | -0.114 |
| -/1a | 5.942 | 0.569 | 6.655 | 0.491 |
| -/1b | 5.629 | 0.882 | N/A | |
| -/1b | unstable | N/A | ||
| -/1c | 5.867 | 0.644 | 6.570 | 0.576 |
| -/1c | unstable | unstable | ||
| -/2a | 6.284 | 0.227 | 6.987 | 0.159 |
| -/2a | 6.084 | 0.428 | 6.711 | 0.435 |
| -/2b | 6.101 | 0.410 | 7.017 | 0.129 |
| -/2c | 6.339 | 0.172 | N/A | |
| -/1a | 6.417 | 0.214 | 7.085 | -0.023 |
| -/1a | unstable | unstable | ||
| -/1b | 5.928 | 0.703 | N/A | |
| -/1b | 6.506 | 0.125 | N/A | |
| -/1b | 6.120 | 0.511 | N/A | |
| -/1c | 5.540 | 1.091 | 6.539 | 0.523 |
| -/1c | 6.451 | 0.181 | 7.161 | 0.099 |
| -/1c | 5.988 | 0.643 | 6.618 | 0.444 |
| -/2a | unstable | unstable | ||
| -/2a | 6.760 | -0.129 | 7.667 | -0.605 |
| -/2a | 6.238 | 0.393 | 6.913 | 0.149 |
| -/2b | 6.572 | 0.059 | 7.548 | -0.486 |
| -/2b | 6.383 | 0.248 | 6.846 | 0.216 |
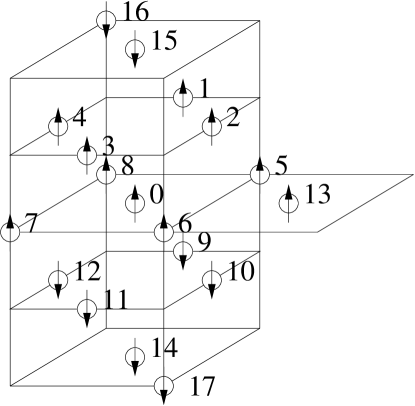
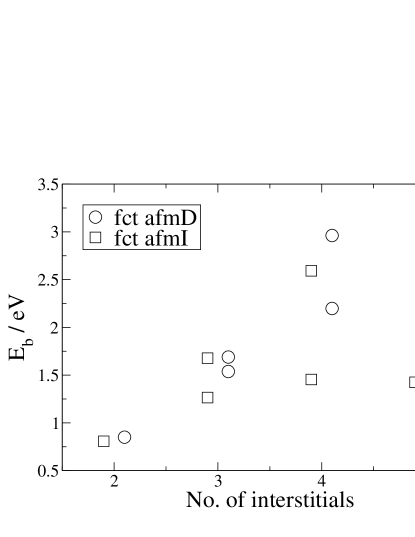
To investigate void formation and dislocation loop nucleation further we have performed a set of small defect cluster calculations. Our choice of vacancy cluster configurations was motivated by the observation that the strongest vacancy-vacancy binding energies are at 1nn separation (Table 4) and covers most of the small, stable vacancy clusters found in other fcc metals using empirical potential and ab initio methodsDamask ; Vineyard ; Shimomura ; WangPot ; WangAlPotDFT . Our results for clusters containing up to 6 vacancies are given in Table 6 and presented graphically along with results for divacancies in Fig. 4(a). For dislocation loop nucleation we consider clusters of up to 5 [001] dumbbells (axis perpendicular to magnetic planes) lying within a single magnetic plane, as motivated by the strong 1nn binding seen for both afmI and afmD. The results are presented in Table 7 and shown along with the pair binding results in Fig. 4(b).
| Config. | fct afmD | fct afmI | ||
|---|---|---|---|---|
| (0,5,6) | 5.388 | 0.069 | 5.711 | 0.148 |
| (0,9,11) | 5.094 | 0.363 | 5.746 | 0.113 |
| (0,1,3) | 5.179 | 0.279 | N/A | |
| (0,1,9) | 5.134 | 0.324 | 5.800 | 0.059 |
| (0,5,7) | 5.348 | 0.110 | 5.694 | 0.165 |
| (0,1,11) | 5.112 | 0.346 | 5.747 | 0.112 |
| (0,5,11) | 5.264 | 0.194 | 5.761 | 0.098 |
| (0,3,5) | 5.307 | 0.151 | N/A | |
| (0,1,10) | 5.128 | 0.329 | 5.761 | 0.098 |
| (0,5,1) | unstable | N/A | ||
| (0,5,9) | unstable | 5.507 | 0.352 | |
| (0,5,9,10) + Fe sym | 5.662 | -0.204 | 6.072 | -0.213 |
| (0,5,9,10) + Fe asym | 4.883 | 0.575 | 5.283 | 0.576 |
| (0,1,2,5) + Fe | 4.815 | 0.642 | N/A | |
| (0,5,9,10) | 6.576 | 0.701 | 7.110 | 0.702 |
| (0,1,2,5) | 6.501 | 0.776 | N/A | |
| (0,5,6,13) | 6.994 | 0.282 | 7.406 | 0.406 |
| (0,9,11,14) | 6.499 | 0.777 | 7.496 | 0.316 |
| (0,5,6,10,13) | 7.866 | 1.230 | 8.337 | 1.428 |
| (0,2,5,6,13) | 8.220 | 0.876 | N/A | |
| (2,5,6,10,13) | 7.507 | 1.589 | 8.312 | 1.451 |
| (0,2,5,6,10,13)+ Fe | 7.404 | 1.692 | 8.183 | 1.582 |
| (0,2,5,6,10,13) | 8.402 | 2.513 | 9.200 | 2.518 |
| (0,1,4,5,7,16) PD | unstable | 10.532 | 1.184 | |
| (0,1,4,5,7,16) SFT | 8.573 | 2.342 | 9.366 | 2.350 |
| (0,5,7,10,11,17) SFT | 8.751 | 2.164 | N/A | |
| Config. | fct afmD | fct afmI | ||
| (0,5,6) | 8.048 | 1.538 | 9.580 | 1.265 |
| (0,5,7) | 7.897 | 1.689 | 9.168 | 1.677 |
| (0,5,6,7) | 10.583 | 2.198 | 13.006 | 1.454 |
| (0,5,6,13) | 9.820 | 2.962 | 11.867 | 2.593 |
| (5,6,7,8) | 13.055 | -0.274 | 15.628 | -1.168 |
| (0,5,6,7,8) | 13.061 | 2.916 | 16.651 | 1.424 |
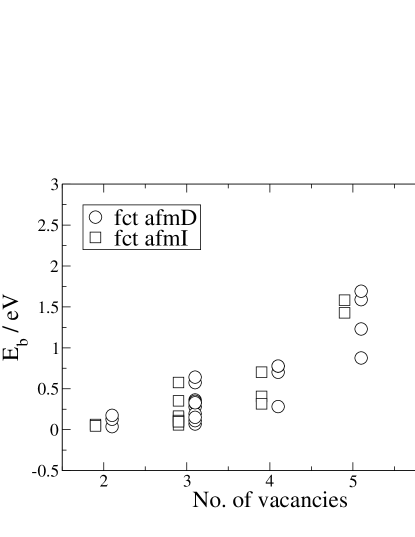
The first feature which is notable is that both vacancy and interstitial defects have a strong tendency to bind into clusters. As shown in Fig. 4, the total binding energy increases steadily with the addition of defects. This is especially pronounced for the vacancy cluster data where, despite the large spread of values for a fixed number of vacancies, there appears to be a super-linear increase in the total binding energy. This implies that, on average, the binding of an additional vacancy to an already existing cluster is increasing with cluster size. The additional binding should eventually tend to the formation energy for a vacancy in bulk although it appears from the data we are not at this limit yet.
The most strongly bound tri-vacancy cluster is formed by the removal of a tetrahedron of atoms, with an additional atom replaced near the centre. There is a strong agreement between the afmI and afmD states here with a total binding energy of 0.58 eV and a magnetic moment on the central atom of . Our calculations also show that if the central Fe atom is positioned symmetrically, with zero moment, the energy is almost 0.8 eV higher, indicating the high cost of suppressing the Fe moment. Such a large value for the moment is consistent with earlier observations that the local moment increases along with the local volume occupied by an atom (unless constrained to zero by symmetry), converging asymptotically to the moment on the free atom. Calculations in bcc Fe are in strong agreement with this findingbccmag .
Significant differences between the reference states were observed for the binding energies of the less well bound tri-vacancy clusters. A particular case worthy of mention is configuration (see Table 6 and Fig. 3), which is stable in the afmI state but found to be unstable for afmD, where it relaxes to one of the tetrahedral arrangements. Despite this, however, the next most strongly bound tri-vacancy cluster in both cases has a binding energy of approximately 0.35 eV, clearly indicating the additional stability of the tetrahedral arrangement. It is well established that stacking fault tetrahedra (SFT) are stable vacancy configurations in fcc and this cluster could be regarded as the smallest possible such object.
Another vacancy can be absorbed to form a tetrahedron, with an additional binding of approximately 0.1 eV but this is significantly lower than the binding energy per defect of the most stable tri-vacancy so this may prove a bottleneck against forming three-dimensional voids.
There is, however, a rapid increase in the stability of vacancy clusters above this point. The addition of a fifth vacancy increases the binding energy by around 0.7 eV on average. The most stable five-vacancy configuration considered here is formed by adding a single Fe atom to the centre of an octahedral vacancy cluster. The local arrangement of first neighbours to this central atom is bcc-like. There is a significant relaxation of these first neighbours towards the central atom but the effective bcc lattice parameter is still greater than that for bcc Fe at equilibrium and significant tetragonal distortion remains. The moment on the central atom was found to align with its neighbours in the afmI state i.e. locally ferromagnetic with moments between 2.3 and 2.4 . In afmD similarly enhanced moments relative to the bulk were found but the afmD magnetic order remained the stable arrangement.
The jump to six-vacancy clusters is again associated with a large increase in total binding energy. Of particular interest is the extremely stable octahedral arrangement of six vacancies with a total binding energy of 2.5 eV in both the afmI and afmD states, which is 0.8 eV higher than the binding energy of any five-vacancy cluster. The six-vacancy SFT configurations show similarly high binding energies. These configurations are the next size of SFT up from the elementary example discussed earlier and can be formed by removing six atoms in a 1nn triangular arrangement from a (111) plane in fcc with a subsequent and significant relaxation of the four atoms forming a tetrahedron directly above this plane downward to fill the void. This type of defect represents an alternative to the formation of three-dimensional voids, best represented in our calculations by the octahedral cluster. We cannot clearly distinguish between these two on energetic grounds. One interesting aside here is that we found the six-vacancy (111) planar defect to be metastable in the afmI state whereas this arrangement relaxed to the SFT in afmD. This mirrors what was found for the three-vacancy (111) planar (0,5,9) cluster. In both of these cases, however, the SFT was found to be significantly more stable.
The Eshelby corrections to the formation energy of most of our vacancy cluster calculations are only a few hundredths of eV, with some notable exceptions. Corrections for five-vacancy clusters are at most -0.13 eV, for the octahedral cluster the correction is -0.06 eV and for the SFT the correction is -0.2 eV. These corrections do not affect our conclusions in any significant way.
For interstitial clusters we also find a strong tendency to bind and align in parallel to form (001) proto-loops (c.f. Fig. 4(b)), again in agreement with ab initio results in fcc NiDomainNi where a tri-interstitial binding energy of 1.71 eV was observed. The picture is complicated by repulsion between 2nn dumbbells, which is particularly strong for the fct afmI state. The most strongly bound planar clusters are therefore those which maximise the ratio of 1nn to 2nn bonds. The precise energetics and geometry of these results should be treated with care, since our results sample a few of the very large number of possible configurations. Furthermore, the Eshelby correction to the binding energy was found to be around -1 eV for the largest cluster (as confirmed by a direct constant pressure, , calculation), a value that is comparable with the binding itself. Even so, this correction can only increase the binding energy, enhancing the driving force for clustering.
IV.5 Pair bond models for defect clusters
We have attempted to model the binding energy of pairs of defects and defect clusters with a linear pairwise bonding model up to second-nearest neighbours,
| (3) |
where and are the total number of 1nn and 2nn bonds, respectively, between defects in the cluster and and are the corresponding fit parameters. This model does not distinguish between the distinct neighbour bonds resulting from the symmetry-breaking effects of the magnetic states and tetragonal distortion and fits using this model therefore provide an effective averaging over distinct bonds. Including these symmetry-breaking effects was found to significantly improve the agreement between model and data but at the expense of considerably more parameters.
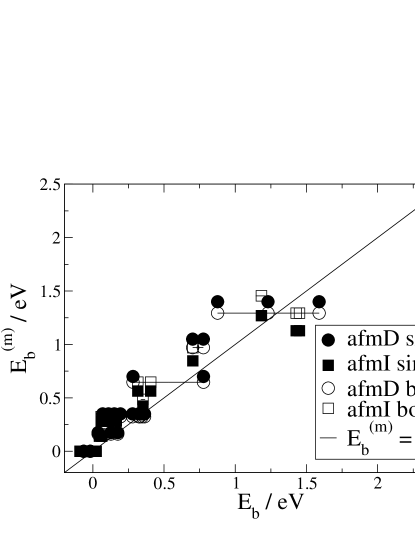
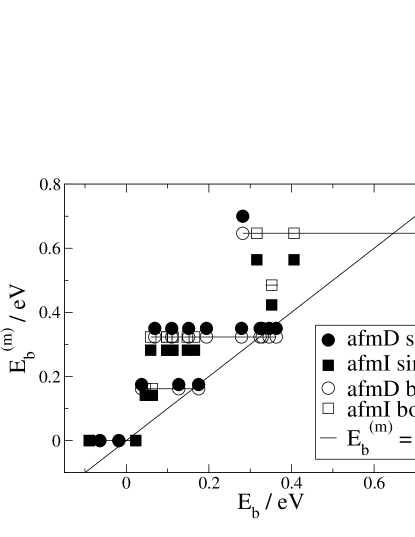
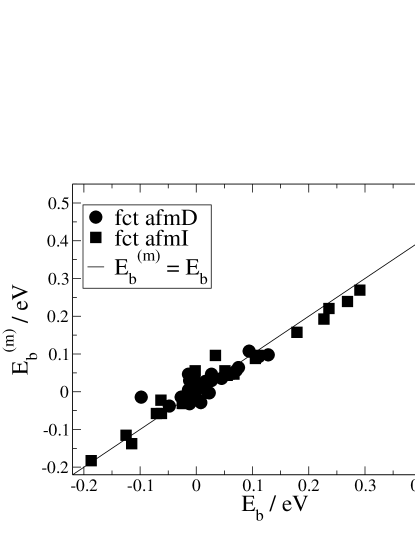
The nature of the model also means that it is only directly applicable to clusters where the individual defects can be assigned to single lattice sites. This is not the case for the tetrahedral and octahedral voids with a single Fe atom at the centre and for the six-vacancy SFT and these configurations have not been included in the modelling. Fits were performed both to the afmI and afmD data sets individually and to their combined data, averaging over the two sets in the process. For vacancy clusters the inclusion of 2nn bonds in the model made little difference to the results and have therefore been omitted (effectively setting ). The resulting fit parameters are given in Table 8 and the corresponding model values are compared with the data in Fig. 5.
| Parameter | afmD | afmI | both |
| Vacancy cluster results | |||
| /eV | 0.175 | 0.141 | 0.162 |
| Self-interstitial dumbbell cluster results | |||
| /eV | 0.841 | 0.829 | 0.841 |
| /eV | -0.142 | -0.441 | -0.275 |
The fit parameters for these models have the units of energy and can be thought of as effective or averaged binding energies for pairs of defects. Comparison with the pair binding energies shows that this is generally true, particularly for interstitials. The afmI vacancy cluster parameter, eV, does, however, overestimate the pair binding but should be thought of as an effective value which best represents the interactions in all clusters included in the fit.
From Figs. 5(a) and 5(b) it is clear that there is a significant horizontal spread in the vacancy cluster ab initio data for a fixed number of bonds and therefore model value, just as there was for a fixed number of vacancies in Fig. 4(a). This is a direct result of symmetry-breaking effects in the reference states, which the model does not incorporate and effectively averages over. There is, however, a broadly linear trend in the data that the model is able to capture. This is even true of the combined fit to both data sets where the model values lie generally within the error bars resulting from averaging over distinct bonds and magnetic states. It is worth mentioning that for some of the data points the model values for the combined fit were not significantly different from the single fits and these points in the plots are obscured as a result. Despite the general agreement of the models they do tend to overestimate the average binding of smaller clusters and underestimate the binding of the largest (octahedral) cluster. This is certainly attributable to the exceedingly strong binding of the octahedral configuration which may well define a limit on the applicability of this model since still larger clusters are likely to be even more strongly bound.
The agreement between models and data for interstitial clusters (shown in Fig. 5(c)) is significantly better than for vacancies. This is partly due to our consideration of only planar clusters but also demonstrates the existence of clear trends in the data. The primary difference between the two magnetic states is the significantly larger repulsion between dumbbells at 2nn separation for the afmI state. Data for clusters where 2nn interactions are significant therefore shows significant spread. Model values for the combined fit offer an effective averaging over these differences and provide our best guess for a predictive model of planar defects in austenite.
IV.6 Comparison with bcc fm Fe
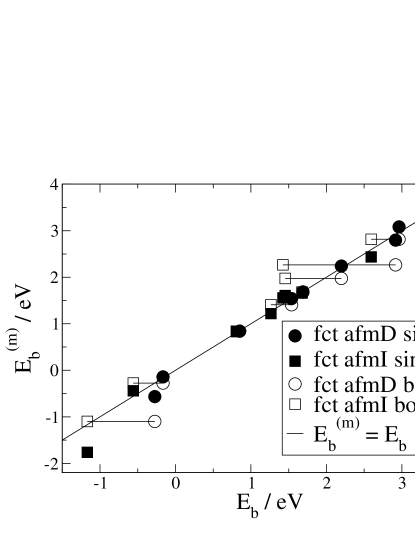
As a final means to summarise our findings in pure Fe we make a direct comparison of our data for the afm states of austenitic Fe to the ferritic (bcc fm) ground state, as shown in Fig. 6.

We have included data for the formation of single vacancy and interstitial defectsFeCrOlssonC , the divacancy binding energy and the binding of the most stable (dumbbell) interstitial defect into planar clustersTerentyev . Each quantity plotted is uniquely defined in the bcc fm state with the vertical spread in fcc values coming from the symmetry-breaking effects in the magnetic states considered here.
The data clearly shows a high level of similarity between the bcc and fcc results at the energy resolution of the plot. Each quantity occupies a clearly defined energy range for the corresponding process e.g. divacancy binding from 0.0 to 0.2 eV and di-interstitial binding from 0.8 to 0.9 eV. It also demonstrates the generally good level of agreement between the afmI and afmD states. One noticeable difference is the generally lower formation energies for point defects in austenite, particularly for afmD. Despite this, the binding energies show a generally good agreement. Overall, this raises the question of whether such a crystal structure independence exists generally in metals or is particular to Fe.
V Dilute Ni,Cr results
Commercial austenitic stainless steels typically contain Cr and Ni as major alloying elements. As a first step we have examined the behaviour of these atoms in the dilute limit. Our results for single substitutional solutes are given for the four reference states considered here in Table 9.
| Config. | fcc afmD | fct afmD | fct afmI | fct fm-HS | ||||
|---|---|---|---|---|---|---|---|---|
| Sub. Ni | -0.033 | -0.08 | 0.084 | 0.04 | 0.167 | -0.29 | -0.053 | 0.70 |
| Sub. Cr | 0.106 | 0.53 | 0.268 | 0.85 | 0.047 | 1.07 | 0.036 | -2.17 |
The substitutional formation energy of both Ni and Cr in austenitic Fe is small but positive in the fct afm reference states indicating a weak tendency for phase segregation, but only at temperatures way below the stability limit of austenite. In the fm-HS state we find Ni to be soluble whereas Cr is not and while the energies involved are small this trend is opposite to that seen in similar calculations in bcc fm FeOlssonTMSol . The magnetic moments on the solute atoms exhibit the usual behaviour of Ni to be ferromagnetic to its neighbours and Cr to be anti-ferromagnetic. In the afmD state the Ni moment is heavily suppressed relative to its pure reference state value () whereas in afmI the moment is aligned with the majority of its 1nn Fe atoms although still reduced in magnitude. The moment on a single Cr atom in the afm states remains comparable to the reference state value () and even shows enhancement in the afmI state. Enhanced moments are also seen for both Ni and Cr solutes in the fm-HS state, exhibiting alignment and anti-alignment with Fe, respectively, just as was observed in bcc fm FeOlssonTMSol .
Bond lengths from single Ni and Cr solutes to their nearest-neighbour shells differ from pure Fe by at most 0.05 . This 1 to effect exists only for the 1nn shell and decays rapidly with distance. A study of the magnitude and directions of bond length changes is complicated by the symmetry-breaking effects in the reference states. We consider instead the changes in the lattice parameters of the unit cell surrounding a single substitutional solute, which naturally distinguishes between effects within and perpendicular to the magnetic planes. The build up of stresses on the supercells was found to be consistent with the changes in the lattice parameters. The influence of Ni and Cr solutes was found to be very similar within the afm reference states but showed differences in the fm-HS state. For the fct afm states both solutes increased the lattice parameter within a magnetic plane by 0.04 in afmD and 0.05 in afmI. The influence on the out-of-plane lattice parameter distinguished between afmD, which showed a contraction of 0.03 , and afmI, where an almost negligible increase was found for Ni and a small contraction for Cr of 0.016 . The only significant change in the fm-HS state was a contraction of 0.04 in the out-of-plane lattice parameter for Ni.
The influence of Ni and Cr solutes on the magnetic moments of surrounding Fe atoms is more pronounced. For the 1nn shell changes of 0.1 are typical but were found to be as high as 0.16 for Ni in the afmI state. No significant () moment changes were observed for the fm-HS state at higher orders. In the fct afmD state moments 2nn to Ni showed perturbations of up to 0.06 and were negligible above that. The influence of Cr was similar in magnitude at 2nn but persisted out to the 4nn shell. In the fct afmI state both Ni and Cr solutes exerted a more pronounced influence out to the 4nn shell than in other states. For Ni, moments on atoms at 2nn differed by up to 0.12 (i.e. ) from the pure Fe value and differences of up to 0.05 were observed at 4nn. For Cr, moment changes in the 4nn shell were the largest measured for that separation at 0.07 , exceeding those at 1nn separation, which were up to 0.05 .
Overall, we conclude that a significant contribution to the interactions of Ni and Cr solutes with defects and other solutes in austenitic Fe, especially at longer range, will come from their magnetic interactions. Volume-elastic contributions will be smaller and should be similar for Ni and Cr in the fct afmD and fct afmI states.
| Config. | fcc afmD | fct afmD | fct afmI | fct fm-HS | ||||
| A-B/cfg | ||||||||
| Ni-Ni/1a | -0.089 | 0.024 | 0.113 | 0.056 | 0.204 | 0.110 | -0.124 | 0.018 |
| Ni-Ni/1b | -0.061 | -0.004 | 0.141 | 0.027 | N/A | -0.126 | 0.020 | |
| Ni-Ni/1c | -0.022 | -0.043 | 0.182 | -0.014 | 0.280 | 0.034 | N/A | |
| Ni-Ni/2a | -0.101 | 0.036 | 0.151 | 0.018 | 0.267 | 0.067 | (-5.853 | 5.748) |
| Ni-Ni/2b | -0.020 | -0.045 | 0.182 | -0.014 | 0.257 | 0.058 | -0.086 | -0.020 |
| Cr-Cr/1a | 0.257 | -0.044 | 0.562 | -0.027 | 0.173 | -0.062 | 0.313 | -0.241 |
| Cr-Cr/1b | 0.218 | -0.005 | 0.547 | -0.012 | N/A | (-5.742 | 5.814) | |
| Cr-Cr/1c | 0.305 | -0.093 | 0.633 | -0.098 | 0.183 | -0.071 | N/A | |
| Cr-Cr/2a | 0.170 | 0.043 | 0.512 | 0.023 | 0.086 | 0.008 | 0.102 | -0.030 |
| Cr-Cr/2b | 0.214 | -0.001 | 0.546 | -0.011 | 0.121 | -0.010 | 0.077 | -0.005 |
| Ni-Cr/1a | 0.090 | -0.016 | 0.327 | 0.025 | 0.162 | 0.051 | 0.012 | -0.028 |
| Ni-Cr/1b | 0.092 | -0.018 | 0.363 | -0.012 | N/A | (-5.750 | 5.734) | |
| Ni-Cr/1c | 0.095 | -0.021 | 0.325 | 0.027 | 0.215 | -0.002 | N/A | |
| Ni-Cr/2a | 0.095 | -0.021 | 0.367 | -0.016 | 0.236 | -0.022 | -0.029 | 0.012 |
| Ni-Cr/2b | 0.095 | -0.021 | 0.367 | -0.016 | 0.239 | -0.025 | 0.013 | -0.029 |
| Ni-Cr/2c | 0.098 | -0.024 | 0.359 | -0.008 | N/A | N/A | ||
Interactions between pairs of Ni and Cr solutes, given in Table 10, are weak in general. The only non-negligible attraction observed here is between pairs of Ni atoms of up to 0.1 eV at 1nn separation and at around 0.06 eV for the afmI state at 2nn. This extended attraction may well result from the particularly strong and long-ranging influence of Ni on neighbouring magnetic moments in that state. Interactions between pairs of Cr atoms are repulsive at 1nn separation and found to be particularly strong for the fm-HS state where eV. A very similar negative binding was found for Cr-Cr pairs in bcc fm FeOlssonTMSol at 1nn separation. The binding of Ni-Ni pairs was found to be almost negligible in bcc Fe, in contrast to the modest attraction seen in afm states here, but consistent with our findings for the fm-HS state. Interactions between pairs of Ni and Cr are mostly negligible save for some signs of an attraction at 1nn in the afm states. Based on these solute pair interactions we suggest that the amount of short-range order in alloys at typical operating temperatures for nuclear applications will be small but with a tendency for locally enhanced Ni-Ni and reduced Cr-Cr ordering over the random alloy.
We have performed a small set of solute cluster calculations, containing up to five solute atoms, in order to further investigate the trends seen for pairs of solutes and to investigate whether a simple pair interaction model is consistent with the data. The results of our calculations, which were performed only for the fct afm states, are given in Table 11.
| Config. | fct afmD | fct afmI | ||
|---|---|---|---|---|
| Ni:(0,5,7) | 0.141 | 0.111 | 0.272 | 0.227 |
| Ni:(0,5,6) | 0.124 | 0.128 | 0.231 | 0.269 |
| Cr:(0,5,7) | 0.795 | 0.008 | 0.266 | -0.125 |
| Cr:(0,5,6) | 0.815 | -0.012 | 0.256 | -0.115 |
| Ni:(0), Cr:(5,6) | 0.549 | 0.071 | 0.155 | 0.105 |
| Cr:(0), Ni:(5,6) | 0.361 | 0.075 | 0.202 | 0.179 |
| Ni:(5,6,14,15) | 0.336 | -0.000 | 0.430 | 0.236 |
| Cr:(5,6,14,15) | 1.085 | -0.015 | 0.251 | -0.063 |
| Ni:(0), Ni:(5,6,14,15) | 0.326 | 0.094 | 0.367 | 0.466 |
| Ni:(0), Cr:(5,6,14,15) | 1.138 | 0.016 | 0.357 | -0.003 |
| Cr:(0), Ni:(5,6,14,15) | 0.559 | 0.045 | 0.422 | 0.291 |
| Cr:(0), Cr:(5,6,14,15) | 1.386 | -0.048 | 0.422 | -0.187 |
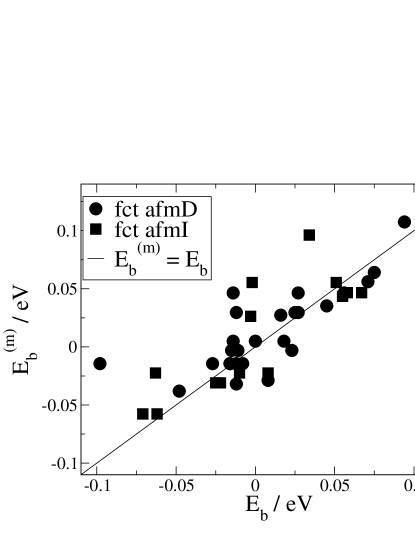
It is immediately apparent that the most strongly bound solute clusters contain predominantly Ni atoms. More particularly these clusters contain a majority of Ni-Ni 1nn and 2nn pair bonds and Ni-Cr 1nn bonds indicating these results are consistent with the binding energies of pairs of interacting solutes and that a pair interaction model is justified. In order to quantify this claim we have performed fits to our solute cluster and solute pair binding energies using a pair bond model. The form of this model is similar to that used for defect clusters but now we have to count the numbers of Ni-Ni, Ni-Cr and Cr-Cr bonds independently, resulting in a 6 parameter model:
| (4) | |||||
Fits to the fct afmD dataset with this model showed good agreement within errors. For the afmI dataset the agreement was also generally good but there were clear outliers from the fit. Further inspection showed that these outliers came exclusively from configurations containing Ni atoms in the (5,6,14,15) positions i.e. those with Ni-Ni 3nn bonds. A calculation of the relevant Ni-Ni 3nn binding energy in afmI gave a value of 0.055 eV. Within a pair bond model this result is consistent with the relatively high binding energies seen in the outliers and we have therefore included an extra term to include contributions from Ni-Ni 3nn bonds in the afmI fit. We have not attempted a combined fit to the afmI and afmD datasets because the magnitude and range of the solute-solute interactions is too distinct and the number of fit parameters differs between the sets. The results for the 6 parameter fct afmD and 7 parameter fct afmI fits are compared with the data in Fig. 7 and the fit parameters given in Table 12.
| Parameter | afmD | afmI |
|---|---|---|
| /eV | 0.046 | 0.096 |
| /eV | -0.014 | -0.058 |
| /eV | 0.030 | 0.055 |
| /eV | 0.005 | 0.047 |
| /eV | -0.003 | -0.022 |
| /eV | -0.014 | -0.031 |
| /eV | — | 0.043 |
As was noted earlier the data presented in Fig. 7(a) show generally good agreement between model and data for solute clusters. The seemingly greatest disagreement is present in the central section of the graph, as shown in Fig. 7(b), which primarily contains binding energies for pairs of solutes. All of the significant outlying points, however, come from symmetry-breaking effects in the reference states, resulting in a spread of data values corresponding to a single model value, just as was seen for the vacancy cluster data. Our models agree with this data in the sense that the model value for a particular configuration lies within the spread of data, effectively finding an average value that is most consistent with all of the cluster data. The generally good agreement between solute pair and cluster data strengthens our suggestion that the amount of short-range ordering in alloys will be weak but with some tendency for enhanced Ni-Ni ordering and the possibility of forming Ni rich clusters. Our results do not, however, rule out the possibility of complex many-body effects in concentrated alloys.
V.1 Defect-Solute interaction
We present our results for the binding of Ni and Cr solutes to a single vacancy defect in Table 13 and for their vacancy mediated migration in Table 14.
| A-B/Config. | fcc afmD | fct afmD | fct afmI | |||
|---|---|---|---|---|---|---|
| V-Ni/1a | 1.596 | 0.043 | 1.847 | 0.056 | 2.031 | 0.089 |
| V-Ni/1b | 1.626 | 0.013 | 1.876 | 0.027 | N/A | |
| V-Ni/1c | 1.675 | -0.036 | 1.887 | 0.016 | 2.078 | 0.042 |
| V-Ni/2a | 1.614 | 0.026 | 1.906 | -0.003 | 2.109 | 0.011 |
| V-Ni/2b | 1.687 | -0.048 | 1.914 | -0.011 | 2.130 | -0.010 |
| V-Ni/2c | 1.691 | -0.051 | 1.909 | -0.005 | N/A | |
| V-Cr/1a | 1.866 | -0.087 | 2.083 | 0.004 | 1.970 | 0.030 |
| V-Cr/1b | 1.845 | -0.066 | 2.161 | -0.075 | N/A | |
| V-Cr/1c | 1.866 | -0.088 | 2.177 | -0.091 | 2.079 | -0.079 |
| V-Cr/2a | 1.803 | -0.025 | 2.103 | -0.017 | 2.052 | -0.052 |
| V-Cr/2b | 1.818 | -0.039 | 2.153 | -0.066 | 2.075 | -0.075 |
| V-Cr/2c | 1.814 | -0.036 | 2.091 | -0.004 | N/A | |
| Solute/Config. | fcc afmD | fct afmD | fct afmI | |||
|---|---|---|---|---|---|---|
| Ni/1a | 2.901 | 1.305 | 2.738 | 0.891 | 3.014 | 0.983 |
| Ni/1b | 2.509 | 0.883 | 3.049 | 1.172 | N/A | |
| Ni/1c | 2.608 | 0.932 | 3.066 | 1.179 | 3.441 | 1.363 |
| Cr/1a | 2.712 | 0.846 | 2.643 | 0.560 | 2.705 | 0.735 |
| Cr/1b | 2.417 | 0.572 | 2.903 | 0.742 | N/A | |
| Cr/1c | 2.523 | 0.657 | 3.021 | 0.844 | 3.101 | 1.022 |
We find that Ni binds to a vacancy but by no more than 0.1 eV at 1nn and shows no sign of interaction at 2nn. In contrast the Cr-vacancy interaction is repulsive overall, even at 2nn, with (negative) binding energies as low as -0.091 eV. Calculations in bcc FeOlssonTMSol , in contrast, show that both Cr and Ni bind to a vacancy: Cr by 0.2 eV at 2nn separation and Ni by 0.07 eV at 1nn. The lack of any strong tendency for vacancy binding suggests that the rate of microstructural evolution and of creep should be relatively unaffected, at least in dilute alloys under irradiation. There is, however, strong experimental evidence that increasing Ni content suppresses void formationGanWas ; Allen . The inclusion of small quantities ( 1 at. %) of oversized solutes, such as Zr and Hf, in austenitic Fe-Cr-Ni alloys was also found to significantly suppress void formation and radiation-induced segregation (RIS) at grain boundariesKatoVoid ; KatoRIS ; Allen ; Ardell . KatoKatoVoid ; KatoRIS suggested the positive binding of vacancies to the relatively immobile oversized solutes as a mechanism by enhancing recombination and inhibiting vacancy diffusion, which is supported by the modelling of StepanovStepanov in the case of RIS. The vacancy-Ni binding observed in this work is small but is likely to be cumulative and should therefore not be overlooked as a contributory mechanism for void suppression at higher Ni concentrations. The cumulative effect may also be able to explain the reduction in the experimentally determined vacancy formation energy with increasing Ni content in FeCrNi austenitic alloysDimitrov .
The barrier energies for vacancy migration steps involving solute-vacancy exchange (in Table 14) show that those for Ni are consistently higher than those for Cr by between 0.25 and 0.43 eV. In the afmD states the migration barrier heights for Fe self-diffusion (Table 3) lie consistently between those for Ni and Cr in all but the 1c path, presumably because of the higher cost of suppressing the Fe moment to zero, as discussed earlier. The very same ordering of migration barrier heights was found for Cr, Fe and self-diffusion in fcc Ni in ab initio studies by Domain and BecquartabInitioPerfect ; DomainNi and by TuckerTucker ; TuckerThesis with barrier heights of 0.8, 0.95 and 1.05 eV for Cr, Fe and Ni, respectively. In the fct afmI state the low barrier height for self-diffusion along path 1a results in a reversal of the Fe and Cr ordering relative to this trend but Ni remains consistently with the highest barrier.
The migration barrier heights by themselves suggest a particular ordering for the rate of diffusion of Cr, Ni and Fe in these reference states. However, care should be taken to incorporate correlation effects associated with vacancy-mediated diffusion, such as those included in the 5-frequency model of Lidiard and LeClaireLidiard ; LeClaire , before conclusions can be made. By the use of suitable approximations we derive an expression for the ratio of diffusion coefficients, , in the 5-frequency model in Appendix A. This is given in Eqns. (14) and (18) and only depends on 4 quantities, namely , , and , as defined in Eqns. (13), (15) and (16).
Our calculations allow a direct evaluation of for each of the distinct 1nn vacancy-solute exchange paths in the afmD and afmI states. For the migration enthalpies, and , at zero pressure we use the migration barrier heights in Tables 3 and 14, respectively. We take at zero pressure as from Table 13. The error associated with this use of constant volume results for the zero-pressure case can be estimated using the Eshelby correction term and amounts to a few meV at most. The results for are given in Table 15.
| Solute/Config. | fcc afmD | fct afmD | fct afmI |
|---|---|---|---|
| Ni/1a | -0.216 | -0.092 | -0.272 |
| Ni/1b | -0.158 | -0.097 | N/A |
| Ni/1c | 0.300 | 0.418 | 0.403 |
| Cr/1a | 0.113 | 0.187 | -0.083 |
| Cr/1b | 0.074 | 0.231 | N/A |
| Cr/1c | 0.523 | 0.646 | 0.623 |
Results for the 1c path are clearly distinct from the others. We attribute this to the overestimation of the self-migration barrier along this path, resulting in an overestimation of that is independent of the solute species. In the afmD states, values for along 1a and 1b are rather similar, implying that a significant cancellation of systematic differences has occurred in their calculation. The true value along the 1c path may also be similar, which is consistent with their solute-independent but reference-state-dependent overestimation. We take the arithmetic mean of the 1a and 1b results as suitable estimates in our diffusion coefficient modelling e.g. in the fct afmD state eV and eV. For the fct afmI state we use the 1a results.
We expect the factors and to be close to unity and weakly temperature dependent for Ni and Cr solutes in our reference states. Ab initio evaluations of these factors for the similar case of Cr and Fe solutes in fcc Ni from the work of Tucker et al.Tucker are certainly consistent with this expectation. We set in our analysis of (Eq. (14)) but can account for any deviation from this value by noting that is linear in and approximately linear (although strictly sub-linear) in .
A detailed calculation of , which would require a determination of the transition state energy using the NEB method for a large number of symmetry nonequivalent configurations has not been performed here. In the few cases where the transition state is stabilised by the symmetry of the configuration, however, we find values in the range -0.2 to 0.2 eV. We therefore conservatively estimate that will lie somewhere between -0.5 and 0.5 eV and since is a monotonically increasing function of , its evaluation at -0.5 and 0.5 eV will give a measure of the resulting uncertainty. We present our results for , and in Fig. 8.
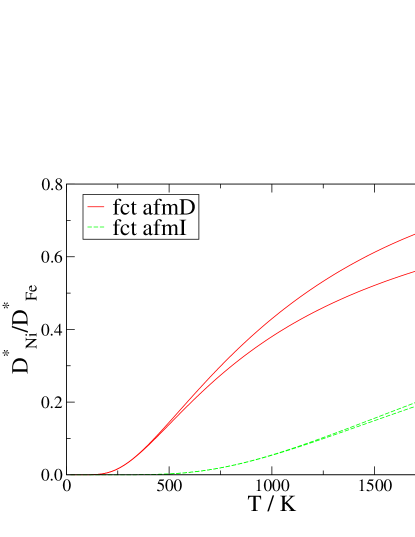
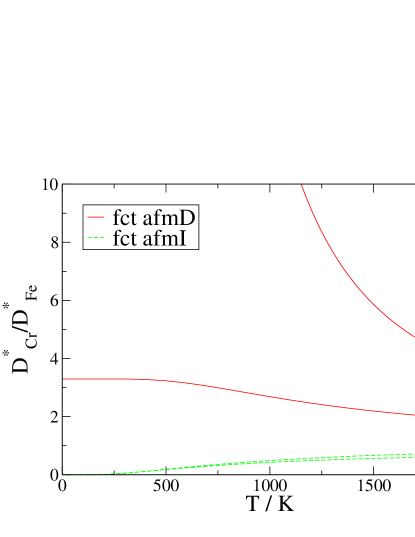
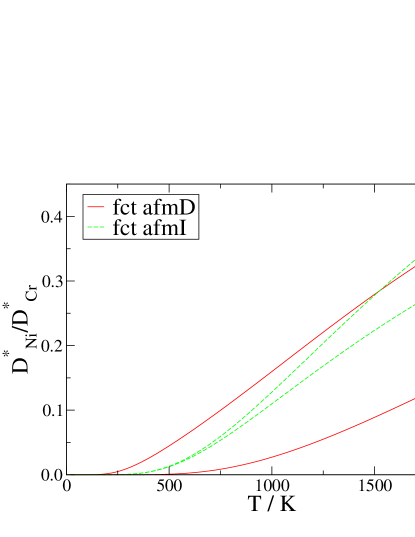
With our choice of model parameters, Ni diffusion is found to be significantly slower than that of both Cr and Fe in both reference states, especially at typical operating temperatures for nuclear energy applications. The appropriate combination of and factors would have to change significantly from 1 i.e. by at least a factor of 2 to alter this conclusion, which we believe to be unlikely. The relative ordering of Cr and Fe diffusion, however, depends on the reference state, with Cr being the fastest diffusing species in the fct afmD state and Fe in the fct afmI state. We cannot, therefore, make any general predictions regarding the relative diffusivity of Cr and Fe in austenite.
The preferential association of solutes with a radiation-induced (point) defect flux (i.e. the inverse Kirkendall effect) is posited as the primary mechanism for RIS in Fe-Cr-Ni austenitic alloys, where Cr depletion and Ni enhancement is observed at grain boundaries and other defect sinks is observedMarwick ; AllenRIS ; WasRIS . These observations can be adequately explained by the preferential diffusion of Cr over Ni by the vacancy mechanismMarwick ; AllenRIS ; WasRIS as long as the induced Cr flux is in the opposite direction to the vacancy flux. We note, however, that interstitial mediated diffusionWiedersich may also contribute to the relative rates of diffusion, which we discuss later in this section. Our results certainly show a preferential diffusion of Cr over Ni but an analysis of diffusion coefficients does not determine the relative direction of solute flow to the vacancy flux. The vacancy windManningWind , , which we discuss in Appendix B, provides a means to investigate this question. The solute and vacancy fluxes are in opposite directions when and the same direction when . In the 5-frequency model, with our approximations, the only parameter of is (Eq. (20)). When the vacancy and solute fluxes are opposite at all temperatures. However, if then there exists a temperature below which the solute and vacancy flux are in the same direction (see Fig. 10). We have not performed a detailed calculation of in this work. However, the few high symmetry cases we were able to calculate give a consistently negative value for Cr and either zero or positive values for Ni. This is not conclusive but does indicate that Cr solutes will diffuse opposite to the vacancy flux. It also indicates that Ni is more likely to diffuse with the vacancy flux than opposite it, which would further enhance the Ni enhancement at defect sinks.
| Defect | fcc afmD | fct afmD | fct afmI | |||
|---|---|---|---|---|---|---|
| Octa Ni (1) | unstable | unstable | 4.920 | -0.400 | ||
| Tetra Ni uu (2) | 4.314 | -0.765 | 4.447 | -0.499 | N/A | |
| Tetra Ni ud (3) | 3.766 | -0.467 | 4.086 | -0.338 | 5.180 | -0.691 |
| Ni crow. (4) | unstable | unstable | ||||
| Ni crow. uu (5) | 4.116 | -0.378 | 4.507 | -0.167 | N/A | |
| Ni crow. ud (6) | 4.006 | -0.164 | 4.296 | -0.044 | 5.336 | -0.370 |
| FeNi dumbbell | 3.416 | -0.471 | 3.717 | -0.317 | 4.112 | -0.414 |
| FeNi dumbbell | 3.069 | -0.311 | 3.215 | 0.065 | 4.116 | -0.334 |
| NiFe dumbbell | 3.097 | -0.340 | 3.469 | -0.190 | as FeNi | |
| FeNi dumbbell | 3.431 | -0.132 | 3.740 | 0.007 | 4.378 | 0.111 |
| NiFe dumbbell | 3.701 | -0.153 | 3.989 | -0.041 | as FeNi | |
| Octa Cr (1) | unstable | unstable | 4.177 | 0.223 | ||
| Tetra Cr uu (2) | 3.550 | 0.137 | 3.785 | 0.347 | N/A | |
| Tetra Cr ud (3) | 3.305 | 0.133 | 3.580 | 0.351 | 4.305 | 0.064 |
| Cr crow. (4) | unstable | unstable | ||||
| Cr crow. uu (5) | 3.740 | 0.137 | 4.166 | 0.357 | N/A | |
| Cr crow. ud (6) | 3.691 | 0.290 | 4.025 | 0.411 | 4.606 | 0.259 |
| FeCr dumbbell | 3.050 | 0.034 | 3.385 | 0.198 | 3.583 | -0.005 |
| FeCr dumbbell | 2.933 | -0.036 | 3.184 | 0.279 | 3.592 | 0.070 |
| CrFe dumbbell | 2.850 | 0.047 | 3.267 | 0.196 | as FeCr | |
| FeCr dumbbell | 3.414 | — | 3.739 | — | 4.387 | 0.219 |
| CrFe dumbbell | unstable | unstable | as FeCr | |||
| NiNi dumbbell | 3.897 | -0.413 | 4.620 | -0.755 | ||
| NiCr dumbbell | 3.643 | 0.024 | 3.939 | -0.194 | ||
| CrCr dumbbell | 3.826 | 0.025 | 3.930 | -0.305 | ||
| NiNi dumbbell | 3.438 | -0.075 | 4.160 | -0.210 | ||
| NiCr dumbbell | 3.344 | 0.203 | 3.943 | -0.114 | ||
| CrNi dumbbell | 3.162 | 0.385 | as NiCr | |||
| CrCr dumbbell | 3.536 | 0.195 | 3.931 | -0.269 | ||
We present our results for interstitial Ni and Cr solutes in Table 16. It is clear from the data that Ni is strongly repelled from interstitial sites, negative binding showing a direct preference for self-interstitial defects and substitutional Ni. A small but positive binding was found for the FeNi [001] dumbbell but only for the fct afmD state. While interesting, this result is at odds with the other reference states so cannot be taken as a general conclusion for austenite. The generally repulsive trend is also supported by observations that in mixed dumbbell configurations the Ni atom is generally closer to the lattice site than Fe. For the [111] FeNi and [111] NiFe dumbbells this asymmetry is so pronounced that the configuration must be considered as a tetrahedral Fe interstitial with a substitutional Ni atom at 1nn separation and the binding energies given in the table have been calculated accordingly. Although relatively stable, these states are always less stable than mixed dumbbells and are important only as possible intermediate states in the rotation, migration and disassociation of the stable interstitials.
In contrast, Cr generally shows positive binding to interstitial sites, an effect that is particularly prevalent in the afmD states. In mixed dumbbell configurations the trend is for Cr atoms to be farther from the lattice site than Fe. This was particularly pronounced for the [111] CrFe dumbbell in the afmD state which relaxed to the tetrahedral Cr ud configuration. Once again the mixed dumbbell configurations are the most stable.
Our calculations for doubly mixed dumbbells, show a clear distinction between the fct afmI and afmD states. We find that NiCr dumbbells exhibit the strongest binding in afmD and while the same configurations are the most stable for afmI the interaction is repulsive. One result that the two states do have in common, however, is that in NiCr dumbbells the Ni atom is generally closest to the lattice site and the effect is more pronounced than for mixed FeNi dumbbells.
The emerging picture here is of a general order of preference for the different atomic species to be found within overcoordinated defects with Cr being the most stable, followed by Fe and finally Ni. There is evidence of the same ordering in ab initio studies of bcc fm Fe where Cr shows significant binding to overcoordinated defectsFeCrOlssonC ; FeCrKlaverB and there is a repulsive interaction between Ni and the most stable dumbbellOlssonTMSol . Ab initio studies of dilute Cr and Fe in fcc NiDomainNi ; TuckerThesis also show that Cr binds strongly to the dumbbell in mixed and doubly mixed forms but Fe shows little interaction. This preferential binding of Cr to overcoordinated defects should result in a positive association of Cr with the interstitial defect flux in irradiated environmentsArdell ; WasRIS ; Wiedersich . This is an interesting result as it is in the opposite sense to the flux resulting from the vacancy mechanism of the inverse Kirkendall effect.
The same interstitial mechanism was proposed for Ni as a possible explanation for RIS in Fe-Cr-Ni austenitic alloys, e.g. the work of WatanabeWatanabe where a binding of 0.75 eV was suggested. The inclusion of this effect in models of RIS was, however, shown to be inconsistent with experimentAllenRIS for binding energies from 0.1 to 1.5 eV and our results are consistent with these findings.
| Config. | fcc afmD | fct afmD | fct afmI | |||
|---|---|---|---|---|---|---|
| -Ni/1a | 2.831 | -0.074 | 3.286 | -0.006 | 3.783 | -0.001 |
| -Ni/1b | 2.887 | -0.129 | 3.249 | 0.030 | N/A | |
| -Ni/1c | 2.949 | -0.191 | 3.357 | -0.078 | 3.783 | -0.001 |
| -Ni/2a | 3.313 | -0.034 | 3.861 | -0.079 | ||
| -Ni/2b | 3.291 | -0.011 | 3.723 | 0.059 | ||
| -Ni/2c | 3.209 | 0.070 | N/A | |||
| -Ni/1a | 3.484 | -0.085 | 3.769 | -0.071 | ||
| -Ni/1b | 3.373 | 0.027 | N/A | |||
| -Ni/1b | 3.453 | -0.053 | N/A | |||
| -Ni/1c | 3.379 | 0.021 | 3.710 | -0.012 | ||
| -Ni/1c | 3.402 | -0.003 | 3.726 | -0.028 | ||
| -Ni/2a | 3.279 | 0.121 | 3.598 | 0.100 | ||
| -Ni/2a | 3.376 | 0.024 | 3.747 | -0.049 | ||
| -Ni/2b | 3.404 | -0.004 | 3.692 | 0.006 | ||
| -Ni/2c | 3.382 | 0.017 | N/A | |||
| -Cr/1a | 2.953 | -0.056 | 3.428 | 0.035 | 3.614 | 0.048 |
| -Cr/1b | 2.859 | 0.038 | 3.274 | 0.189 | N/A | |
| -Cr/1c | 2.843 | 0.053 | 3.270 | 0.193 | 3.547 | 0.115 |
| -Cr/2a | 3.500 | -0.037 | 3.783 | -0.121 | ||
| -Cr/2b | 3.394 | 0.069 | 3.670 | -0.008 | ||
| -Cr/2c | 3.467 | -0.004 | N/A | |||
| -Cr/1a | 3.407 | 0.176 | 3.527 | 0.051 | ||
| -Cr/1b | 3.471 | 0.112 | N/A | |||
| -Cr/1b | 3.492 | 0.091 | N/A | |||
| -Cr/1c | 3.529 | 0.054 | 3.577 | 0.001 | ||
| -Cr/1c | 3.461 | 0.122 | 3.575 | 0.003 | ||
| -Cr/2a | 3.570 | 0.013 | 3.526 | 0.052 | ||
| -Cr/2a | 3.552 | 0.031 | 3.608 | -0.030 | ||
| -Cr/2b | 3.522 | 0.061 | 3.569 | 0.009 | ||
| -Cr/2c | 3.598 | -0.015 | N/A | |||
The formation and binding energies of single Ni and Cr solutes to self-interstitial dumbbells at 1nn and 2nn separation is presented in Table 17. In both the fct afmI and afmD states Ni is most stable in the tensile 2nn site, collinear with the dumbbell axis, exhibiting a binding up to approximately 0.1 eV. These are also the most stable configurations found here for a single Ni solute interacting with an overcoordinated defect, although in the fct afmD state the FeNi [001] dumbbell is close in energy. Although small, this binding allows Ni to act as a weak trap that inhibits interstitial diffusion and is therefore worth consideration in models of microstructure evolution and RIS, especially at higher Ni concentrations. Finally, it is worth noting that Ni is most strongly repelled from compressive sites at 1nn to the self-interstitial dumbbell.
For Cr there is less agreement between the two magnetic states. In fct afmD the FeCr and CrFe [001] mixed dumbbells are the most stable, closely followed by Cr in compressive sites at 1nn to a self-interstitial dumbbell. The same configurations are found to be among the most stable in the fct afmI state although others are at least as stable with no discernible preference for tensile or compressive sites. Despite these differences our dilute results show that, on average, Cr exhibits positive binding to dumbbells in mixed or neighbouring sites, where like Ni it would act as a weak trap for interstitial diffusion.
Overall, the interactions of Ni and Cr solutes with point defects in austenitic Fe are consistent with what would intuitively be expected of moderately oversized and undersized solutes, respectively. Ni binds to the vacancy and is generally repelled from the mixed and compressive sites of dumbbells but shows positive binding in the tensile sites. Cr generally exhibits the opposite tendencies. Such a conclusion should, however, be contrasted with the lack of consistent behaviour for single solutes in defect-free Fe, as discussed earlier. Indeed, experimental resultsStraalsund find Ni to be undersized and Cr oversized in an austenitic Fe-Cr-Ni alloy, consistent with the pure elements. This may account for the earlier attempts to suggest a positive binding of Ni to interstitial defects which our results show is an unwarranted conclusion.
As a final means to draw conclusions from the data we have plotted our results for the solute substitution energy, solute-vacancy binding energies and binding energies of solutes to the most stable interstitial dumbbells in the mixed positions in austenitic Fe against the corresponding values for bcc Fe in Fig. 9. Ab initio data for bcc Fe was either as published previouslyFeCrOlssonC ; OlssonTMSol ; KlaverFeCrBench or calculated here with similar settings.

It is immediately clear that there is no discernible correlation between the two data sets, which is in complete contrast to the strong similarity found for pure Fe. The (vertical) spread of fcc data also illustrates just how strong the effects of symmetry breaking within and between the two afm datasets can be, especially when compared to the average binding energies. We note that data for the afmI state appears to be lower, on average, than the afmD dataset. We suggest that these result simply emphasise just how sensitive the interactions of solutes and point defects are to their local magnetic environment in the Fe-Cr-Ni system in addition to the usual volume-elastic effects. The importance of developing a deeper understanding of these effects cannot be overemphasised for the modelling of austenitic alloys.
VI Conclusions
We have carried out an extensive series of first-principles calculations to determine the energetics of austenitic steels. We first investigated a large set of possible reference states for austenite at 0 K and found the fct afmI and afmD states to be the most suitable, highlighting the problems with the unstable equilibrium fm-HS states in the process. It would be incorrect to associate any defect property of a paramagnetic material with a single microstate. However, by sampling various reference configurations we have been able to provide estimates of defect energies typically to within a few tenths of 1 eV. The uncertainties associated with choice of reference state in this work are in addition to the normal discrepancy between ab initio and experimental quantities arising from, on one hand, choice of pseudopotential, exchange-correlation potential, neglect of zero-point energy, and on the other from finite temperature and experimental errors. However, with considerably more computational effort, our dataset for austenitic materials has only moderately larger uncertainties than previous ones for ferritic steels.
The main results and predictions of the paper can be summarised as follows:
-
i/
The vacancy formation energy in austenite (at 0 K) is between 1.8 and 1.95 eV. Divacancy binding is rather weak at around 0.1 eV, suggesting that the nucleation of voids will face a nucleation barrier at elevated temperatures. There is, however, a rapid increase in total binding energy with cluster size e.g. 2.5 eV for a six vacancy octahedral cluster. SFT exhibit similarly strong binding to the proto-voids (e.g. octahedral cluster) considered here and we therefore cannot distinguish between these two on energetic grounds.
-
ii/
The most stable self-interstitial is the dumbbell, consistent with other fcc metals, with a formation energy of between 3.2 and 3.6 eV. These dumbbells aggregate strongly to form small defect clusters in (100) planes and although not considered here, pair binding also suggests that clusters in (111) planes would also exhibit high stability.
-
iii/
Pair bond models for the total binding of defect pairs and clusters agree well with the data and are able to capture and highlight general trends.
-
iv/
Our results show that Ni and Cr do not strongly attract each other: Binding energies of at most 0.1 eV were found for Ni-Ni pairs. The binding energies of solute clusters were consistent with pair interactions and fits to a pair bond model showed good agreement.
-
v/
We find that Ni binds to vacancies but by no more than 0.1 eV and can therefore act as a weak trap for vacancy migration, which may be of importance for void formation and RIS in concentrated alloys. The Cr-vacancy interaction is weakly repulsive, suggesting that its effect on microstructure evolution and creep is negligible but concentration dependent effects cannot be ruled out in this study. Tracer diffusion coefficient calculations found that Ni diffuses significantly more slowly than Cr and Fe. Our calculations were also consistent with Cr diffusing in the opposite sense to the vacancy flux and indicate that Ni may diffuse with the vacancy flux. Both of these results are consistent with the standard mechanism used to explain the effects of RIS in austenitic alloys by vacancy mediated diffusion.
-
vi/
Cr was found to bind to mixed interstitial defects whereas Ni is generally repelled. The preferential association of a particular solute with the interstitial flux under irradiation is considered an important factor in RIS and our findings for Cr are worthy of consideration in the modelling of such effects. Substitutional Ni and Cr bind to self-interstitial dumbbells at nearest neighbour sites and therefore act as weak traps for their migration.
-
vii/
Our results in austenitic Fe were compared with equivalent results in ferritic Fe. A strong similarity was found between these two datasets for point defect formation and binding energies in pure Fe. In contrast, no correlation was observed for Ni and Cr solute interactions with point defects.
-
viii/
We performed tests for the presence and influence of non-collinear magnetism in a subset of configurations. The tests either proved negative or resulted in marginal changes to the energy of the system. It should be borne in mind that such tests were useful to perform but are by no means exhaustive.
In very broad terms, we have found that austenitic Fe behaves similarly to other fcc metals, with interstitials clustering to form proto-dislocation loops and vacancies clustering to form sessile SFT and voids. This normality is in contrast to the often anomalous behaviour of bcc Fe. The interactions of Ni and Cr with point defects are consistent with those of modestly oversized and undersized defects, respectively, despite the experimentally observed size factors and pure element data showing the opposite result. Migration of Cr through the lattice by both vacancy and interstitial mechanisms is enhanced relative to Fe self-diffusion. By contrast Ni migration is slow. Pure fcc Fe is stable only at high temperature, but the similarity to other fcc metals strongly suggests that FeCrNi steels stabilised at lower temperature by alloying will also behave normally.
Of course, to make these predictions more quantitative it will be necessary to run further calculation using a method suited to larger systems and longer timescales, such as molecular dynamics or kinetic Monte Carlo. One of the main benefits of this study is to provide a large database of configurations against which such models can be parametrised.
Acknowledgements.
This work was sponsored by the EU-FP7 PERFORM-60 project and by EPSRC through the UKCP collaboration.Appendix A Tracer diffusion coefficients
The diffusion coefficient, , describing atomic diffusion in a crystalline material (in 3 dimensions) is given byLeClaire
| (5) |
where is the number of atomic jumps per unit time, is the length of each jump and is the correlation factor, which encodes the fact that successive jumps are, in general, correlated. In a solid solution the diffusion of the solvent element, A, and any substitutional (i.e. on lattice) solute element, B, is mediated by either vacancy or interstitial defects. In these cases it is clear that correlations will arise because the defect mediating a jump will still be present next to the migrating atom after the jump, which, for example, makes the reverse jump more likely than others.
The tracer diffusion coefficient, , for a solute, B, is the diffusion coefficient for B in solvent, A, in the limit where the concentration of B atoms tends to zero. The jump frequency, , for vacancy-mediated tracer diffusion of B is given by
| (6) |
where is the vacancy jump frequency for exchange with a B atom at 1nn and is the probability that a vacancy is associated with a B atom at 1nn and is given by
| (7) |
where is the vacancy concentration, z is the coordination number of the lattice, is the Gibbs free energy of binding for a B atom and vacancy at 1nn (defined in an equivalent manner to the binding energy in Eq. (2)) and where is Boltzmann’s constant and is the temperature. The tracer diffusion coefficient is then given by
| (8) |
In the 5-frequency model of Lidiard and LeClaireLidiard ; LeClaire the correlation factor, , is given in an fcc lattice by ManningManning as
| (9) |
where the are the vacancy jump frequencies for solvent-vacancy exchanges: is where the vacancy is 1nn to B and remains so after the jump; is where the vacancy is 1nn to B and does not remain so after the jump i.e. a dissociative jump; is where the vacancy is not at 1nn to B but is so after the jump i.e. an associative jump and the opposite of and is for a jump in the pure solvent i.e. self-diffusion. The factor, , is the fraction of dissociative jumps that do not return to a site 1nn to B and we have used the expression from Koiwa and IshiokaKoiwa here
| (10) |
where and the coefficients, and are given in Table 18.
| 0 | 1 | 2 | 3 | 4 | |
|---|---|---|---|---|---|
| — | 1338.0577 | 924.3303 | 180.3121 | 10 | |
| 435.2839 | 595.9725 | 253.3000 | 40.1478 | 2 |
An identical expression for has been derived by Tucker et al.Tucker from results for the phenomenological coefficients by AllnattAllnatt .
The self-diffusion coefficient of solute A can be determined from Eq. (8) by considering B as a same-mass isotope of A. In this case all jump frequencies equal and giving
| (11) |
where the correlation factor, for fcc.
We use an Arrhenius-type expression for the vacancy jump frequencies,
| (12) |
where is the enthalpy difference between the transition state and initial (on-lattice) state at K for a jump i.e. the migration barrier height and is a weakly temperature-dependent pre-factor. We include the zero-point phonon contributions to the enthalpy at 0 K in the pre-factor. A similar expression can be found for the binding energy factor in Eq. (8) by writing as a K contribution, , (which excludes the zero-point energy) plus a term correcting for finite , which gives
| (13) |
where the pre-factor, , contains the term correcting for finite and is itself weakly temperature dependent.
Using Eqns. (12) and (13) we can write an expression for the ratio of to as
| (14) |
where
| (15) |
and is the binding enthalpy for a B solute to the transition state (TS) for a jump i.e. the lowering of enthalpy resulting from exchanging a B atom infinitely far from a migrating A atom with an A atom at the relevant site for a jump. It can be shown to be given by
| (16) |
where is the binding enthalpy for the initial (on-lattice) configuration for a jump. Eq. (16) actually holds for any vacancy jump in the presence of a single B solute atom and yields the correct limit that tends to when the B atom is sufficiently far away that the two binding energies are zero.
The relative diffusivities of B and A can be investigated using Eq. (14) as long as suitable expressions for all the factors can be found.
The expression for the correlation factor, , can be simplified using some reasonable approximations. First, note that we can re-express Eq. (16) to give
| (17) |
For and jumps we make the assumption that i.e. that the presence of the B solute does not influence the transition state enthalpy at this separation. This approximation is consistent with the results presented for Cr and Fe solutes in fcc Ni by Tucker et al.Tucker , where migration enthalpies were calculated directly, and we believe will also be for Cr and Ni solutes in fcc Fe.
In addition, we make the approximation that for all vacancy-solvent exchanges i.e. that this factor only depends on the element being exchangedTucker . The only other assumption we make is that i.e. that the binding between a B atom and vacancy is zero at 2nn, 3nn and 4nn separation, which is consistent with the data given in Table 13. Including these approximations in Eq. (9) gives
| (18) |
which we use along with Eq. (14) to investigate the relative diffusivities of Ni and Cr in fcc Fe.
Appendix B Vacancy Wind
It is also useful when investigating defect-mediated diffusion to be able to determine the direction of the solute flux relative to that of the corresponding defect flux. For vacancy-mediated diffusion the vacancy windManningWind , , allows this relationship to be investigated. When the flux of B solute atoms is opposite to the vacancy flux. By contrast, when they are in the same direction and the vacancy flux tends to drag any solute along with it.
In the 5-frequency model for fcc the vacancy wind is given by
| (19) |
which with the approximations used here becomes
| (20) |
The temperature dependence of is controlled by the single parameter, , which essentially determines whether vacancy jumps are more probable (for positive values) or less probable (for negative values) than dissociative jumps. When jumps are significantly more probable diffusion is dominated by the Johnson mechanismJohnsonMechanism where vacancy-solute complexes diffuse cooperatively. We plot versus temperature in Fig. 10 for a number of values of .
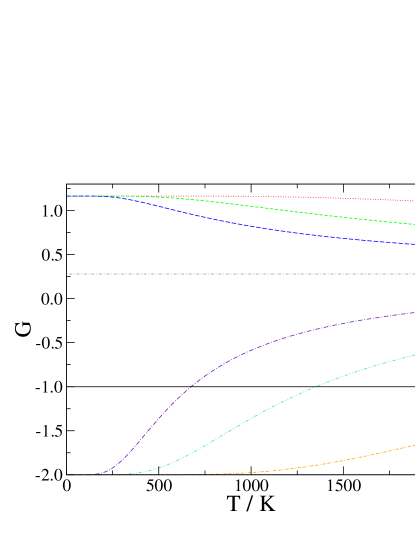
It is clear that if then and the solute flux is opposite the vacancy flux for all temperatures. However, if , then there exists a critical temperature, below which the vacancy drag mechanism prevails and diffusion is primarily by the Johnson mechanism.
References
- (1) H. L. Meyerheim, R. Popescu, D. Sander, J. Kirschner, O. Robach and S. Ferrer, Phys. Rev. B 71, 035409 (2005).
- (2) Y. Tsunoda, H. Nogami and M. Takasaka, Phys. Rev. B 76, 054419 (2007).
- (3) W. A. Hines, P. Shanthakumar, T. Huang, J. I. Budnick, R. L. Miller, D. M. Pease and D. M. Perry, Phys. Status Solidi B 246, 2154-2158 (2009).
- (4) M. Marsman and J. Hafner, Phys. Rev. B 66, 224409 (2002).
- (5) S. Han, L. A. Zepeda-Ruiz, G. J. Ackland, R. Car, D. J. Srolovitz, Phys. Rev. B 66, 220101 (2002).
- (6) G. J. Ackland and R. Thetford, Phil. Mag. A 56, 15 (1987).
- (7) L. A. Zepeda-Ruiz, J. Rottler, S. Han, G. J. Ackland, R. Car, and D. J. Srolovitz, Phys. Rev. B 70, 060102(R) (2004).
- (8) S. M. Foiles, M. I. Baskes, and M. S. Daw, Phys. Rev. B 33, 7983 (1986).
- (9) L. Malerba et al., J. Nucl. Mater 406, 7-18 (2010).
- (10) P. Olsson, I. A. Abrikosov, L. Vitos and J. Wallenius, J. Nucl Mater. 321, 84-90 (2003).
- (11) A. A. Mirzoev, M. M. Yalalov and D. A. Mirzaev, Phys. Met. and Metal. 97, 336 (2004).
- (12) P. Olsson, I. A. Abrikosov and J. Wallenius, Phys. Rev. B 73, 104416 (2006).
- (13) T. P. C. Klaver, R. Drautz, M. W. Finnis, Phys. Rev. B 74, 094435 (2006).
- (14) P. Olsson, C. Domain and J. Wallenius, Phys. Rev. B 75, 014110 (2007).
- (15) T. P. C. Klaver, P. Olsson and M. W. Finnis, Phys. Rev. B 76, 214110 (2007).
- (16) S. L. Chen, J. Y. Zhang, X. G. Lu, K. C. Chou and Y. A. Chang, J. Phase Equilib. Diffus. 27, 121-125 (2006).
- (17) G. Bonny, D. Terentyev and L. Malerba, Scr. Mater. 59, 1193-1196 (2008).
- (18) H. C. Herper, E. Hoffmann and P. Entel, Phys. Rev. B 60, 3839 (1999).
- (19) D. Spišák and J. Hafner, Phys. Rev. B 61, 16129 (2000); Phys. Rev. Lett. 88, 056101 (2002) ; Phys. Rev. B 67, 134434 (2003).
- (20) C. Domain and C. S. Becquart, Phys. Rev. B 65, 024103 (2001).
- (21) D. E. Jiang and E. A. Carter, Phys. Rev. B 67, 214103 (2003).
- (22) L. T. Kong and B. X. Liu, J. Alloys and Comp. 414, 36-41 (2006).
- (23) M. Körling and J. Ergon, Phys. Rev. B 54, R8293 (1996).
- (24) F. Körmann, A. Dick, B. Grabowski, T. Hickel and J. Neugebauer, Phys. Rev. B85, 125104 (2012).
- (25) B. Liu, in Numerical Algorithms in Chemistry: Algebraic Methods edited by C. Moler and I. Shavitt (Lawrence Berkley Lab. Univ. of California, 1978), p.49. ; E. R. Davidson, in Methods in Computational Molecular Physics, edited by G. H. F. Diercksen and S. Wilson, Vol. 113 NATO Advanced Study Institute, Series C (Plenum, New York, 1983), p. 95.
- (26) V. G. Gavriljuk, V. N. Shivanyuk and B. D. Shanina, Acta Materialia 53, 5017-5024 (2005).
- (27) D. W. Boukhvalov, Yu. N. Gornostyrev, M. I. Katsnelson, A. I. Lichtenstein, Phys. Rev. Lett. 99, 247205 (2007).
- (28) A. A. Mirzoev, M. M. Yalalov, D. A. Mirzaev, Phys. Met. and Metall. 103, 83-87 (2007).
- (29) I. A. Abrikosov, A.E. Kissavos, F. Liot, B. Alling, S. I. Simak, O. Peil and A. V. Ruban, Phys. Rev. B 76, 014434 (2007).
- (30) V. G. Gavriljuk, B. D. Shanina, V. N. Shyvanyuk and S. M. Teus, J. Appl. Phys. 108, 083723 (2010).
- (31) R. Nazarov, T. Hickel and J. Neugebauer, Phys. Rev. B 82, 224104 (2010).
- (32) G. Kresse and J. Hafner, Phys. Rev. B 47, 558-561 (1993).
- (33) G. Kresse and J. Furthmuller, Phys. Rev. B 54, 11169 (1996).
- (34) P. E. Blöchl, Phys. Rev. B 50, 17953 (1994).
- (35) G. Kresse and D. Joubert, Phys. Rev. B 59 1758 (1999).
- (36) J. P. Perdew et al., Phys. Rev. B 46, 6671 (1992).
- (37) S. H. Vosko, L. Wilk and M. Nusair, J. Can. Phys. 58, 1200 (1980).
- (38) D. J. Hepburn, G. J. Ackland, T. P. C. Klaver, Convergence test results for calculations in the paper : “Defect and solu te properties in Fe-Cr-Ni austenitic alloys: an ab initio study”, supplemental material for this manuscript.
- (39) S. Han, L. A. Zepeda-Ruiz. G. J. Ackland, R. Car and D. J. Srolovitz, J. App. Physics 93, 3328 (2003).
- (40) M. Methfessel and A. T. Paxton, Phys. Rev. B 40, 3616 (1989).
- (41) E. C. Bain, Trans. AIME 70, 25 (1924).
- (42) D. C. Wallace, Phys. Rev. 162 776 (1967).
- (43) J. -B. Piochaud et al. (to be published).
- (44) A. K. Majumdar and P. v. Blanckenhagen, Phys. Rev. B 29, 4079 (1983)
- (45) T. Korhonen, M. J. Puska and R. M. Nieminen, Phys. Rev. B 51, 9526 (1995).
- (46) H. Schultz and P. Ehrhart, in Atomic Defects in Metals, edited by H. Ullmaier, Landolt B rnstein, New Series, Group III (Springer, Berlin, 1991).
- (47) H. J. Wollenberger, in Physical Metallurgy Chapter 17: Point Defects, edited by R. W. Cahn and P. Haasen (North-Holland Physics Publishing, 1983), Part II, pp. 1139-221.
- (48) P. Ehrhart, H. -G. Haubold and W. Schilling, Adv. in Sol. State Phys. XIV, 87 (1974).
- (49) W. Schilling, J. Nucl. Mater. 69-70, 465-489 (1978).
- (50) F. W. Young Jr., J. Nucl. Mater. 69 & 70, 310-330 (1978).
- (51) G. J. Ackland, G. I. Tichy, V. Vitek, and M. W. Finnis, Phil.Mag.A 56, 735 (1987).
- (52) A. De Vita and M. J. Gillan, J. Phys.: Condens. Matter 3, 6225 (1991).
- (53) J. D. Tucker, R. Najafabadi, T. R. Allen and D. Morgan, J. Nucl. Mater. 405, 216 (2010).
- (54) J. Fridberg, L. -E. Torndahl and M. Hillert, Jernkont Ann. 153, 263 (1969).
- (55) C. Domain and C. S. Becquardt, FP6 Project Perfect Report No. P58, 2007 (unpublished).
- (56) A. C. Damask, G. J. Dienes and V. G. Weizer, Phys. Rev. 113, 781 (1959).
- (57) G. H. Vineyard, Discuss. Faraday Soc. 31, 7 (1961).
- (58) Y. Shimomura and R. Nishiguchi, Radiation Effects and Defects in Solids 141, 311-324 (1997).
- (59) H. Wang, D. S. Xu, R. Yang and P. Veyssiére, Acta Materialia 56, 4608-4620 (2008); Acta Materialia 57, 3725-3737 (2009); Acta Materialia 59 1-9 (2011); Acta Materialia 59 10-18 (2011); Acta Materialia 59, 19-29 (2011).
- (60) H. Wang, D. Rodney, D. Xu, R. Yang and P. Veyssiére, Phys. Rev. B 84, 220103 (2011).
- (61) G. J. Ackland, D. J. Hepburn and J. Wallenius, in Proceedings of the TMS 2010 Annual Meeting, arXiv:0912.3439.
- (62) D. A. Terentyev, T. P. C. Klaver, P. Olsson, M. -C. Marinica, F. Willaime, C. Domain and L. Malerba, Phys. Rev. Lett. 100, 145503 (2008).
- (63) P. Olsson, T. P. C. Klaver and C. Domain, Phys. Rev. B 81, 054102 (2010).
- (64) J. Gan and G. S. Was, J. Nucl. Mater. 297, 161-175 (2001).
- (65) T. R. Allen, J. I. Cole, J. Gan, G. S. Was, R. Dropek and E. A. Kenik, J. Nucl. Mater. 342, 90-100 (2005).
- (66) T. Kato, H. Takahashi and M. Izumiya, Materials Transactions JIM 32, 921-930 (1991).
- (67) A. J. Ardell, in Materials Issues for Generation IV Systems, edited by V. Ghetta et al. (Springer, 2008), p. 285.
- (68) T. Kato, H. Takahashi and M. Izumiya, J. Nucl. Mater. 189, 167-174 (1992).
- (69) I. A. Stepanov, V. A. Pechenkin and Yu. V. Konobeev, J. Nucl Mater. 329-333, 1214-1218 (2004).
- (70) C. Dimitrov and O. Dimitrov, J. Phys. F: Met. Phys. 14, 793-811 (1984).
- (71) J. D. Tucker, Ph.D. thesis, University of Wisconsin, Madison, 2008.
- (72) A. B. Lidiard, Phil. Mag. 46, 1218-1237 (1955).
- (73) A. D. LeClaire and A. B. Lidiard, Phil. Mag. 1, 518-527 (1956).
- (74) A. D. Marwick, J. Phys.: Metal. Phys. 8, 1849-1861 (1978).
- (75) T. R. Allen, J. T. Busby, G. S. Was and E. A. Kenik, J. Nucl. Mater. 255, 44-58 (1998).
- (76) G. S. Was, J. P. Wharry, B. Frisbie, B. D. Wirth, D. Morgan, J. D. Tucker and T. R. Allen, J. Nucl. Mater. 411, 41-50 (2011).
- (77) H. Wiedersich, P. R. Okamoto and N. Q. Lam, J. Nucl. Mater. 83, 98-108 (1979).
- (78) J.R. Manning, Can. J. Phys. 46, 2633-2643 (1968).
- (79) S. Watanabe, N. Sakaguchi, K. Kurome, N. Nakamura and H. Takahashi, J. Nucl. Mater 240, 251-253 (1997).
- (80) J. L. Straalsund and J. F. Bates, Metallur. Trans. 5, 493-498 (1974).
- (81) T. P. C. Klaver, G. Bonny, P. Olsson and D. Terentyev, Modelling Simul. Mater. Sci. Eng. 18, 075004 (2010).
- (82) J. R. Manning Phys. Rev. 116, 819-827 (1959) ; Phys. Rev. 128, 2169-2174 (1962) ; Phys. Rev. 136, A1758-A1766 (1964).
- (83) M. Koiwa and S. Ishioka, Phil. Mag. A47, 927-938 (1983).
- (84) A. R. Allnatt, J. Phys. C: Solid State Phys. 14, 5453-5466 (1981) ; J. Phys. C: Solid State Phys. 14 5467-5477 (1981).
- (85) R. P. Johnson, Phys. Rev. 56, 814-818 (1939).