Quasi-stationary simulations of the contact process on quenched networks
Abstract
We present high-accuracy quasi-stationary (QS) simulations of the contact process in quenched networks, built using the configuration model with both structural and natural cutoffs. The critical behavior is analyzed in the framework of the anomalous finite size scaling which was recently shown to hold for the contact process on annealed networks. It turns out that the quenched topology does not qualitatively change the critical behavior, leading only (as expected) to a shift of the transition point. The anomalous finite size scaling holds with exactly the same exponents of the annealed case, so that we can conclude that heterogeneous mean-field theory works for the contact process on quenched networks, at odds with previous claims. Interestingly, topological correlations induced by the presence of the natural cutoff do not alter the picture.
pacs:
89.75.Hc, 05.70.Jk, 05.10.Gg, 64.60.anI Introduction
Dynamical processes are strongly affected by the structure of the pattern which mediates interactions. This common wisdom, whose evidence has been confirmed by decades of investigations in statistical mechanics, has assumed a new relevance in recent years, with the advent of complex networks theory. Percolation, epidemic spreading or synchronization are among the phenomena for which the effect of a disordered topology has been more thoroughly studied Callaway et al. (2000); Pastor-Satorras and Vespignani (2001); Arenas et al. (2008), but for many other types of dynamics a complex substrate structure also induces novel and nontrivial dynamical behavior Dorogovtsev et al. (2008); Barrat et al. (2008). This occurs in particular when the pattern of connections is extremely heterogeneous, as in scale-free (SF) networks, where the probability that an element is connected to others (the degree distribution) is given by a power-law form Albert and Barabási (2002).
Along with the recognition that dynamics on networks can be very different from lattices, comes the natural question about how theoretical methods can be adapted to deal with topologically complex substrates. It has been early recognized that the standard mean-field approach must be modified on strongly heterogeneous networks, to take into account the broad variability in the connectivity of vertices Pastor-Satorras and Vespignani (2001). Thus, in the heterogeneous mean-field (HMF) theory Dorogovtsev et al. (2008); Barrat et al. (2008) the order parameter is replaced by a set of analogous quantities which depend explicitly on the degree of the node considered (the degree of a node is the number of other nodes to which it is directly linked). This simple modification turns out to describe with remarkable accuracy the behavior of many systems, reinforcing the naïve expectation that mean-field methods must work on networks, due to their infinite-dimensional nature.
For this reason it came as a surprise when the numerical investigation of the behavior of the contact process (CP) on generic power-law distributed networks gave results in apparent disagreement with the predictions of HMF theory Castellano and Pastor-Satorras (2006). The contact process Harris (1974) is an extremely simple model for spreading, which, in a general network, is defined as follows: Vertices can be in two different states, either empty or occupied. The dynamics includes the spontaneous annihilation of occupied vertices, which become empty at unitary rate, and the occupation of empty neighbors by occupied vertices, with rate , where is the degree of the occupied node. The model is characterized by a phase transition at a value of the control parameter , separating an active phase from an absorbing one, devoid of occupied vertices Marro and Dickman (1999).
In Ref. Castellano and Pastor-Satorras (2006) the HMF theory for CP was derived in the limit of infinite network size. Its predictions could not be directly checked against numerical simulations because of the presence of extremely large finite size effects. A comparison was made possible by the introduction of a finite size scaling (FSS) ansatz Cardy (1988), adapted to a network topology, leading to the conclusion that CP dynamics on quenched networks was not described by the HMF approximation.
Such a claim was criticized by Park and collaborators Ha et al. (2007); Castellano and Pastor-Satorras (2007), which later proposed an alternative FSS ansatz, based on a droplet excitation theory Hong et al. (2007). A discrimination between the two approaches turned out to be nontrivial: Even for simulations on annealed networks, which are expected to be described exactly by mean-field theory, numerical results did not satisfactorily conform to any of the two competing theories Castellano and Pastor-Satorras (2007).
Clarifying results on this issue have been obtained later Castellano and Pastor-Satorras (2008); Boguñá et al. (2009), revealing that FSS on annealed networks is actually more complicated than previously assumed. At odds with what happens in lattices, the behavior of the CP on networks of finite size depends not only on the number of vertices but also on the moments of the degree distribution. This last feature implies, for SF networks, that the scaling around the transition depends explicitly on how the largest degree diverges with . Such a dependence (which both previous FSS approaches were lacking) introduces very strong corrections to scaling. However, if such corrections are properly taken into account, it is possible to show that the CP on annealed networks agrees, with high accuracy, with the predictions of HMF theory Ferreira et al. (2011). A detailed comparison between HMF and precise numerical results for annealed networks has been possible by using the quasi-stationary (QS) state simulation method de Oliveira and Dickman (2005); Dickman and Vidigal (2002). This is an optimized numerical technique which prevents the system from falling into the absorbing configuration, thus allowing the detailed investigation of the order parameter close to the transition for finite systems.
In the present paper, we go beyond the results of Ref. Ferreira et al. (2011) and exploit QS simulations for studying the CP transition on quenched SF networks. We assume that finite size scaling on quenched networks has exactly the same anomalous form valid on annealed ones. In this way we are able to determine, with an unprecedented accuracy, the location of the critical point and the value of the exponents associated with the transition. It turns out that the exponents computed numerically for quenched networks are in excellent agreement with the HMF predictions: The CP on networks definitely obeys heterogeneous mean-field theory. This result fills the gap in the debate about the validity of HMF theory for CP. Both competing theories Castellano and Pastor-Satorras (2006); Hong et al. (2007) were not correct. The apparent discrepancy between theory and numerics reported in Ref. Castellano and Pastor-Satorras (2006) was due to an incorrect FSS theory and the presence of large corrections to scaling in simulations. The alternative FSS approach of Ref. Hong et al. (2007) was incorrect as well. The correct FSS theory is more complicated than previously assumed, but perfectly accounts for numerical results on both annealed and quenched networks.
The present paper is structured as follows: In Section II we describe the quenched networks considered, the contact process dynamics, and the QS simulation method. The numerical determination of the transition point and the associated exponents are presented in Sec. III. Our concluding remarks are discussed in Sec. IV.
II Model and simulation methods
The CP is simulated on quenched networks with vertices and degree sequence . The networks are built according to the configuration model (CM) Molloy and Reed (1995), where the degree of each vertex is defined at the beginning of the simulation as a random variable with a power law distribution and . The degree distribution has a hard degree cutoff (degrees larger than are not allowed), where is the cutoff exponent. This choice reduces sample to sample fluctuations that make the critical analysis difficult even for the simpler case of annealed networks Castellano and Pastor-Satorras (2008); Boguñá et al. (2009); Noh and Park (2009).
Two models for the link assignment are investigated, namely, random and ordered configuration models. In the random CM Catanzaro et al. (2005), two stubs (not connected links) are selected at random and the respective nodes connected, avoiding self and multiple connections. The procedure is repeated until all stubs are joined. In the ordered CM nodes are sorted in descending degree order. Then a stub of the most connected node is connected to another randomly selected stub, avoiding self and multiple connections. After all stubs of the largest vertex are connected, the next most connected node with free stubs is picked up and the procedure is repeated until all stubs are connected. The ordering of nodes allows to build large networks even for , which is usually impossible with random selection of nodes. A consequence of this nonrandom procedure is that disassortative degree correlations are generated Newman (2002).
The CP simulations on an arbitrary network are performed with the standard protocol Marro and Dickman (1999): At each time step, an occupied vertex is chosen at random and time is updated as , where and is the number of occupied vertices at time . With probability , the occupied vertex becomes vacant. With complementary probability , one of its neighbors is randomly selected and, if empty, it becomes occupied. If the selected neighbor is already occupied nothing happens and the simulation proceeds to the next step.
The standard numerical procedure to investigate the finite size scaling at absorbing phase transitions is based on the determination of the average of the order parameter (in this case the density of active nodes), , restricted only to surviving runs. Such a technique is quite inefficient, because surviving configurations are very rare at long times, and in order to get precise results an exceedingly large number of realization of the process is needed. An alternative strategy consists in constraining the system in a quasi-stationary state and measuring its properties. In practice this is implemented by replacing the absorbing state, every time the system tries to visit it, with an active configuration randomly taken from the history of the simulation de Oliveira and Dickman (2005). For this task, a list of active configurations is stored and constantly updated. An update consists in randomly choosing a configuration in the list and replacing it by the present active configuration with a probability . After a relaxation time , the QS quantities are determined during an averaging time . The QS probability that vertices are occupied is computed during the averaging interval, each configuration with active vertices contributing to the QS distribution with a probability proportional to its lifespan, i.e. proportional to . From the particle distribution , the characteristic properties of the QS state can be computed, such as the density of active nodes
| (1) |
and the characteristic relaxation time Dickman and Vidigal (2002); Ferreira et al. (2011)
| (2) |
The QS method, which had been previously used to accurately determine the universality class of several models with absorbing configurations de Oliveira and Dickman (2005); Dickman (2006); de Oliveira et al. (2008), was recently applied to investigate the critical properties of the CP in annealed SF networks Ferreira et al. (2011).
The FSS method for non-equilibrium absorbing phase transitions usually assumes, at the transition, an asymptotic power-law dependence with the system size of the order parameter, , and of the characteristic temporal scale, . Values of the control parameter above and below the critical point give rise to positive and negative curvatures in plots of versus , respectively, for large Marro and Dickman (1999). The CP in annealed networks has a different, anomalous, scaling form Boguñá et al. (2009); Castellano and Pastor-Satorras (2008); Noh and Park (2009) which includes an explicit dependence on the factor . In Ref. Ferreira et al. (2011) the same form was analytically shown to hold on annealed networks for the QS density and characteristic time , namely
| (3) |
The presence of the factor , which can be determined exactly for a given degree distribution , brings an additional dependence on for . Hence, the exponents predicted by HMF theory for the critical properties as a function of are Castellano and Pastor-Satorras (2008):
| (4) | |||||
| (5) |
III Results
The QS simulations are performed on networks with sizes ranging from up to and up to times . The so-called structural () and natural () hard cutoffs Boguñá et al. (2004) are considered. The structural cutoff leads to the absence of degree-degree correlations Boguñá et al. (2004) in the random CM. In this case, the procedure to build the network corresponds to the uncorrelated configuration model (UCM) Catanzaro et al. (2005). On the contrary, the ordered CM has, for , disassortative degree-degree correlations, which are disregarded in the HMF analysis Barrat et al. (2008); Dorogovtsev et al. (2008). The determination of the QS distributions starts after a relaxation time . The dynamics is run for several independent network realizations in order to average over many topological configurations. Between and network samples were used for each value of . It is important to notice that the critical relaxation time is very short when compared to the same quantity for regular lattices below the critical dimension, due to the small world property of complex networks.
III.1 Determination of the critical point
In a quenched network the investigation of the transition is made difficult by the presence of dynamical correlations, which shift the position of the critical point. From the analytical point of view the simplest way to take them into account is by means of a homogeneous pair approximation, which yields Muñoz et al. (2010) .
The criterion of null curvature, usually applied to find numerically the critical point in regular lattices (see Sec. II) was used for the CP on quenched networks Castellano and Pastor-Satorras (2006); Hong et al. (2007). However, as shown for annealed networks Ferreira et al. (2011), such method for estimating the critical point can be misleading if anomalous scaling of the form (3) occurs. Additionally, dynamical analyses like spreading experiments and density decay in time Marro and Dickman (1999) require absence of finite size effects which are unavoidable in random networks with the small world property Watts and Strogatz (1998); Boguñá et al. (2009).
For these reasons, we determine the position of the critical point by analyzing the ratio between moments of the order parameter. The well-known fourth order Binder reduced cumulant is a standard quantity to determine critical points in equilibrium phase transitions on magnetic systems Landau and Binder (2009). At criticality, this cumulant does not depend on size, implying that curves against the control parameter (the temperature in magnetic systems) for different sizes all cross at . More in general, moment ratios defined as
| (6) |
are expected to be size-independent (and thus crossing each other) at the transition. Universal and size-independent moment ratios were studied for absorbing phase transitions in lattice models Dickman and Kamphorst Leal da Silva (1998); Lübeck and Janssen (2005); Sander et al. (2009). The size independence of moment ratios in lattices systems results from the scaling invariance close to the critical point (see e.g., Ref. Henkel et al. (2008) for a recent review). The order parameter in the CP, the density of active vertices, is positive definite and thus, in contrast with the magnetic counterpart for which all odd moments are null due to symmetry, there is no restriction on the values of and that can be considered.

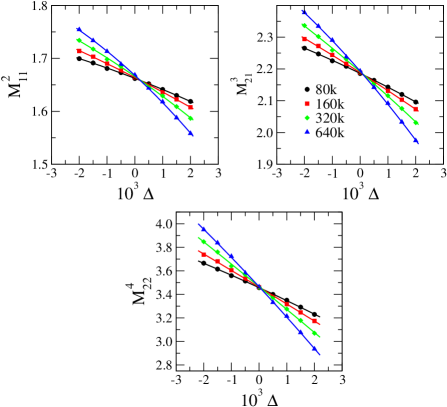
In order to probe the validity of this method for finding the critical point in complex networks, we first determine moment ratios for the CP in annealed SF networks, for which the critical point is exactly known to be Boguñá et al. (2009). Figure 1 shows the moment ratios for CP on annealed networks with degree exponent and different sizes. As observed for macroscopic quantities like density or characteristic time in annealed networks Ferreira et al. (2011), moment ratios also have finite size corrections; the crossing points converge to strictly only for . The convergence is fast, particularly for the higher order moment ratios, which, however, are more susceptible to large statistical fluctuations. For this reason we analyze moment ratios up to fourth order. We find that the crossing points of moment ratios tend to constant values, i.e. independent on the network degree distribution (data not shown). The second order moment ratio is slightly larger than the value 1.660 obtained for CP on the complete graph Dickman and Vidigal (2002). The other moment ratios determined are and , respectively.
In the case of quenched networks, the moment ratios for CP on UCM networks () with and versus the annihilation probability are plotted in Fig. 2. Moment ratios are determined for each network realization, and then averaged over the ensemble of networks considered. The simulation data are very accurate, allowing to clearly resolve the crossing points taking place between and for all moment ratios analyzed (including the third order which is not shown.) As a consequence the critical point position is estimated to be or, equivalently, , where the number in parenthesis represent the numerical uncertainty in the last digit. The critical moment ratios are similarly estimated, yielding the values , and .
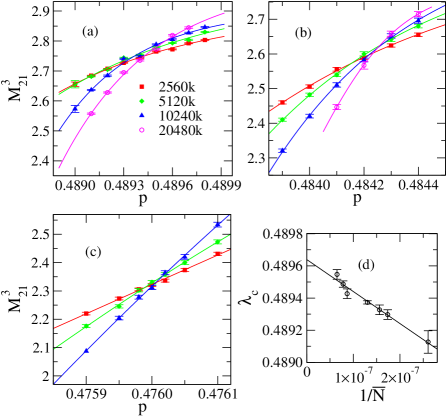
Third order moment ratios for different values of are shown in Fig. 3(a)-(c). We observe that the higher the network heterogeneity, the stronger the finite size effects; thus larger systems are required for small in order to determine the critical point with little uncertainty. The critical points are determined by extrapolating the crossing points between curves corresponding to sizes and against the inverse of the mean size , assuming a functional dependence , as shown in Fig. 3(d) for . The critical points and moment ratios computed for different degree exponents are shown in Table 1. It is worth to stress that if we replace in the FSS by , where is a fit parameter, the estimates vary inside estimated error bars. For the most extreme case, , we obtain and the critical point changes to . Our simulations show that the moment ratio analysis is a very efficient method to determine the critical point of absorbing phase transitions in complex networks. The moment ratios, in opposition to annealed networks, depend now on the degree exponent through an exponential form: As increases, they approach the value of the annealed case. The position of the critical point, on other hand, is remarkably close to the predictions of pair approximation calculations Muñoz et al. (2010) and it approaches the annealed value for when .
| 2.25 | 0.4896(1) | 0.48861 | 1.92(1) | 2.77(3) | 5.1(1) |
| 2.50 | 0.48425(5) | 0.48386 | 1.85(2) | 2.62(4) | 4.7(1) |
| 2.75 | 0.47968(3) | 0.47969 | 1.77(2) | 2.42(4) | 4.10(9) |
| 3.00 | 0.47602(3) | 0.47628 | 1.72(2) | 2.32(3) | 3.81(7) |
| 3.25 | 0.47303(3) | 0.47356 | 1.70(1) | 2.25(2) | 3.60(7) |
| ANN | 1/2 | 1/2 | 1.667(3) | 2.190(4) | 3.452(3) |

III.2 Critical exponents
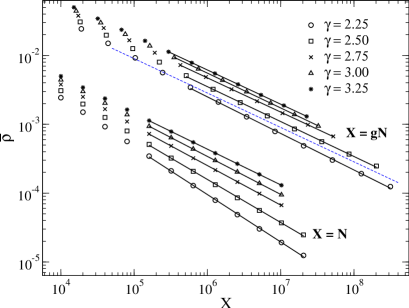
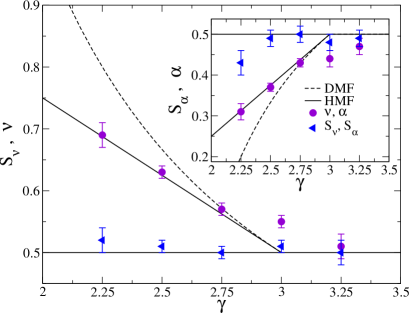
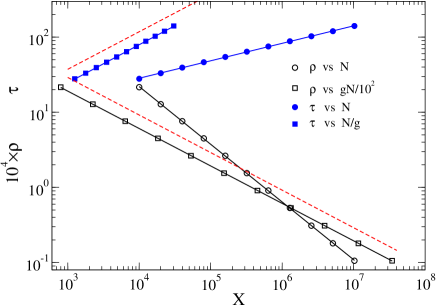
An accurate knowledge of the critical point allows to determine the exponents characterizing the singular behavior at the transition and also to probe the presence of corrections to the scaling. Assuming that Eqs. (3) hold also for quenched networks, we perform a power law regression analysis in the plots of vs and vs , as well as a similar analysis for the characteristic time . Both are shown in Fig. 4. System sizes smaller than are excluded from the regression to avoid subleading corrections to scaling. The exponents obtained numerically as well as the HMF predictions in Eqs. (4) and (5) are shown in Table 2 and Fig. 5.
For , and , the exponents and estimated from a direct power law regressions as a function of are quantitatively consistent with those measured for annealed networks Ferreira et al. (2011) but they are larger and smaller, respectively, than the HMF values. This is due to the fact that HMF exponents [Eq. (5)] are calculated by considering the asymptotic scaling of , . However, the most relevant corrections to scaling
| (7) |
are nonnegligible even for the largest system sizes considered here. Notice that for both and corrections to scaling decay only logarithmically. If instead we perform the regressions and we obtain exponents very close to , in full agreement with the HMF prediction .
| 2.25 | 0.69(2) | 0.6875 | 0.31(2) | 0.3125 | 0.52(2) | 0.43(3) | 1/2 |
| 2.50 | 0.63(1) | 0.6250 | 0.37(1) | 0.3750 | 0.51(1) | 0.49(2) | 1/2 |
| 2.75 | 0.57(1) | 0.5625 | 0.43(1) | 0.4375 | 0.50(1) | 0.50(2) | 1/2 |
| 3.00 | 0.55(1) | 1/2 | 0.44(2) | 1/2 | 0.51(1) | 0.48(2) | 1/2 |
| 3.25 | 0.51(2) | 1/2 | 0.47(2) | 1/2 | 0.49(2) | 0.49(2) | 1/2 |
For , the corrections to the scaling of factor vanish as , the fastest decay in the analyzed range. Both characteristic time and density exponents agree with HMF theory if the factor is explicitly included. If is not included, the exponents still agree with the HFM predictions, due to the fast decay of the correction to scaling in . For , the exponents obtained with a direct power law regression exhibit an excellent agreement with HMF theory, with the exception of the scaling of vs , probably due to finite size effects induced by preasymptotic corrections for the mean degree .
III.3 The natural cutoff
The structural cutoff has been used to investigate dynamical process Castellano and Pastor-Satorras (2010, 2006); Hong et al. (2007) in SF networks because it prevents degree-degree correlations Boguñá et al. (2004) and makes the HMF approach analytically feasible. However, the slow growth of with implies large corrections to the asymptotic scaling Ferreira et al. (2011); Boguñá et al. (2009) and this makes in turn the numerical analysis hard in highly heterogeneous quenched substrates. For this reason we additionally simulate the CP on the ordered configuration model (OCM) described in Sec. II with a hard cutoff . For this cutoff, HMF predicts the critical exponents to be and . We present only the results for highly heterogeneous case with , since the conclusions hold also for other values of . The crossing points in the moment ratio analysis converge faster to the asymptotic value, when compared with the UCM. We find a critical point and moment ratios , , and , which are closer to the HMF predictions than those shown in Table 1 for UCM networks. As can be seen in Fig. 6, the QS quantities exhibit very good scaling properties even for highly heterogeneous networks. The critical exponents obtained by direct power law regressions are and . They differ from the HMF values and , but also in this case the discrepancy is due to the preasymptotic scaling of . Indeed the regressions including the factor yield and , in remarkable agreement with HMF.
This excellent agreement is rather surprising since the HMF exponents are obtained under the hypothesis of no degree-degree correlations Castellano and Pastor-Satorras (2008); Ferreira et al. (2011), while OCM networks are disassortative Boguñá et al. (2004). The present findings suggest that this kind of correlations does not strongly affect the behavior of the CP. Further theoretical investigation is needed to clarify why topological correlations play such a minor role in this problem.
IV Conclusions
In this paper we have investigated the behavior of the contact process on quenched networks with power-law distributed degrees. By performing quasi-stationary simulations we have probed the system behavior in the critical region, obtaining very precise numerical results for both the position of the transition between absorbing and active phases and the associated critical exponents. We have taken advantage of the recent progress in the analytical understanding of the anomalous finite size scaling behavior on annealed networks.
It turns out that the quenched structure of the substrate has little effect on the contact process dynamics. Both the qualitative form of the scaling behavior and the quantitative value of the exponents are the same for quenched and annealed networks. The only, minor, modifications affect the position of the critical point, which is shifted in quenched networks due to dynamical correlations, as well as the values of the moment ratios at criticality, which depend on on quenched networks, while are universal on annealed ones.
The conclusion that can be drawn is that heterogeneous mean-field theory correctly describes (within our error estimates) the critical behavior of the contact process on quenched networks. This conclusion corrects the apparent failure of HMF predictions for CP on quenched networks that was reported some years ago in Ref. Castellano and Pastor-Satorras (2006) With the benefit of hindsight, it is clear now that the puzzling discrepancy found in Castellano and Pastor-Satorras (2006) between HMF and numerical results on quenched networks was not due to subtle effects of the quenched topology, rather to the nontrivial anomalous nature of finite size effects on annealed networks.
Acknowledgements.
This work was partially supported by the Brazilian agencies CNPq and FAPEMIG. S.C.F thanks the kind hospitality at the Departament de Física i Enginyeria Nuclear/UPC. R.P.-S. acknowledges financial support from the Spanish MEC, under project FIS2010-21781-C02-01; the Junta de Andalucía, under project No. P09-FQM4682; and additional support through ICREA Academia, funded by the Generalitat de Catalunya.References
- Callaway et al. (2000) D. S. Callaway, M. E. J. Newman, S. H. Strogatz, and D. J. Watts, Phys. Rev. Lett. 85, 5468 (2000).
- Pastor-Satorras and Vespignani (2001) R. Pastor-Satorras and A. Vespignani, Phys. Rev. Lett. 86, 3200 (2001).
- Arenas et al. (2008) A. Arenas, A. Diaz-Guilera, J. Kurths, Y. Moreno, and C. Zhou, Phys. Rep. 469, 93 (2008), ISSN 0370-1573.
- Dorogovtsev et al. (2008) S. N. Dorogovtsev, A. V. Goltsev, and J. F. F. Mendes, Rev. Mod. Phys. 80, 1275 (2008).
- Barrat et al. (2008) A. Barrat, M. Barthélemy, and A. Vespignani, Dynamical Processes on Complex Networks (Cambridge University Press, Cambridge, 2008).
- Albert and Barabási (2002) R. Albert and A.-L. Barabási, Rev. Mod. Phys. 74, 47 (2002).
- Castellano and Pastor-Satorras (2006) C. Castellano and R. Pastor-Satorras, Phys. Rev. Lett. 96, 038701 (2006).
- Harris (1974) T. E. Harris, Ann. Prob. 2, 969 (1974).
- Marro and Dickman (1999) J. Marro and R. Dickman, Nonequilibrium Phase Transitions in Lattice Models (Cambridge University Press, Cambridge, 1999).
- Cardy (1988) J. L. Cardy, ed., Finite Size Scaling, vol. 2 (North Holland, Amsterdam, 1988).
- Ha et al. (2007) M. Ha, H. Hong, and H. Park, Phys. Rev. Lett. 98, 029801 (2007).
- Castellano and Pastor-Satorras (2007) C. Castellano and R. Pastor-Satorras, Phys. Rev. Lett. 98, 029802 (2007).
- Hong et al. (2007) H. Hong, M. Ha, and H. Park, Phys. Rev. Lett. 98, 258701 (2007).
- Castellano and Pastor-Satorras (2008) C. Castellano and R. Pastor-Satorras, Phys. Rev. Lett. 100, 148701 (2008).
- Boguñá et al. (2009) M. Boguñá, C. Castellano, and R. Pastor-Satorras, Phys. Rev. E 79, 036110 (2009).
- Ferreira et al. (2011) S. C. Ferreira, R. S. Ferreira, and R. Pastor-Satorras, Phys. Rev. E 83, 066113 (2011).
- de Oliveira and Dickman (2005) M. M. de Oliveira and R. Dickman, Phys. Rev. E 71, 016129 (2005).
- Dickman and Vidigal (2002) R. Dickman and R. Vidigal, J. Phys. A: Math. Gen. 35, 1147 (2002).
- Molloy and Reed (1995) M. Molloy and B. Reed, Random Struct. Algorithms 6, 161 (1995).
- Noh and Park (2009) J. D. Noh and H. Park, Phys. Rev. E 79, 056115 (2009).
- Catanzaro et al. (2005) M. Catanzaro, M. Boguñá, and R. Pastor-Satorras, Phys. Rev. E 71, 027103 (2005).
- Newman (2002) M. E. J. Newman, Phys. Rev. Lett. 89, 208701 (2002).
- Dickman (2006) R. Dickman, Phys. Rev. E 73, 036131 (2006).
- de Oliveira et al. (2008) M. M. de Oliveira, S. G. Alves, S. C. Ferreira, and R. Dickman, Phys. Rev. E 78, 031133 (2008).
- Boguñá et al. (2004) M. Boguñá, R. Pastor-Satorras, and A. Vespignani, Eur. Phys. J. B 38, 205 (2004).
- Muñoz et al. (2010) M. A. Muñoz, R. Juhász, C. Castellano, and G. Ódor, Phys. Rev. Lett. 105, 128701 (2010).
- Watts and Strogatz (1998) D. J. Watts and S. H. Strogatz, Nature 393, 440 (1998).
- Landau and Binder (2009) D. Landau and K. Binder, A Guide to Monte Carlo Simulations in Statistical Physics (Cambridge University Press, New York, NY, USA, 2009), 3rd ed.
- Dickman and Kamphorst Leal da Silva (1998) R. Dickman and J. Kamphorst Leal da Silva, Phys. Rev. E 58, 4266 (1998).
- Lübeck and Janssen (2005) S. Lübeck and H.-K. Janssen, Phys. Rev. E 72, 016119 (2005).
- Sander et al. (2009) R. S. Sander, M. M. de Oliveira, and S. C. Ferreira, J. Stat. Mech. Theor. Exp. 2009, P08011 (2009).
- Henkel et al. (2008) M. Henkel, H. Hinrichsen, and S. Lübeck, Non-equilibrium phase transition: Absorbing Phase Transitions (Springer Verlag, Netherlands, 2008).
- Castellano and Pastor-Satorras (2010) C. Castellano and R. Pastor-Satorras, Phys. Rev. Lett. 105, 218701 (2010).