XMM-Newton observations of the supergiant fast X-ray transients XTE J1739-302, IGR J08408-4503 and IGR J18410-0535
Abstract:
We report here on the XMM-Newton observations of the three supergiant fast X-ray transients (SFXT) XTE J1739-302, IGR J08408-4503, and IGR J18410-0535. For the latter source we only discuss some preliminary results of our data analysis. Some interpretation is provided for the timing and spectral behavior of the three sources in terms of the different theoretical models proposed so far to interpret the behavior of the SFXTs.
1 Introduction
Supergiant fast X-ray transients are a subclass of supergiant X-ray binaries (SgHMXBs) which gained in the past few years a great interest due to their peculiar behavior in the X-ray domain (see, e.g., Walter & Zurita Heras, 2007). The few-hours long outbursts displayed by these sources have been so far attributed to the presence of a NS accreting matter from the extremely clumpy wind of its supergiant companion (these clumps are expected to be a factor 104-105 denser than the homogeneous stellar wind; see e.g., Walter & Zurita Heras, 2007). Numerical simulations of supergiant star winds indicate that such high density clumps might results from instabilities in the wind (Oskinova et al., 2007). Bozzo et al. (2008) proposed that the X-ray variability of the SFXT sources might be driven by centrifugal and/or magnetic “gating” mechanisms, that can halt most of the accretion flow during quiescence, and only occasionally permit direct accretion onto the NS. The properties of these gating mechanisms depend mainly on the NS magnetic field and spin period. At odds with the extremely clumpy wind model, in the gating scenario a transition from the regime in which the accretion is (mostly) inhibited to that in which virtually all the captured wind material accretes onto the NS requires comparatively small variations in the stellar wind velocity and/or density, and can easily give rise to a very large dynamic range in X-ray luminosity. Yet another model was proposed for IGR J11215-5952, so far the only SFXT which displays regular periodic outbursts; this model envisages that the outbursts take place when the NS in its orbit crosses a high density equatorial region in the supergiant’s wind (Sidoli et al., 2007).
The XMM-Newton observations that we report on this paper were carried out in order to study the quiescent emission of the SFXT sources and gain further insight on the mechanism that drives their peculiar X-ray activity.
2 XMM-Newton data analysis
For the present study we used two XMM-Newton observations of XTE J1739-302, one XMM-Newton observation of IGR J08408-4503, and one observation of IGR J18410-0535.
The analysis of the XMM-Newton data was carried out by using standard techniques and the version 9.0 of the XMM-Newton Science Analysis System (SAS). We refer the reader to Bozzo et al. (2010) for more details.
2.1 XTE J1739-302
XMM-Newton observed XTE J1739-302 twice, on 2008 October 1 (hereafter OBS1) and on 2009 March 11 (hereafter OBS2). The Epic-PN camera was operated in large window mode in the first case and in small window mode during the second observation. After the selection of the good time intervals was applied, we obtained a total effective exposure time of 32 ks and 24 ks for OBS1 and OBS2, respectively.


From the lower panels in Fig. 1, it is apparent that the source emission hardened for higher count rates. A rate resolved analysis carried out during the time intervals in which the source count-rate was , 0.1-0.4, and 0.4 (0.2-15 keV) showed that the hardening of the spectrum with the source count-rate was due mostly to a change in the cut-off power-law (CUTOFFPL) photon index index (from 1.0 to 1.8; we fixed the cut-off energy at 13 keV Sidoli et al., 2009), rather than to variation of the absorption column density (consistent with being constant at a level of 2.61022 cm-2). The spectra extracted by using the entire exposure time of the OBS1 and OBS2, were only poorly fit by a simple absorbed CUTOFFPL model. These fits gave /dof=1.2/175, 1.2/184, for OBS1 and OBS2, respectively. We measured in the two cases, photon indices of 1.30.1 and 1.190.07 and absorption column densities =(2.7)1022 cm-2, (3.40.2)1022 cm-2. The corresponding 0.5-10 keV X-ray fluxes were (2.5)10-12 erg/cm2/s and (3.9)10-12 erg/cm2/s.


The addition of a thin thermal component (MEKAL in Xspec; hereafter MKL) below 2 keV significantly improved the fits and in the OBS1, where the detection of this soft spectral component appeared to be more significant, we estimated a temperature of the plasma of 0.150.02 keV and a normalization of 0.3. We checked that a similar fit to the spectrum of the OBS2 would give similar results for this spectral component. The unfolded spectrum of OBS1 is shown in Fig. 2.
2.2 IGR J08408-4503
XMM-Newton observed IGR J08408-4503 on 2007 May 29, with the Epic-PN camera operating in full frame. After the selection of the good time intervals was applied, we obtained a total effective exposure time of 26 ks. A similar analysis to that described in Sect. 2.1 performed on the data from this source revealed an analogous behavior to that observed previously in XTE J1739-302. From Fig. 1 (left panel), we noticed that the hardness ratio of IGR J08408-4503 increased with the source count rate. The rate-resolved spectra, selected by using the time intervals in which the source count-rate was 0.2, 0.1-0.2, and 0.1, reveled that in this case a simple absorbed CUTOFFPL was insufficient to appropriately describe the data. The addition of a MKL component below 2 keV significantly improved these fits. In the three spectra, the measured absorption column density was consistent (to within the errors) with being constant at a level of 0.71022 cm-2, whereas the PL photon index showed a significant change decreasing from 1.6 to 1.1 at the higher source emission level. The soft spectral component did not show any significant variation with the source intensity. We measured a temperature of 0.2 keV and a normalization of 10-3. Similar values for the spectral parameters were obtained from the fit to the spectrum of IGR J08408-4503 extracted by using the total exposure time of the XMM-Newton observation. This spectrum is shown in Fig. 2 (right panel).
2.3 IGR J18410-0535
XMM-Newton observed IGR J18410-0535 starting on 2010 March 15 for about 45 ks. The Epic-pn camera was operating in full frame, while the Epic-MOS1 and Epic-MOS2 cameras were operating in small window and timing mode, respectively. During this observation, IGR J18410-0535 underwent a bright X-ray flare that started about 5 ks after the beginning of the observation and lasted for 15 ks. The lightcurve of the entire XMM-Newton observation in the 0.3-12 keV energy band is shown in Fig.3 (left panel). Given the high dynamic range in the X-ray flux of the source we did not attempt to extract a single spectrum by using the total exposure time available.
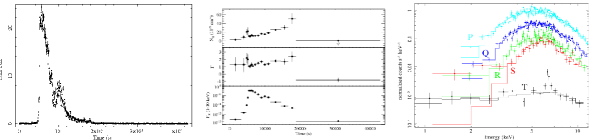
Instead we divided the XMM-Newton observation in 18 time intervals and perform a preliminary fit to the data by using an absorbed power-law (PL) model. The results of these fits are reported in Fig. 3 (middle panel). From this figure we noticed that the PL photon index remained fairly constant up to T19000 s, whereas the absorption column density underwent dramatic changes. Particularly puzzling is the evolution of the source X-ray spectrum during the latest 20 ks of observation. This is show in Fig. 3 (right panel). In this figure the P, Q, R ,S and T spectra are extracted using the time intervals T=10420-11520 s, T=11520-14520 s, T=14520-16620 s, T=16620-18870 s, and T=18870-42840 s, respectively. During the time interval corresponding to the spectrum T, the properties of the X-ray emission from IGR J18410-0535 changed abruptly. The photon index of the PL flattened and a prominent emission line at 6.4 keV clearly emerged from the data. A more refined analysis is currently ongoing to understand deeply the nature of the spectral changes measured during the X-ray flare. We provide a preliminary interpretation of these results in Sec. 3.
3 Discussion
We have presented four deep pointed XMM-Newton observations of the SFXTs XTE J1739-302, IGR J08408-4503 and IGR J18410-0535.
The first two sources exhibited a very similar behavior. Our spectral and timing analysis revealed that both sources were characterized by a pronounced variability on time-scales of the order of few thousands of seconds. During the XMM-Newton observation XTE J1739-302 and IGR J08408-4503 displayed a number of low-intensity flares, taking place sporadically from a lower persistent emission level. The typical duration of these flares is a few thousands of seconds, and their X-ray flux is a factor of 10-30 higher than the persistent quiescent flux. Taking into account the fluxes measured during the brightest outbursts (See Sect. 1), the total dynamic range of these two sources is 104.
The hardness intensity diagrams of XTE J1739-302 and IGR J08408-4503, together with the results of the rate resolved analysis carried out in Sect. 2, showed that the variations in the X-ray flux measured during the XMM-Newton observations were accompanied in both cases by a change in the spectral properties of the sources. In particular we noticed that the source hardness ratios were increasing significantly with the X-ray flux. A fit to the rate-resolved spectra with a CUTOFFPL model revealed that this behavior originates from a change in the CUTOFFPL photon index, , rather than in a variation of the absorption column density. These results indicate that the timing and spectral variability of the two sources during the quiescence is qualitatively similar to that observed during the outbursts (see Sect. 1). Since most of the X-ray emission from these sources is produced by the accretion of matter onto the NS (Bozzo et al., 2010), then the accretion process in these sources takes place over more than 4 orders of magnitude in the X-ray luminosity.
The properties of the soft component dominating the X-ray spectrum of IGR J08408-4503 and XTE J1739-302 below 2 keV could be reasonably well constrained in the former source, where the absorption column density was relatively low (1022 cm−2), whereas in the case of XTE J1739-302 the detection of this component was less significant. However, the similarity in the timing and spectral behavior observed in the quiescent state of the two sources argued in favor of adopting the same spectral model for both of them. We suggested that a MKL component provide a reasonable description of the data, as it would represent the contribution to the total X-ray emission of the shocks in the wind of the supergiant companion. The results of the fits with this model to the data of the three observations inferred a temperature of the MKL component and an emitting region comparable with the values found also in the case of the SFXT AX J1845.0-0433 (Zurita-Heras & Walter, 2009). Similar soft spectral components have been detected in many other HMXBs and SGXBs. In a few cases, the detection of a number of prominent emission lines in the high resolution X-ray spectra of these sources carried out with the gratings onboard Chandra and the RGS onboard XMM-Newton (see e.g., Watanabe et al., 2006) have convincingly demonstrated that these components are produced by the stellar wind around the NS, and proved to be a powerful diagnostic to probe the structure and composition of the stellar wind in these systems. The statistics of the present XMM-Newton observations is far too low to permit a similar in-depth study of the stellar wind in the case of XTE J1739-302 and IGR J08408-4503, and further longer X-ray observations of these sources are probably required in order to firmly establish the nature of the soft spectral components in the quiescent emission of the SFXT sources.
IGR J18410-0535 underwent a bright X-ray flare during the XMM-Newton observation, and we reported here some preliminary results of the analysis of these data. The time-resolved spectral analysis reported in Sect. 2.3 showed that during this event the absorption column density of the X-ray emission from the source displayed dramatic changes, whereas the PL photon index remained virtually constant up to 19000 s. These results suggest that the event might have been caused by the accretion of a massive clump, similar to the case of IGR J17544-2619 (Rampy et al., 2009). A major change in the spectral properties of the source occurred during the latest 20 ks of observation, in which our analysis revealed an abrupt flattening of the PL photon index and the emergence of a prominent iron-line at 6.4 keV. This spectral transition might indicate that at the end of the flare IGR J18410-0535 underwent some kind of obscuration event, similar to what was observed previously in the case of IGR J16479-4514 (Bozzo et al., 2008b). A more refined XMM-Newton data analysis is currently ongoing in order to understand deeply the origin of the flare recorded from IGR J18410-0535.
References
- Bozzo et al. (2008) Bozzo, E., Falanga, M., Stella, L. 2008, ApJ, 683, 1031
- Bozzo et al. (2008b) Bozzo, E., Stella, L., M., Israel, G., Falanga, Campana, S. 2008, MNRAS, 391, 108
- Bozzo et al. (2010) Bozzo, E., et al. 2010, A&A, 519, 6
- Oskinova et al. (2007) Oskinova, L.M., Harmann, W.R., Feldmeier, A. 2007, A&A, 476, 1331
- Rampy et al. (2009) Rampy, R.A., Smith, D.M., Negueruela, I. 2009, ApJ, 707, 243
- Sidoli et al. (2007) Sidoli, L., et al. 2007, A&A, 476, 1307
- Sidoli et al. (2009) Sidoli, L., et al. 2009, ApJ, 690, 120
- Zurita-Heras & Walter (2009) Zurita Heras, J.A. & R. Walter 2009, A&A, 494, 1013
- Walter & Zurita Heras (2007) Walter, R. & Zurita Heras, J. A. 2007, A&A, 476, 335
- Watanabe et al. (2006) Watanabe, S., Sako, M., Ishida, M., and et al. 2006, ApJ, 651, 421