Subsurface magnetic field and flow structure of simulated sunspots
Abstract
We present a series of numerical sunspot models addressing the subsurface field and flow structure in up to Mm deep domains covering up to 2 days of temporal evolution. Changes in the photospheric appearance of the sunspots are driven by subsurface flows in several Mm depth. Most of magnetic field is pushed into a downflow vertex of the subsurface convection pattern, while some fraction of the flux separates from the main trunk of the spot. Flux separation in deeper layers is accompanied in the photosphere with light bridge formation in the early stages and formation of pores separating from the spot at later stages. Over a time scale of less than a day we see the development of a large scale flow pattern surrounding the sunspots, which is dominated by a radial outflow reaching about of the convective rms velocity in amplitude. Several components of the large scale flow are found to be independent from the presence of a penumbra and the associated Evershed flow. While the simulated sunspots lead to blockage of heat flux in the near surface layers, we do not see compelling evidence for a brightness enhancement in their periphery. We further demonstrate that the influence of the bottom boundary condition on the stability and long-term evolution of the sunspot is significantly reduced in a Mm deep domain compared to the shallower domains considered previously.
Subject headings:
Sun: surface magnetism – sunspots – MHD – convection1. Introduction
The subsurface structure of sunspots has been of subject of theoretical investigations for several decades. The two possible extremes of magnetic configurations were discussed by Parker (1979): a monolithic configuration vs. a clusters of individual flux tubes that is kept together by converging flows in a suitable depth. On the observational side evidence is inconclusive. Direct helioseismic measurements of the magnetic field structure with an accuracy to determine the differences between monolithic and cluster models are currently out of reach. More promising are measurements of the subsurface flow structure, but also there results are inconclusive. Time distance inversions by Zhao et al. (2001, 2010) point toward inflows around sunspots in an intermediate depth range from about to Mm (and corresponding downflows underneath sunspots), which would be consistent with the expectations from a cluster model. On the other hand recent inversions presented by Gizon et al. (2009, 2010b) show outflows in the upper most Mm.
At photospheric levels most sunspots are surrounded by large scale outflows (called “moat flows”) with amplitudes of a few ms-1 that were first found through tracking of magnetic features (Sheeley, 1969; Harvey & Harvey, 1973), Doppler measurements (Sheeley, 1972) and later helioseismic measurements (Gizon et al., 2000). Several recent investigations focused on possible connections between the Evershed flow and moat flow (see e.g. Sainz Dalda & Martínez Pillet, 2005; Cabrera Solana et al., 2006; Vargas Domínguez et al., 2008; Zuccarello et al., 2009; Vargas Domínguez et al., 2010), so far the observational evidence is not clear enough to either proof or disproof a connection.
The subsurface field and flow structure has been also addressed through means of numerical models. 2D axisymmetric models by Hurlburt & Rucklidge (2000), Botha et al. (2006), and Botha et al. (2008) show large scale flow patterns around sunspots. The typical result is a converging collar flow in the proximity of the spot and a diverging flow further out, a situations which is essentially in agreement with the cluster model as well as the inversions by Zhao et al. (2001, 2010). Recently Botha et al. (2011) expanded this work to 3D and found comparable results with regard to the axisymmetric flow components. Differences occurred with regard to the process of sunspot decay: the azimuthal cell structure allows for flux to escape from the central flux concentration even if the average flow is converging. At this point neither the 2D axisymmetric nor the 3D simulations contain a penumbra and the connection of the larger scale deep seated flows to photospheric flows remains an open question.
Over the past five years there has been a substantial progress in 3D MHD models that include a realistic equation of state and radiative transfer. Owing to the wide range of length and time scales involved in sunspot structure and evolution it is currently not possible to address all aspects of sunspot structure and evolution in a single numerical simulation. The formation, evolution and decay of pore-size flux concentrations has been modeled by Bercik et al. (2003); Cameron et al. (2007); Kitiashvili et al. (2010), typically resulting in converging flows in the proximity of the pore. The focus of recent numerical models such as Schüssler & Vögler (2006), Heinemann et al. (2007), Rempel et al. (2009b), and Kitiashvili et al. (2009) was primarily the sunspot fine structure and origin of the Evershed flow. To this end those models focused on smaller subsections and rather short temporal evolution of a few hours. The simulations by Rempel et al. (2009a); Rempel (2010, 2011) were the first MHD simulations with a sufficient domain size in the horizontal direction to capture complete sunspots, while still resolving sunspot fine structure. However, the vertical domain size of Mm remained still too shallow and the overall time evolution of up to 6 hours too short to properly address the subsurface structure of the sunspot as well as development of moat flows. While these simulations present a unified picture for the magneto convective origin of sunspot fine structure they leave several fundamental aspects with regard to the subsurface structure unanswered.
Evidence for a larger scale diverging flow is already present in the simulations of Heinemann et al. (2007), Rempel et al. (2009b), Rempel et al. (2009a), and Rempel (2011), but the overall development of this flow pattern was heavily influenced by either the domain size or the rather short time span covered. We will relax most of these constraints in this investigation by focusing on numerical simulations with lower resolution, but deeper domains (up to 16 Mm) and much longer temporal evolution (up to 2 days). Simulations in deeper domains are less influenced by the bottom boundary condition and allow us to study processes related to the fragmentation of sunspots and development of large scale flow patterns.
In Sect. 2 we describe the setup of the numerical simulations used in this investigation. Sect. 3 presents the time evolution and structure of the subsurface magnetic field and flow structure. The influence of the (unfortunately unavoidable) bottom boundary condition is analyzed in Sect. 4, the findings are discussed in Sect. 5 and summarized in Sect. 6.
2. Numerical models
The details of the numerical model and underlying physics are described in Vögler et al. (2005) and Rempel et al. (2009b). Models presented here use a setup similar to those of Rempel et al. (2009a), but differ in domain size, resolution as well as boundary conditions.
We report here on a series of numerical simulations which were performed in a computational domain with a horizontal extent of Mm and a vertical extent of Mm. We used a rather low resolution of km horizontally and km vertically to allow for long simulation runs covering up to 2 days of solar time. The simulations were started from a non-magnetic convection simulation, which was evolved for hours to allow for thermal relaxation of the stratification. We then inserted into the domain an axisymmetric, self-similar sunspot with Mx flux and a field strength of kG at the bottom of the domain. While the domain is periodic in the horizontal direction, the top boundary is closed for the vertical mass flux and slip free for horizontal motions. The magnetic field is matched to a potential field extrapolation. At the bottom boundary the magnetic field is vertical and we consider here two formulations with regard to flows. The first boundary condition sets all velocity components to zero in regions where the field strength exceeds 5 kG, while it allows for convective motions to cross the bottom boundary everywhere else: in outflow regions all velocity gradients are set to zero and thermodynamic variables are extrapolated into the ghost cells while inflows have purely vertical velocities and a prescribed entropy to maintain the solar energy flux. The second boundary condition is an open boundary everywhere in the domain regardless of the magnetic field strength. In contrast to the first boundary condition we set the gradient of all mass flux components to zero, allowing also for horizontal flows in inflow regions (a zero gradient of the horizontal flow velocity instead of mass flux turns out to be unstable on long time scales). While the first boundary condition strongly suppresses the decay of the sunspot by limiting the motions at the foot point, the second boundary allows for horizontal exchange between magnetized and unmagnetized regions as well as vertical flows changing the mass content of the sunspot. Note that the first boundary condition does not allow for heat flux entering the domain in strong field regions, while in the second case heat exchange is not prohibited by the boundary, although in general still strongly suppressed by the magnetic field. In both cases the energy radiated away in the sunspot umbra comes mostly from the heat content of the stratification, i.e., the umbra and stratification underneath slowly cool down as the simulation progresses. The most dramatic temperature changes happen during the first few hours of the simulations, later most of the energy comes from several Mm deep layers, where the heat capacity is sufficiently large to prevent strong temperature changes. A similar behavior is also found in simpler models such as Schüssler & Rempel (2005).
In the following discussion we focus first on the simulation with the closed boundary condition in strong field regions, which leads to an overall more stable sunspot. We contrast these results with simulations using the second boundary condition in Sect. 4.
We present in addition results from a simulation in a Mm wide and Mm deep domain at a resolution of km horizontally and km vertically, which was evolved for a total of hours. In this simulation we use a different top boundary condition, which enforces a more inclined magnetic field than the previous cases using a potential field. To this end we enhanced the horizontal field components by a factor of 2 compared to a potential field extrapolation. Together with the higher resolution this boundary leads to a stable extended penumbra with average Evershed flows of about . The bottom boundary is closed in the inner most Mm to prevent decay of the sunspot. The total flux of this sunspot is again Mx, the field strength at the bottom boundary is kG. We will present results from this simulation with regard to axisymmetric mean flows and compare them to the previously mentioned simulation runs to investigate the influence of penumbra and Evershed flow on large scale flows surrounding sunspots. For a more detailed description of this simulation run and a series of simulations with the different top boundary condition we refer to a separate forthcoming publication.
3. Results
3.1. Temporal evolution of subsurface magnetic field
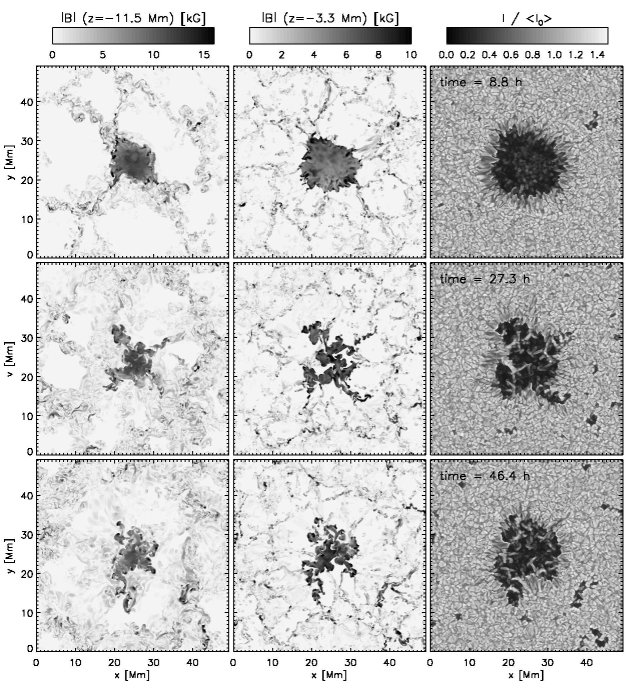
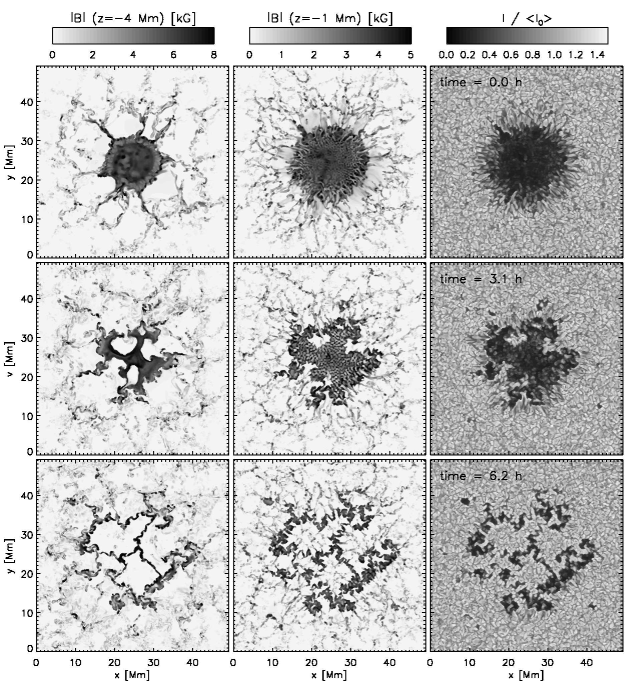
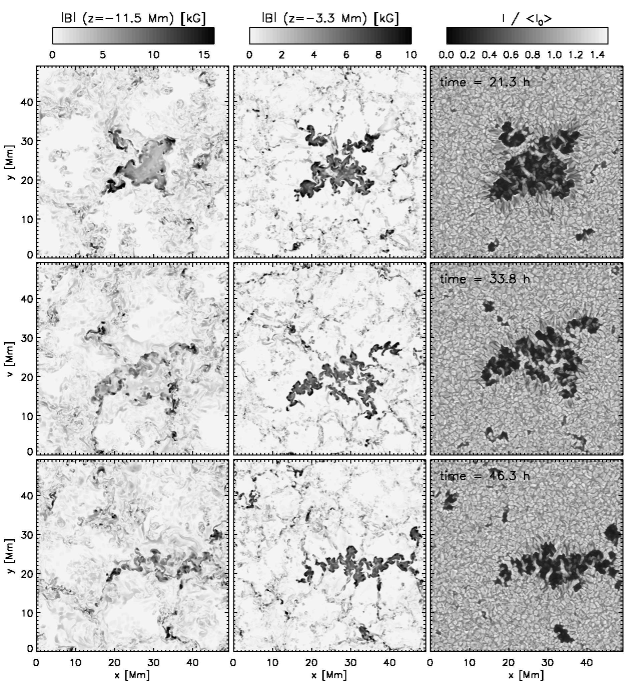
Figure 1 highlights the connection between the temporal evolution of the subsurface magnetic field and appearance of the sunspot in the photosphere. The corresponding subsurface flow structure is presented in Figure 2 and discussed further in section 3.2. The left and middle column show the magnetic field strength at a depth of and Mm beneath the level of the plage region surrounding the sunspot. The right column presents the surface intensity (gray intensity for vertical direction). We show top to bottom 3 time steps about 18 - 19 hours apart. The sunspots starts as a circular sunspot due to our initial condition, but is changing its shape substantially throughout the simulated time span of about 2 days. Several Mm beneath the photosphere most of the magnetic flux is collected into a downflow vertex (in about Mm depth the intrinsic scale of convection becomes larger than the diameter of the sunspot at that depth), while some of the magnetic flux separates from the main trunk along downflow lanes connecting to the vertex. A qualitatively similar picture of sunspot decay was also found in the recent 3D simulation of Botha et al. (2011). The flux separation driven by convective motions in deeper layers becomes manifest in the photosphere as light bridges in the earlier stages and pores separating from the main spot during the later stages. While light bridges have a photospheric appearance very similar to penumbral filaments, their origin is of fundamentally different nature. As shown by Schüssler & Vögler (2006), Rempel et al. (2009b) and Rempel et al. (2009a) umbral dots and penumbral filaments originate from magneto-convection in strong magnetic field. The observed reduction of field strength in these features is a consequence of overturning convection and does not require the intrusion of “field free” plasma from beneath or outside the sunspot. The magneto-convective motions responsible for these structures are concentrated in the upper most km beneath the photosphere. In contrast to this light-bridges are the consequence of almost field free plasma entering from beneath and the associated structure is deep reaching (several Mm). A good example is the snapshot at hours shown in Figure 1. The light-bridge entering the sunspot from the left side is clearly visible as an intrusion of field free plasma in Mm depth and even the field in Mm depth shows a similar signature. While narrow light bridges show the formation of a dark lane in their center (above the central upflow), wider light bridges break down into several granulation like convection cells. Good examples for the latter are present starting from hours in the animation provided for Figure 1 in the online material. Light bridges with similar properties were also found in the simulations of Cheung et al. (2010).
As a byproduct of the sunspot decay we find several pores surrounding the sunspot. The pores show a wide spread in life times and we see a very strong indication that the depth extent of the subsurface magnetic field structure is the most relevant factor determining their temporal evolution. Pores such as those found in the lower right corner of the snapshot at hours in Figure 1 are connected to layers deeper than Mm and are visible in the photosphere for almost 24 hours.
3.2. Temporal evolution of subsurface velocity field
Recently Rempel et al. (2009a) presented a numerical simulation including an extended penumbra and Evershed flows with average flow amplitudes faster than . Requirements for obtaining these results where a sufficiently high resolution to resolve penumbral filaments and the proximity of an opposite polarity spot leading to more horizontal magnetic field. In the simulations we discuss here we focus on an individual sunspot and our horizontal grid resolution is 96 km instead of 32 km. Under these circumstances we do not obtain a penumbra and near surface flows are converging toward the spot with a velocity of several . A similar behavior is observed near pores, where the granules at the periphery of the umbra lead to a converging flow pattern (Wang & Zirin, 1992; Sobotka et al., 1999). A converging flow was also found in MHD simulations of a pore by Cameron et al. (2007). We focus in the following discussion on large scale flows in the deeper domain, which develop on time scales of several hours to days.
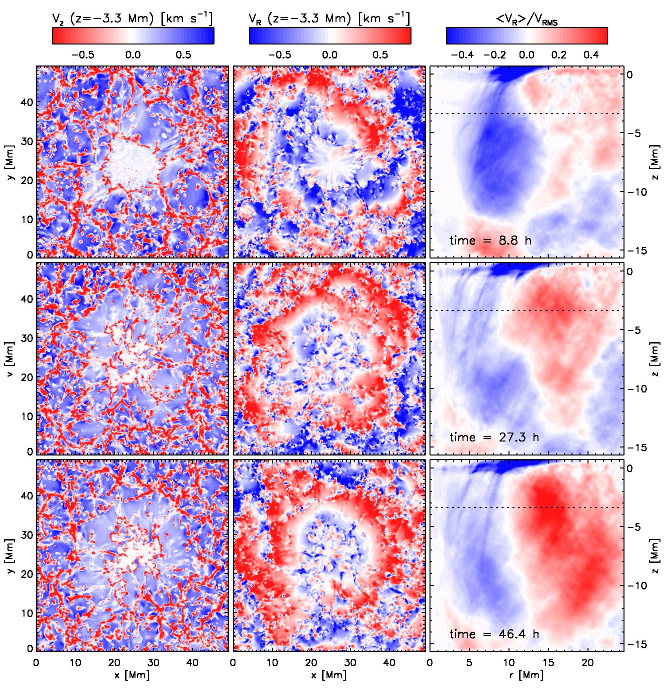
Figure 2 presents the time evolution of the subsurface flow field for the same time steps shown in Figure 1. The two columns on the left show vertical and radial velocity (with respect to the approximate center of the spot) in a depth of Mm, which corresponds to the magnetic field evolution shown in the middle column of Figure 1. Here, and throughout this paper, upflows are represented by positive values and blue colors, outflows are represented by positive values and red colors. The right column presents azimuthal averages of the radial flow velocity as function of distance from the spot center (horizontal axis) and depth (vertical axis). Since convective flow velocities vary quite substantially in a Mm deep domain from a few near the base to a few in the photosphere, we normalize here the azimuthal flow velocity by the convective rms velocity at the corresponding depth (averaged over the region outside the sunspot). Over time we see the development of a radial mean flow with a weak inflow close to the sunspot and a large scale outflow in the region Mm. Toward the end of the simulation run the azimuthally averaged outflow reaches an amplitude of about of the convective rms velocity, while the inflow reaches values around (faster flows are found in the photosphere). Furthermore we see a strong trend of declining inflow and increasing outflow amplitude over time. The presence of the sunspot leads over time to a ring-like arrangement of convection cells in the periphery of the spot, which was already found in the more shallow simulation of Rempel et al. (2009a); Rempel (2011) and the idealized simulations of Botha et al. (2011). The result is a ring of upflowing material with overall reduced vertical flow velocity and fewer downflow lanes relative to convection further away from the sunspot (left column). The radial flow patterns (middle and right column) shows a converging flow in the proximity of the spot and a diverging flow further out. At earlier time steps the large scale flows near the bottom of the domain are less pronounced since the re-arrangement of the convection pattern requires several turn-over time scales and the latter increases substantially with depth. For example, the quantity is about 1 hour in the middle of the domain, but 6-8 hours near the bottom of the domain.
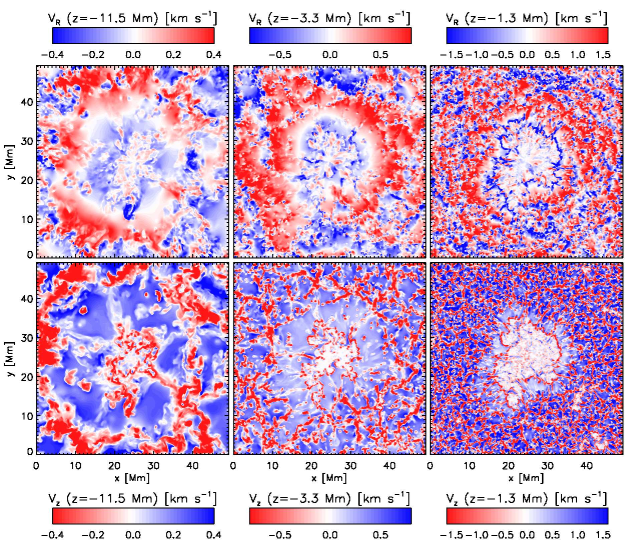
Figure 3 shows for a single time step ( hours) vertical and radial flow velocity for the depth levels of , and Mm. The ring-like arrangement of convection cells is present at all depth levels shown, the scale of the resulting large scale flow patterns is increasing with depth as the intrinsic scale of convection is increasing proportional to the pressure scale height. This tendency is also manifest in the azimuthal average of the radial flow velocity toward the end of the simulation run (see Figure 2 for hours).
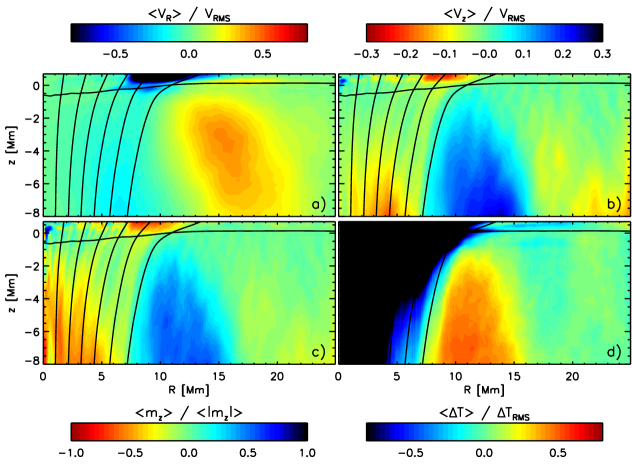
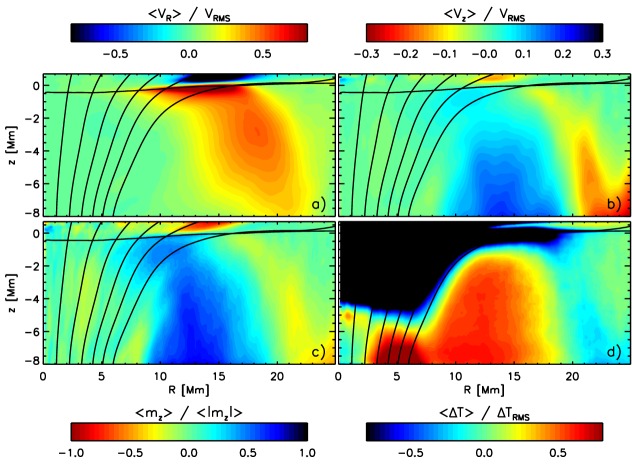
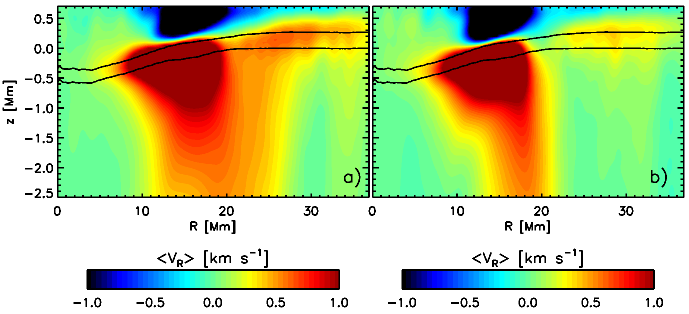
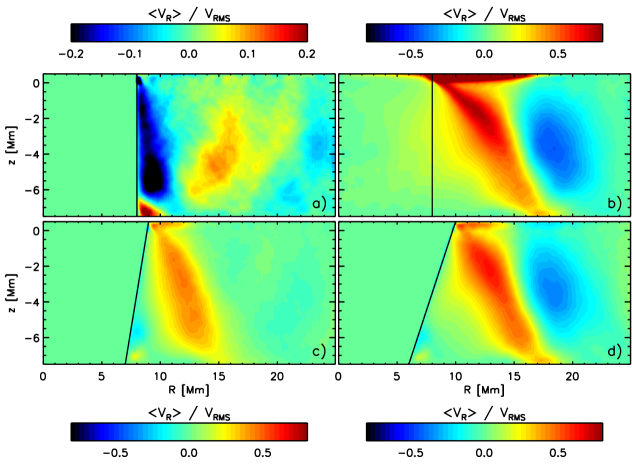
To analyze the large scale flows in more detail we focus now on long-term time averages of the azimuthally averaged radial and vertical flow velocity, mass flux and temperature perturbations. To this end we averaged 19 snapshots between and hours (about 50 minute cadence). The result is presented in Figure 4. Velocities are normalized by the convective rms velocity, the temperature fluctuation is defined relative to the mean stratification, both, rms velocity and reference stratification are computed from the region surrounding the sunspot near the edges of the computational domain. We indicate the extent of the sunspot through field lines of the azimuthally averaged field. The outermost field line encloses Mx flux. We contrast this result with a sunspot that has an extended penumbra and Evershed flows reaching more than on average in Figure 5 (see description in Sect. 2 for details). All quantities are the same as in Figure 4, except for the outermost field line which encloses Mx flux. Note that both simulations have different domain sizes ( Mm3 in Figure 4 and Mm3 in Figure 5). We present a common subsection in both figures for better comparison. Figure 5 presents a hour average from to hours, an intensity image at hours for this simulation is presented in Figure 10.
In both cases (Figure 4: sunspot without penumbra; Figure 5: sunspot with penumbra) the dominant feature is a deep reaching outflow region surrounding the spot with radial mean velocities of about (panels a). The corresponding large scale upflow (panels b) coincides with a large scale temperature enhancement of about (panels d), indicating a thermal signature typical for a convective flow pattern. The amplitude of the radial flow as well as thermal signature is larger for the sunspot with penumbra. The same is also true for the fraction of the overturning mass flux found in the azimuthal mean component (panels c) which is about () for the sunspot without (with) penumbra in Mm depth.
The most obvious difference between both sunspot models are present in photospheric layers along the indicated level (see also Figure 6 for further detail): in absence of a penumbra we find a converging flow for Mm and a diverging flow further out; in presence of a penumbra radial outflows are found everywhere in the photosphere. In absence of a penumbra the converging flow shows a downward extension in the proximity of the sunspot, which disappears in the presences of a penumbra: radial outflows are found at all depth levels. As a consequence we do not find a situation in which a shallow Evershed flow is stacked on top of an inflow cell deeper down as it has been suggested by some helioseismic inversions (Zhao et al., 2010).
Note that in Figure 4 downflows appears to be located within the sunspot, which is caused by the azimuthal averaging: the flow patterns presented in Figs. 2 and 3 clearly show that downflows are located at the periphery of the highly fragmented subsurface magnetic field structure. The conspicuous temperature enhancement present in Figure 5d) at the bottom boundary near Mm is a consequence of our boundary condition, which keeps the magnetic field fixed within the inner most Mm.
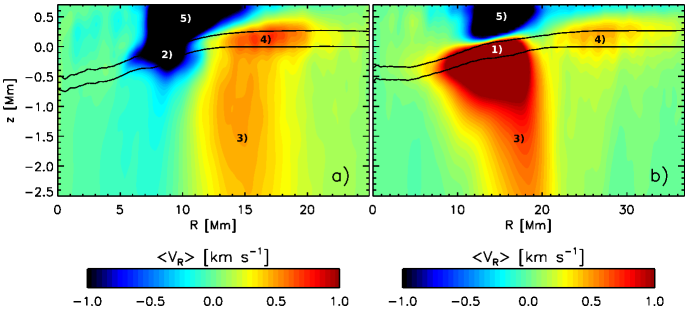
Radial flows in the upper most Mm of the domain for both cases are presented in Figure 6. In contrast to the previous figures we did not normalize here the velocity with the convective rms velocity. In the case of the sunspot without penumbra (panel a) we see outflows at photospheric levels for Mm of about . These flows are a direct continuation of the subsurface flow cell identified above and they reach their peak amplitude in the photosphere in between the and level. In the case of the sunspot with penumbra (panel b) the upward continuation of the deep reaching flow cell coincides with the penumbra and Evershed flow reaching an amplitude of about . In addition we see at greater distance ( Mm) an additional superficial outflow pattern with amplitudes of about to mostly above . This flow cell is neither related to the deep reaching flow component nor a continuation of the Evershed flow.
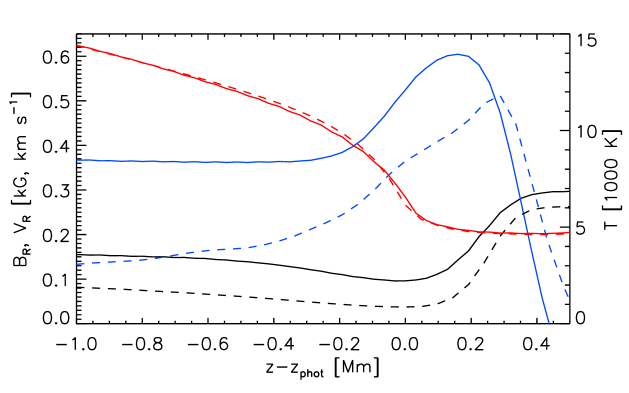
Figure 7 shows vertical profiles of this flow component for both sunspots together with the radial magnetic field and temperature. The largest flow amplitudes are found mostly above and the velocity peaks in the region with the steepest increase of toward the overlying magnetic canopy. Since most of the stronger magnetic field is found in the overlying canopy, the convection pattern remains close to isotropic. This differs from the situation found within the penumbra, where the magnetic field is strong enough to cause substantial anisotropy at and below Kitiashvili et al. (2009); Rempel et al. (2009a); Rempel (2011) and leads to a radial flow velocity that peaks near . In that sense the flow shown in Figure 7 is better characterized as overshooting granulation that is outward deflected by the overlying inclined magnetic canopy.
In addition strong inflows are present in layers higher than regardless of the presence or absence of an penumbra, which are possibly related to the inverse Evershed flow (Dialetis et al., 1985). This flow component is very robust and present in all numerical sunspot simulations we performed to date, however, due to the rather crude treatment of physics in those layers a more detailed study of this component would be required before stronger conclusions can be drawn (see also comments in Rempel et al., 2009a; Rempel, 2011).
Overall we identified in our simulations a total of 5 flow components that contribute to horizontal flows in the proximity of sunspots. We highlighted the following flow components in Figure 6: (1) The fast photospheric Evershed outflow in the presence of a penumbra, (2) a converging fast photospheric inflow (with a weaker downward extension) in the absence of a penumbra, (3) a deep reaching outflow cell with average velocities of about of the convective rms velocity, (4) a superficial outflow underneath the magnetic canopy, and (5) an inflow above . The flow components (1) and (2) are obviously strongly affected by the presence or absence of an penumbra, while the flow components (3) - (5) are of independent origin.
While the temporal evolution of the large scale flows surrounding the sunspot without penumbra (see Figure 2, right panels) shows an overall trend toward increasing outflow velocity, we find the opposite for the sunspot with penumbra. Figure 8 presents time averages of the radial flow velocity from 6-12 and 18-24 hours. The amplitude of flows in the photosphere is declining by about a factor of two. While in earlier stages the flow component (4) showed some connection to the deeper reaching component (3), it is mostly disconnected toward the end of our simulation run. We return to this aspect in Sect. 5.2.
3.3. Origin of large scale subsurface flows
The large degree of similarity between Figs. 4 and 5 strongly suggests an origin of the deep reaching flow component (3) that is independent from the Evershed flow. It is however non-trivial to clearly disentangle in the numerical simulations presented here the different processes that can give rise to large scale flows. There are primarily two effects: 1.) The sunspot imposes a geometric constraint on the surrounding convection pattern, which forces adjacent convection cells to align in a ring like pattern resulting in a mean flow. 2.) Reductions in the surface brightness lead to less downflows in the proximity of the spot. Since downflows provide low entropy material the result is an increase of the mean temperature driving a large scale flow pattern through buoyancy. We see evidence for both processes at work. Figs. 2 and 3 show clearly the ring like arrangement of convection cells and also the strong reduction of downflow lanes within this region. To get an independent estimate of the strength of both processes we report here on a series of idealized simulations in a Mm wide and Mm deep domain.
In the first setup we cut out a central cylinder with a radius of Mm to independently investigate the geometric effect. To this end we artificially set all velocities to zero within this region and replace the stratification with the mean stratification found outside this cylinder. In the second setup we set the radiative cooling function to zero within a central cylinder of Mm to investigate flows resulting from the blockage of heat flux. A combination of geometrical and thermal effects can be realized by considering a cone instead of a cylinder.
The resulting azimuthally averaged flows are presented in Figure 9. In the case of the pure geometric constraint (panel a) we see the development of a large scale flow cell, with flows converging toward the central cylinder for Mm and diverging flows further out. Overall the extent of the region with mean flows is about Mm, which is about times the radius of the central cylinder. However, the amplitude of the outflow is with of the convective rms velocity rather weak, larger values are found in the inflow cell in close proximity of the central cylinder. Heat flux blockage (panel b) leads to outflows at all depth levels in the proximity of central cylinder, even though further out we see the development of an inward directed flow cell. The mean flow speed is comparable to convective velocity in the upper most Mm but drops to values of less than of the convective rms velocity in deeper layers. In this experiment we assumed complete blockage of the heat flux, which clearly overestimates the influence of a sunspot. A combination of both effects can be realized by placing an upward opening cone as obstacle into the center of the domain (bottom panels). The mean flow velocity increases with opening angle and values of about of the convective rms velocity can be achieved with opening angle of (panel d). From these idealized experiments we can estimate that the bulk of the outflows results from blockage of heat flux, while geometric effects can have a contribution of up to .
The results from the idealized experiments show a good qualitative agreement in terms of amplitude and outflow pattern with the flows presented in Figs. 4 and 5 (primarily flow component 3). In the case of the sunspot with penumbra (Figure 5) the region with enhanced subsurface temperature is as expected centered underneath the penumbra with reduced heat loss. Interestingly the region with enhanced temperature in (Figure 4) is found in the same location, despite the absence of a penumbra. Furthermore the subsurface flow cells have in both cases about the same radial extent despite the fact that the sunspot with penumbra has almost twice the diameter. This is likely a consequence of the converging flow cell surrounding the sunspot without penumbra, which is shifting the location of diverging flow pattern further outward relative to the spot boundary. The converging flow cell is not present in the sunspot with penumbra.
3.4. Are there bright rings around sunspots?
Whether sunspots are surrounded by bright rings that account for some of the energy flux blocked by the lower brightness in umbra and penumbra has been extensively discussed in the literature. We refer here to Rast et al. (2001) and references therein for a detailed discussion of both theoretical and observational aspects of this problem. On the theoretical side it has been argued that the thermal conductivity and heat capacity of the convection zone are sufficiently large to absorb temporary thermal perturbations caused by sunspots without becoming visible as brightness change in the photosphere (Spruit, 1982a, b; Foukal et al., 1983; Chiang & Foukal, 1985; Spruit, 2000). On the observational side the main challenge lies in the proper separation of this effect from Facular brightening, which is a pure surface effect. Fowler et al. (1983) found bright rings in the range, the more recent study by Rast et al. (2001) brightness enhancements of , which are attributed to convective origin.
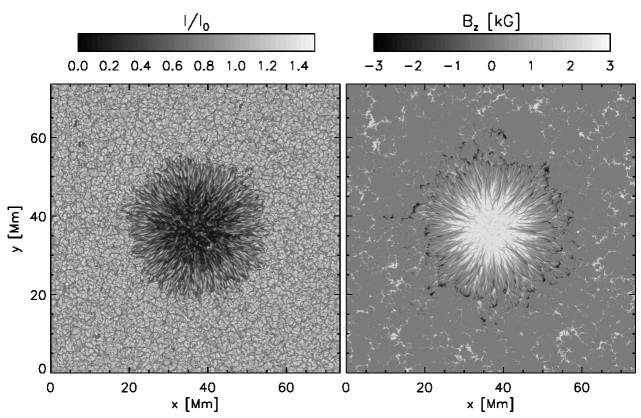
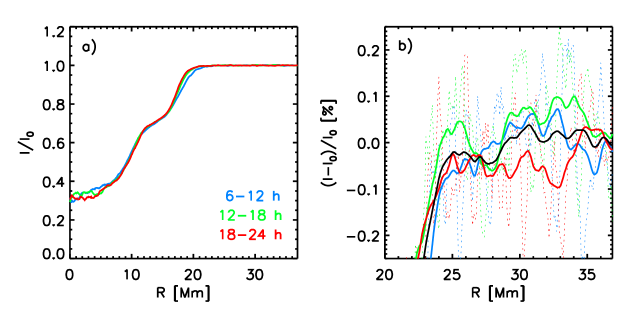
We analyze here the numerical simulation in the Mm3 domain, which has a more realistic penumbra and a moat region of at least Mm surrounding the spot. A snapshot of the intensity for a vertical ray is presented in Figure 10, Figure 11 shows azimuthally averaged intensity profiles for this sunspot model. We show three consecutive 6 hours temporal averages of the bolometric intensity for a vertical ray. Panel a) shows intensity profiles from the umbra into the moat region, panel b) fluctuations within the moat region on a different scale. We do not see evidence for a systematic variation of intensity with radius in the moat region. For the individual 6 hour averages systematic trends are smaller than and these trends are different for consecutive 6 hour averages. The dark solid line shows the average of the intensity from hours. Here we see a weak () enhancement of intensity in the moat region with a peak at about Mm, however, given the substantial variation between the 6 hours averages it would require a longer simulation run to determine the robustness of this trend. The presented intensity profiles are based on azimuthal averages that take into account all magnetized areas in the moat region. Since our numerical resolution of km in the horizontal direction in combination with grey radiative transfer is not sufficient for resolving Faculae, we do not have to correct for Facular brightening. Nevertheless, we repeated the analysis after cutting out magnetized regions. If we consider only regions with G the results remain essentially the same. If we lower the threshold to G we see a bright ring with about amplitude. Since most vertical magnetic field is concentrated in the darker downflow lanes and more unsigned vertical flux is present in the proximity of the sunspot the latter is an artifact of removing more dark downflow lanes from the average in the inner moat region compared to the outer.
We also note that the total energy flux in our domain is reduced compared to quiet sun convection, since the convective energy flux crossing the bottom boundary is free to adjust (we specify the entropy in inflow regions, but the mass flux crossing the boundary is not constrained). In addition most of the energy flux that is blocked by the umbra of the sunspot does not enter the computational domain in the first place due to our choice of the bottom boundary condition. Nevertheless, some of the energy flux entering the domain underneath the penumbra has to be diverted away from the spot, which is, as we discussed above, the primary reason for the presence of the large scale subsurface flow cell surrounding the sunspot. The latter process is associated in the deeper layers with a temperature excess reaching about of the convective rms temperature fluctuation (see Figure 5d). The absence of bright rings at photospheric levels clearly shows that this temperature perturbation remains well hidden beneath the photosphere.
4. Influence from bottom boundary condition
The simulation we reported on so far in Sect. 3 as well as previous simulations by Rempel et al. (2009b) and Rempel et al. (2009a) were based on a bottom boundary that sets all velocities to zero in regions of strong field, but allows for convective motions crossing the boundary in regions with weak field. In the latter, velocity components are symmetric across the boundary in downflow regions, while the velocity is vertical (horizontal components antisymmetric) in upflow regions. In shallow domains with about Mm depth this boundary condition is a necessity to prevent a rather quick decay of a sunspot within a few hours. We demonstrate this here by a numerical experiment performed in a Mm deep domain using an open bottom boundary, which imposes a symmetric boundary for all three mass flux components. In regions with kG we impose a constant total pressure at the bottom boundary, in regions with kG we extrapolate the pressure stratification. The latter is necessary in a shallow domain to prevent long lasting inflows that would destroy the sunspot on even shorter time scales than reported here.
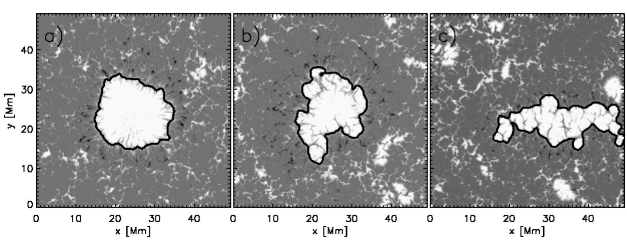
Figure 12 shows the evolution of the sunspot in the Mm deep domain. We restarted this simulation from a run which was previously evolved with a closed boundary condition in regions with G, leading to a nearly axisymmetric stable sunspot (top panels of Figure 12). After only a few hours we observe a decay of the spot that is primarily driven through interchange instabilities. After hours we see the clear evidence of intrusions of field free plasma near the bottom boundary, which pushes buoyantly upward within the magnetized region and becomes visible in the photosphere through granulation patches showing up at the periphery of the umbra. After hours these regions have expanded to patches of Mm diameter and most of the umbra is dispersed along the periphery of the patches.
In Figure 13 we contrast this result with a repetition of the same experiment in a Mm deep domain. To this end we start from the snapshot at hours shown in Figure 1 and evolve the simulation for hours with the open boundary condition. In contrast to the experiment performed in the Mm deep domain we impose a constant total pressure everywhere in the domain. Figure 13 presents 3 snapshots about hours apart from each other, the quantities shown are the same as in Figure 1. Suddenly opening the bottom boundary beneath the sunspot leads to an upflow strongly weakening the magnetic field, however, due to the deeper domain this upflow does not continue into the photosphere. After the initial weakening in the deep domain the trunk of the sunspot fragments into smaller flux bundles. The photospheric signature of this process is an increased rate of deformation and fragmentation of the sunspot compared to the reference in Figure 1 with the closed boundary, but even at hours ( hours of evolution with open boundary condition) most of the flux remains concentrated together. The overall slower decay rate in the deeper domain compared to the 6 Mm deep domain discussed above is consistent with the increase of the convective time scale by a factor of about compared to the shallow domain. In Figure 14 we compare the flux remaining in the sunspots toward the end of our simulation runs. To evaluate the flux of the sunspots we compute the flux within the shown kG contour line, which is based on a smoothed magnetogram (Gaussian with FWHM of km). In the case of the closed (open) boundary condition about () of the initial flux at hours (shown in panel a) is still concentrated together. At the same time the average field strength is dropping from G to G ( G), so that the actually remaining spot area is (). Overall the decay rate is about a factor of 2 larger for the open boundary condition. Averaged over the hours of the simulated decay the corresponding flux loss rates are Mx day-1 ( Mx day-1). These values are about a factor of larger than those observed by Martínez Pillet (2002), who found values around Mx day-1. For a substantially larger sunspot Kubo et al. (2007) found values of Mx day-1. A detailed comparison to observations is currently only of limited practicality since our simulated sunspots shown in Figure 1 and 13 are essentially penumbra free “naked” sunspots and most reported sunspot decay rates refer to spots with fully developed penumbrae. However, a direct comparison between both simulations gives important clues about the influence of the bottom boundary condition.
Since we start our simulations from a thermally relaxed HD simulation with magnetic field added to it, initially magnetic field and surrounding flow patterns are not necessarily dynamically consistent. In the case with closed boundary conditions (Figure 1) the flow field is forced to adjust to the presence of the field, while in the case of open boundary conditions the magnetic field adjusts to the flow field, explaining the substantial change in overall shape of the sunspot in Figure 13. As a consequence the experiment shown in Figure 13 likely overestimates the decay rate due to this initial adjustment state.
Overall our set of experiments demonstrates that the constraints imposed by the bottom boundary condition on the time evolution of sunspots can be relaxed by performing simulations in deeper (more computationally expensive) domains. A Mm deep domain is consistent with sunspot life times of a few days, which is still much shorter than the life time of most observed sunspots. Extrapolating this result a life time of a week or more should be reached in the Mm depth range. The overall decay rate is likely also strongly dependent on the initial state, which can be obtained only in a self-consistent manner through a flux emergence simulation describing the sunspot formation process.
5. Discussion
5.1. Flow components around sunspots
We find large scale outflows around sunspots as a robust result from a series of numerical simulations including idealized experiments. We identified 5 different flow components:
-
1.
The Evershed flow closely related to penumbral fine structure and driven by magneto convection in an inclined magnetic field.
-
2.
In the absence of a penumbra a converging flow caused by enhanced radiative cooling of granules adjacent to the umbra (flow extends with reduced amplitude to deeper layers).
-
3.
A deep reaching large scale flow that originates from a combination of geometric constraints and blockage of heat flux, with the latter providing the dominant contribution. The underlying convective flow morphology in the periphery of the sunspot is a ring-like arrangement of convection cells, which leads to large scale outflows reaching about of the convective rms velocity over the depth range currently accessible through numerical simulations (down to Mm depth).
-
4.
A shallow outflow component found in the plage region surrounding the sunspots. This flow is mostly limited to the photosphere and is best characterized as overshooting granulation that is outward deflected by the overlying inclined magnetic canopy.
-
5.
An inflow in levels higher than located near the outer edge of the umbra or above the penumbra (if present).
By comparing numerical simulations of sunspots with and without penumbra we identified an origin of the flow components (3) to (5) that is independent from the existence of a penumbra and Evershed flow. Through a series of idealized experiments we demonstrated that the flow component (3) arises from a combination of geometric constraints and blockage of heat flux, with the latter playing the dominant role.
In models without penumbra we find a two cell flow pattern around the sunspot, consisting of a converging flow in the proximity of the spot (2) and a diverging flow further out (3), which merges in the photosphere with the flow pattern (4). The dominant flow component in this case is (3).
In models with penumbra the flow pattern (2) is not present and replaced with (1). Flow pattern (1) merges continuously in the deeper layers with (3), resulting in outflows at all depth levels underneath the penumbra. Flow pattern (4) is in this case somewhat detached and leads to a superficial flow component outside the sunspot. The amplitude of this flow component is declining throughout the simulation from about ms-1 to less than ms-1.
The inflow component (5) in higher layers is present in both cases and possibly related to the inverse Evershed flow Dialetis et al. (1985). This flow is very robust and present in all numerical sunspot simulations we performed to date, however, due to the rather crude treatment of physics in those layers a more detailed study of this component would be required before stronger conclusions can be drawn (see also comments in Rempel et al., 2009a; Rempel, 2011).
The Evershed flow component (1) has been discussed with great detail in previous publications about MHD simulations (Heinemann et al., 2007; Scharmer et al., 2008; Rempel et al., 2009b; Kitiashvili et al., 2009; Rempel et al., 2009a; Rempel, 2011) and is well studied in observations (see e.g. Solanki, 2003; Thomas & Weiss, 2004), we focus the following discussion primarily on the flow components (2) to (4).
The inflow component (2) has been observed in pores as well as spots without penumbra (Wang & Zirin, 1992; Sobotka et al., 1999; Vargas Domínguez et al., 2010) and has been identified in 3D MHD simulations of pores (Cameron et al., 2007), where it plays a crucial role in maintaining the magnetic structure as well as forming it (Kitiashvili et al., 2010).
The dominant subsurface outflow component (3) is essentially a convective flow that is modified due to a combination of geometric constraints together with heat flux blockage caused by the presence of the sunspot. Associated with this flow is a ring of temperature excess around the sunspot, which is similar to the flow pattern and related thermal perturbations that were suggested by Meyer et al. (1974), although we see this flow on scales smaller than supergranulation. Despite a thermal signature in deeper layers with amplitudes comparable to those of convective rms temperature fluctuations we do not see compelling evidence for a bright ring surrounding the sunspot in the photosphere.
Apart from being a shallow photospheric moat flow component, the flow pattern (4) could be possibly also related to observed flows along the magnetic canopy (see e.g. Rezaei et al., 2006, and references therein). Since we see this effect in our simulations regardless of the presence or absence of a penumbra this component is not an extension of the Evershed flow in our simulations.
The flow pattern we find around the sunspot without penumbra (converging flow in close proximity, diverging flow further out) is similar to flows found in axisymmetric sunspot simulations such as Hurlburt & Rucklidge (2000), Botha et al. (2006), and Botha et al. (2008). It has been speculated that in the case of a sunspot with penumbra only a shallow outflow (Evershed flow) is added on top of this flow pattern, while a converging flow remains in deeper layers Zhao et al. (2010). We do not find any evidence for such a layered flow structure in our simulations. In the case of a sunspot with penumbra the inflow cell adjacent to the spot disappears and the spot is surrounded by outflows at all depth levels (a combination of the flow patterns (1) and (3)). This is consistent with the underlying driving mechanisms of these flows: In the absence of a penumbra granules in the proximity of the umbra have enhanced radiative losses, creating cool downflows that extend to the bottom of the domain and maintain in the proximity of the sunspot a converging convective flow pattern. In the presence of a penumbra the region with enhanced radiative loss is replaced by a region with reduced radiative loss, which leads to an overall reduction of cool downflows. In addition the fast near surface Evershed flow leads to a preferred draining of these downflows toward the outer edge of the penumbra. The consequence is a temperature enhancement in the subsurface layers driving a broad upflow underneath the penumbra that results in outflows at all depth levels. This flow patterns is consistent with a recent inversion by Gizon et al. (2009, 2010b) that reports on outflows in the upper most Mm. A recent result by Featherstone et al. (2011) indicates two contributions to the large scale flows surrounding sunspots: a superficial near photospheric and a deeper reaching component that peaks at about 5 Mm depth and essentially disappears in depth greater than Mm.
Our sunspot models are set up in way that they yield almost quasi-stationary solutions, which implies that they are likely best compared to very stable, almost circular sunspots with little evolution over time scales of a few days. It is possible that the subsurface flow structure is much more complicated around more complex active regions with rapid evolution.
5.2. Connection to observed moat flows
In observations moat flows are typically defined as outflows that are present from the outer edge of a sunspot (penumbra) to about 2 sunspot radii. Typical flow velocities are around ms-1 (Brickhouse & Labonte, 1988; Sobotka & Roudier, 2007; Balthasar & Muglach, 2010). Over the past years it has been discussed in the literature whether Evershed and moat flow are connected or of independent origin. Sainz Dalda & Martínez Pillet (2005) and Cabrera Solana et al. (2006) found examples of moving magnetic features in the moat region that show a connection to penumbral filaments. Vargas Domínguez et al. (2008) studied several examples of complex active regions and found a very close connection between the presence of penumbrae and moat flows. Furthermore, moat flows were only found near penumbrae perpendicular to the sunspot border and absent near tangential penumbrae. Moat flows were also absent when there was a polarity inversion line in the proximity of the sunspot. Zuccarello et al. (2009) reported on moving magnetic features diverging from a sunspot without penumbra, indicating an origin of horizontal outflows independent from a penumbra and Evershed flow.
In the simulations presented here we find sunspots surrounded by outflows in the photosphere with velocities in the ms-1 range that extend to about 2 sunspot radii, regardless of the presence or absence of a penumbra and the associated Evershed flow.
In the absence of a penumbra we find in close proximity of the spot a ring of inflowing plasma, which has been also observed around pores by Wang & Zirin (1992); Sobotka et al. (1999); Vargas Domínguez et al. (2010). In addition Sobotka et al. (1999); Vargas Domínguez et al. (2010) observed a diverging flow further away that is related to a ring-like arrangement of “centers of positive divergence” around the pore, which is similar to the preferred ring-like arrangement of convection cells we find around our simulated sunspots over a depth range of more than Mm. In that sense observations likely see the “tip of the iceberg” of this flow structure. Large scale outflows are also observed around “naked” (penumbra free) sunspots (Zuccarello et al., 2009), which we would expect as this process is largely scale invariant.
Interestingly, our sunspot with penumbra has an on average a weaker outflow at photospheric levels compared to the penumbra free sunspot. In addition the outflow results primarily from the very superficial flow component (4) and we observe a trend of declining flow speed throughout the simulation, which is opposite to trend we find in the simulation with the penumbra free sunspot. At later stages ( hours) of the simulation with penumbra we find a rather sharp decline of the Evershed flow and subsurface flow pattern (3) at about Mm, which results in a downflow that collects most of the horizontal mass flux present. This downflow is in part driven by cool material deposited there by the Evershed flow (cool plasma forming in the penumbra is transported preferentially outward), and in part a consequence of opposite polarity magnetic flux accumulating near the outer edge of the penumbra that diverts horizontal flows downward. The lower temperature is evident from Figure 5(d), the opposite polarity flux causing a polarity inversion line around the sunspot from Figure 10. The absence of moat flows in a region with a polarity inversion near the outer edge of the penumbra was also observed by Vargas Domínguez et al. (2008). If this shielding effect would be weaker it is conceivable that the Evershed flow component (1) and deep flow component (3) have also larger contributions further out, leading to a deeper reaching and faster moat flow around the sunspot with penumbra as it is partially indicated during earlier stages of this simulation (see Figure 8a). However, it would require additional numerical experiments to clearly quantify the role of a magnetic inversion line in our simulations.
While we find large scale outflows around sunspots as a robust result regardless of the presence or absence of a penumbra, it is also possible that we are still missing some processes contributing to larger scale flows, in particular on scales of supergranulation that are still not well captured by the extent of our simulation domain. Independent from that the simulations presented here clearly show that there are likely different contributions to large scale flows like the moat flow, and some of these contributions are independent from the Evershed flow (components 3 and 4). Based on our findings we conjecture that there is likely no clear “yes” or “no” answer to the question of whether moat and Evershed flow are related. To some extent this connection is also subject to interpretation and the adopted definition of “moat flow”. For example Vargas Domínguez et al. (2010) did not refer to the outflow they observed around pores as moat flow, while we see strong indications that those flows have likely a much deeper reaching structure and are in part related to blockage and modification of convective energy transport around sunspots.
Due to the substantial differences in the depth extent of the individual outflow components we identified (components (1) and (4) are superficial, while (3) is deep reaching), a clarification of the Evershed-moat flow relationship has to consider the deeper reaching subsurface flow structure through helioseismology (see, for example, recent results by Gizon et al., 2009, 2010b; Featherstone et al., 2011).
5.3. Robustness of flow structure
The large scale flows we discussed in previous sections reach scales comparable to the computational domain size. It is therefore essential to discuss to which degree the flow structure could be influenced by the overall simulation setup including boundary conditions. A strong dependence on boundary conditions has been found for example in the 2D axisymmetric simulations of Botha et al. (2008). We have shown already that the magnetic boundary conditions strongly influence the properties of the magnetic sunspot structure. While the bottom boundary primarily affects the long-term stability and evolution of the sunspot, the top boundary condition sets the overall extent of the sunspot penumbra including the associated Evershed flow. With regard to large scale flows the key question is whether these flows are a response to the magnetic structure present in the simulation and are driven by resolved physical processes within the computational domain or whether they are in addition substantially influenced by the hydrodynamical boundary conditions.
Our top boundary condition is located about 700 km above the quiet sun level and therefore a density contrast of about three orders of magnitude away from the photosphere. Although flow velocities can be substantial (larger than 10 km s-1) at this boundary, the associated mass and momentum fluxes are negligible and no substantial feedback on flows in the photosphere and below takes place. The only flow component potentially affected by this boundary condition is the component (5). Both, the Evershed flow (1) and inflow in the absence of penumbra (2) are driven by resolved physical processes within the computational domain. This is also the case for the flow component (4), which is in addition less dependent on the magnetic boundary condition than components (1) and (2).
The largest scale flow we find in our simulations is the deep reaching flow component (3). In all of the simulations discussed this flow extends to the bottom boundary and at least in the domains that are only 50 Mm wide the radial extent of this flow becomes comparable to the horizontal domain size. The potential influence of the horizontal and bottom boundary conditions on this flow could be investigated by either changing the boundary conditions or by comparing simulations of similar sunspots in differently sized domains. We have done here the latter. Figures 4 and 5 compare flow systems in 2 simulations with quite different domain size, only a common subsection is shown. In Figure 4 the simulation domain extends to about 15.5 Mm depth, i.e. the mass in the part not shown exceeds the mass in the part shown by about a factor of 10! Nevertheless the flow structure of component (3) is very similar in both cases, and in particular the absence of a converging return flow near the bottom boundary is a robust result (such a flow was only present as a transient during early evolution stages shown in Figure 2). Similarly the horizontal extent of the domain does not influence the flow structure substantially. Even though the domain extends in Figure 5 to a radial position of 37 Mm, the radial extent of the large scale flow is similar to that found in Figure 4. We have done several additional simulations we did not report here, in particular a simulation of the sunspot shown in Figure 4 in an only 8 Mm deep domain and a series of simulations with different grid resolution of the sunspot shown in Figure 5 in a domain only 49.152 Mm wide and 6.144 Mm deep. In all cases we find with regard to the axisymmetric flow components similar results when we compare the overlapping parts of the simulation domains. Additional evidence that the horizontal boundary conditions do not matter too much for this flow component comes from the “double sunspot” simulation of Rempel et al. (2009a); Rempel (2011). Due to the horizontal periodicity this simulation assumes sunspots of alternating polarity in the x and same polarity in the y direction. While this strongly influences the structure of the penumbra and Evershed flow, the subsurface flow pattern corresponding to flow component (3) remains mostly unaffected (Rempel, 2011, see Figure 20).
A related concern is the temporal evolution of large scale flows as our simulations address at this point mostly rather short lived sunspots. This is not a major concern for the flow components (1), (2) and (5) which are established within a few hours of simulation time and did not show any substantial variation over the time frame of 1-2 days we covered. The flow components (3) and (4) show a temporal evolution which is presented in Figures 2 and 8. The rather strong variation of component (4) shown in Figure 8 is limited to this particular sunspot and likely related to the magnetic field evolution in the moat region as discussed in Section 5.2. We did not observe a substantial variation of this flow component around the sunspot without penumbra. Since the flow component (3) essentially extends from the photosphere to the bottom boundary of our domain it covers regions with a substantial variation of the intrinsic convective time scales. The quantity varies from about a minute in the photosphere to 6 hours in 15.5 Mm depth. The effective life time of convection patterns at the respective depths is about a factor of 5-10 larger, leading to time scales of 5-10 minutes in the photosphere (life time of granules), 3-6 hours in 5.5 Mm depth (approximate life time of the sunspot in Figure 12), and 30-60 hours in 15.5 Mm depth (approximate life time of the sunspot in Figure 13). From this we can conclude that the the large scale flow component (3) can be considered mostly converged in the upper most 8 Mm of our simulation domain (at least 5-10 convection pattern life times). In addition we did not see any evidence that the temporal evolution changes the large scale flow topology, it mostly affects the average flow amplitudes (see Figure 2). As far as it concerns the flow component (3) the current simulations likely underestimate the flow velocity in the deeper parts of the domain.
Related to the overall temporal evolution is also the initial state of our simulations and its influence on the subsequent sunspot evolution as discussed in Section 4. In our current setup large scale flows are the response to a magnetic obstacle in the convection zone that is initially not consistent with the flow fields present. However, the system evolves into a state in which both become consistent by evolving the magnetic field and flow structure. Ultimately this shortcoming will be resolved through active region scale flux emergence simulations. Fist results such as Cheung et al. (2010) and work in progress lead to results that are in terms of magnetic field and flow structure comparable to the penumbra free sunspot discussed here.
5.4. Subsurface field structure of sunspots
We investigated the influence from the bottom boundary on the overall stability and life time of our simulated sunspots by comparing simulations in and Mm deep domains. In the shallow domain a closed boundary condition in strong field regions is required to prevent an unrealistically fast decay of the sunspot. Using the same boundary condition in the Mm deep domain adds several degrees of freedom to the long term evolution of the sunspot allowing for flux separation and decay driven through convective motions in more than Mm depth beneath the solar surface. In the photosphere these flux separation events are accompanied with light bridge formation. Changing the bottom boundary condition to an open boundary in strong field regions enhances the deformation and decay rate of the sunspot, but unlike shallow domains, the sunspot stays coherent for at least 24 hours in time. It is very likely that the time scales of sunspot decay will become consistent with observed sunspot life times in deeper computational domains regardless of the bottom boundary condition used. We note that these conclusions are currently based on numerical simulations of sunspots without an extended penumbra. It has been suggested that the presence of an extended penumbra can lead in the upper most few Mm to an additional stabilization of a sunspot against interchange instabilities (Meyer et al., 1977). Note that our simulation with penumbra was performed only in a 9 Mm deep domain (due to the substantially higher grid resolution) and used again a closed boundary in strong field regions.
The “anchoring problem” of sunspots (see for example the corresponding chapters in Gizon et al., 2010a; Moradi et al., 2010, and further references therein) is closely related to the subsurface structure of sunspots. A sufficiently deep anchoring is required to explain the relatively long life times of sunspots compared to the convective turnover as well as Alfvénic travel time scales found in the upper convection zone. The two solutions discussed are the cluster model (Parker, 1979), in which a convergent subsurface flow opposes sunspot decay, and a sufficiently deep anchoring close to the base of the convection zone where convective turnover time scales (defined through ) are of the order of 1-2 weeks or even longer (overshoot region). Note that this is about a factor of 30 longer than the longest time scales in our 16 Mm deep simulation domain, in addition we found that the effective life time of the magnetic structure is about .
With regard to the cluster model we do not see clear evidence that converging flows in the proximity of sunspots are a viable solution – at least not for a sunspot with an extended penumbra where we find outflows at all depth levels. Although a weaker converging flow is present in our sunspot model without penumbra, we do not see a clear indication that it stabilizes the sunspot sufficiently against decay (see the case in Figure 13).
With regard to “deep anchoring” it has been pointed out that this might be inconsistent with the photospheric motion of sunspots after the flux emergence process. Rising magnetic flux tubes show typically rather long wavelengths such as or modes (c.f. Fan et al., 1993, 1994; Moreno-Insertis et al., 1994; Schüssler et al., 1994; Caligari et al., 1995). Due to magnetic tension forces the opposite polarities of the active region continue to separate after the emergence at a rate that is inconsistent with observations. Because of this it has been suggested that sunspots become dynamically disconnected from their magnetic roots (at the base of the convection zone) shortly after the flux emergence in the photosphere (Fan et al., 1994; Moreno-Insertis et al., 1995; Schrijver & Title, 1999; Schüssler & Rempel, 2005). Here the term “dynamical disconnection” is used to describe a situation in which the magnetic field strength drops over a certain height range below equipartition field strength so that magnetic field becomes passive with respect to convective motions. While the dynamical disconnection process alleviates the drift problem mentioned above, there are currently 2 unresolved issues: 1. Is it possible to dynamically disconnect a flux tube as suggested by Schüssler & Rempel (2005) without destroying the coherence of the sunspot in the photosphere? 2. Is the resulting shallow (possibly less than Mm deep) sunspot sufficiently stable?
The models presented here give some clues to answer these questions. In the simulation with open bottom boundary condition in a Mm domain we observe initially (after switching from a closed to an open boundary) an inflow into the sunspot with an amplitude comparable to the typical convective rms velocity at the depth of the boundary condition, i.e. a velocity of a few . The latter is very similar to the assumptions made by Schüssler & Rempel (2005). The inflow leads to a destruction of the coherent trunk of the spot in the lower part of the domain while the field in the photosphere shows only a moderate enhancement of decay compared to the closed boundary reference case. While this is in principal support of the disconnection scenario discussed by Schüssler & Rempel (2005), our results point also toward the necessity of a sufficiently deep disconnection to ensure coherence of the photospheric parts of the sunspot over time scales of several days to weeks. In our currently Mm deep domain we observe a slow decay of the sunspot on time scales of days. Extrapolating this result, life times of about a week should be reached in a depth of about Mm. In addition it is conceivable that the subsurface convection pattern is substantially altered as consequence of the flux emergence process forming the sunspots in the first place. This could lead to systematic difference compared to the simulations presented here, in which we added the magnetic field to a pre-existing convection pattern. This problem will be ultimately resolved once realistic flux emergence simulations such as Cheung et al. (2010) will become available in sufficiently deep domains, perhaps coupled with models of flux emergence in the deep convection zone such as Fan (2008).
With regard to the subsurface structure we point out that the numerical simulations presented here and especially those described in Rempel et al. (2009a) are clearly biased toward the monolithic picture due to the monolithic initial state as well as bottom boundary condition (at least if the closed boundary is used). Nevertheless, we find in the deeper domains considered here a substantial fragmentation of the subsurface field caused by the interaction with the surrounding convection. Almost all fragmentation events (intrusions of field free plasma) present several Mm beneath the surface lead on time scales of a few hours to a day to the formation of light bridges or flux separation in the photosphere. These results allow for the conclusion that the subsurface field of sunspots very likely shows significant fragmentation, but most of these subsurface fragmentations (at least those present in the upper most Mm) do not remain hidden and become visible in the photosphere on a rather short time scale, i.e. the photospheric appearance of a sunspot should tell us a lot about its subsurface structure: Sunspots that are very stable and do not show light bridges are more monolithic than sunspots with light bridges and signs of flux separation.
6. Conclusions
We presented simulations of sunspots in up to Mm deep and up to Mm wide domains covering time evolution of up to 2 days. Through variations of the magnetic top boundary condition we simulated sunspots with and without penumbrae while having comparable magnetic flux, allowing for a direct side by side comparison of their properties with regard to large scale flows. We identified 5 different flow components in our simulations, which we discussed in Section 5.1 and highlighted possible connections to the Evershed - moat flow connection in Section 5.2. Overall we identified in our simulations 2 outflow components (one shallow and one deep reaching) that give a contribution to large scale flows around sunspots independent from the Evershed flow. In the case of a sunspot with penumbra we find outflows at all depths covered by the numerical simulation. Resolving the Evershed moat flow connection requires in addition to the detailed study of photospheric flows also the study of deeper reaching flow structures that are accessible through helioseismology.
The long-term stability and evolution of the simulated sunspots is mostly governed by the longest time scale of convective motions found near the bottom of the simulation domain. If the magnetic field is not artificially constrained at the bottom boundary, sunspots strongly deform and decay on a time scale of the order of (evaluated near the bottom of the domain). This translates to a few hours in 6 Mm depth, about 1-2 days in 16 Mm depth, and 10 days in 50 Mm depth (assuming the trend indicated in the numerical simulations shown here is valid over a broader depth range). We did not find a clear indication that the large scale flows developing around our simulated sunspots play a key role in maintaining their coherence, at least not beyond the intrinsic convective time scales present. In that sense our results point more toward “deep anchoring” as an explanation for the observed sunspot life times. Further clarification of this matter will require simulations in deeper domain that also include the flux emergence and sunspot formation process in order to start from a more consistent initial state.
References
- Balthasar & Muglach (2010) Balthasar, H., & Muglach, K. 2010, A&A, 511, A67+
- Bercik et al. (2003) Bercik, D. J., Nordlund, A., & Stein, R. F. 2003, in Local and Global Helioseismology: the Present and Future, ed. H. Sawaya-Lacoste (European Space Agency, ESA SP-517), 201–206
- Botha et al. (2008) Botha, G. J. J., Busse, F. H., Hurlburt, N. E., & Rucklidge, A. M. 2008, MNRAS, 387, 1445
- Botha et al. (2006) Botha, G. J. J., Rucklidge, A. M., & Hurlburt, N. E. 2006, MNRAS, 369, 1611
- Botha et al. (2011) —. 2011, ApJ, 731, 108
- Brickhouse & Labonte (1988) Brickhouse, N. S., & Labonte, B. J. 1988, Sol. Phys., 115, 43
- Cabrera Solana et al. (2006) Cabrera Solana, D., Bellot Rubio, L. R., Beck, C., & del Toro Iniesta, J. C. 2006, ApJ, 649, L41
- Caligari et al. (1995) Caligari, P., Moreno-Insertis, F., & Schüssler, M. 1995, ApJ, 441, 886
- Cameron et al. (2007) Cameron, R., Schüssler, M., Vögler, A., & Zakharov, V. 2007, A&A, 474, 261
- Cheung et al. (2010) Cheung, M. C. M., Rempel, M., Title, A. M., & Schüssler, M. 2010, ApJ, 720, 233
- Chiang & Foukal (1985) Chiang, W., & Foukal, P. 1985, Sol. Phys., 97, 9
- Dialetis et al. (1985) Dialetis, D., Mein, P., & Alissandrakis, C. E. 1985, A&A, 147, 93
- Fan (2008) Fan, Y. 2008, ApJ, 676, 680
- Fan et al. (1993) Fan, Y., Fisher, G. H., & Deluca, E. E. 1993, ApJ, 405, 390
- Fan et al. (1994) Fan, Y., Fisher, G. H., & McClymont, A. N. 1994, ApJ, 436, 907
- Featherstone et al. (2011) Featherstone, N. A., Hindman, B. W., & Thompson, M. J. 2011, Journal of Physics Conference Series, 271, 012002
- Foukal et al. (1983) Foukal, P., Fowler, L. A., & Livshits, M. 1983, ApJ, 267, 863
- Fowler et al. (1983) Fowler, L. A., Foukal, P., & Duvall, Jr., T. 1983, Sol. Phys., 84, 33
- Gizon et al. (2010a) Gizon, L., Birch, A. C., & Spruit, H. C. 2010a, ARA&A, 48, 289
- Gizon et al. (2000) Gizon, L., Duvall, Jr., T. L., & Larsen, R. M. 2000, Journal of Astrophysics and Astronomy, 21, 339
- Gizon et al. (2009) Gizon, L., et al. 2009, Space Sci. Rev., 144, 249
- Gizon et al. (2010b) —. 2010b, Space Sci. Rev., 99
- Harvey & Harvey (1973) Harvey, K., & Harvey, J. 1973, Sol. Phys., 28, 61
- Heinemann et al. (2007) Heinemann, T., Nordlund, Å., Scharmer, G. B., & Spruit, H. C. 2007, ApJ, 669, 1390
- Hurlburt & Rucklidge (2000) Hurlburt, N. E., & Rucklidge, A. M. 2000, MNRAS, 314, 793
- Kitiashvili et al. (2009) Kitiashvili, I. N., Kosovichev, A. G., Wray, A. A., & Mansour, N. N. 2009, ApJ, 700, L178
- Kitiashvili et al. (2010) —. 2010, ApJ, 719, 307
- Kubo et al. (2007) Kubo, M., Shimizu, T., & Tsuneta, S. 2007, ApJ, 659, 812
- Martínez Pillet (2002) Martínez Pillet, V. 2002, Astronomische Nachrichten, 323, 342
- Meyer et al. (1977) Meyer, F., Schmidt, H. U., & Weiss, N. O. 1977, MNRAS, 179, 741
- Meyer et al. (1974) Meyer, F., Schmidt, H. U., Wilson, P. R., & Weiss, N. O. 1974, MNRAS, 169, 35
- Moradi et al. (2010) Moradi, H., et al. 2010, Sol. Phys., 267, 1
- Moreno-Insertis et al. (1994) Moreno-Insertis, F., Caligari, P., & Schuessler, M. 1994, Sol. Phys., 153, 449
- Moreno-Insertis et al. (1995) Moreno-Insertis, F., Caligari, P., & Schüssler, M. 1995, ApJ, 452, 894
- Parker (1979) Parker, E. N. 1979, ApJ, 230, 905
- Rast et al. (2001) Rast, M. P., Meisner, R. W., Lites, B. W., Fox, P. A., & White, O. R. 2001, ApJ, 557, 864
- Rempel (2010) Rempel, M. 2010, IAU Symp. 273, arXiv:1011.0981
- Rempel (2011) —. 2011, ApJ, 729, 5
- Rempel et al. (2009a) Rempel, M., Schüssler, M., Cameron, R. H., & Knölker, M. 2009a, Science, 325, 171
- Rempel et al. (2009b) Rempel, M., Schüssler, M., & Knölker, M. 2009b, ApJ, 691, 640
- Rezaei et al. (2006) Rezaei, R., Schlichenmaier, R., Beck, C., & Bellot Rubio, L. R. 2006, A&A, 454, 975
- Sainz Dalda & Martínez Pillet (2005) Sainz Dalda, A., & Martínez Pillet, V. 2005, ApJ, 632, 1176
- Scharmer et al. (2008) Scharmer, G. B., Nordlund, Å., & Heinemann, T. 2008, ApJ, 677, L149
- Schrijver & Title (1999) Schrijver, C. J., & Title, A. M. 1999, Sol. Phys., 188, 331
- Schüssler et al. (1994) Schüssler, M., Caligari, P., Ferriz-Mas, A., & Moreno-Insertis, F. 1994, A&A, 281, L69
- Schüssler & Rempel (2005) Schüssler, M., & Rempel, M. 2005, A&A, 441, 337
- Schüssler & Vögler (2006) Schüssler, M., & Vögler, A. 2006, ApJ, 641, L73
- Sheeley (1969) Sheeley, Jr., N. R. 1969, Sol. Phys., 9, 347
- Sheeley (1972) —. 1972, Sol. Phys., 25, 98
- Sobotka & Roudier (2007) Sobotka, M., & Roudier, T. 2007, A&A, 472, 277
- Sobotka et al. (1999) Sobotka, M., Vázquez, M., Bonet, J. A., Hanslmeier, A., & Hirzberger, J. 1999, ApJ, 511, 436
- Solanki (2003) Solanki, S. K. 2003, A&Ar, 11, 153
- Spruit (2000) Spruit, H. 2000, Space Sci. Rev., 94, 113
- Spruit (1982a) Spruit, H. C. 1982a, A&A, 108, 348
- Spruit (1982b) —. 1982b, A&A, 108, 356
- Thomas & Weiss (2004) Thomas, J. H., & Weiss, N. O. 2004, ARA&A, 42, 517
- Vögler et al. (2005) Vögler, A., Shelyag, S., Schüssler, M., Cattaneo, F., Emonet, T., & Linde, T. 2005, A&A, 429, 335
- Vargas Domínguez et al. (2010) Vargas Domínguez, S., de Vicente, A., Bonet, J. A., & Martínez Pillet, V. 2010, A&A, 516, A91+
- Vargas Domínguez et al. (2008) Vargas Domínguez, S., Rouppe van der Voort, L., Bonet, J. A., Martínez Pillet, V., Van Noort, M., & Katsukawa, Y. 2008, ApJ, 679, 900
- Wang & Zirin (1992) Wang, H., & Zirin, H. 1992, Sol. Phys., 140, 41
- Zhao et al. (2001) Zhao, J., Kosovichev, A. G., & Duvall, T. L. 2001, ApJ, 557, 384
- Zhao et al. (2010) Zhao, J., Kosovichev, A. G., & Sekii, T. 2010, ApJ, 708, 304
- Zuccarello et al. (2009) Zuccarello, F., Romano, P., Guglielmino, S. L., Centrone, M., Criscuoli, S., Ermolli, I., Berrilli, F., & Del Moro, D. 2009, A&A, 500, L5