Discrimination of and / interactions in a TeO2 bolometer
Abstract
TeO2 crystals have proven to be superb bolometers for the search of neutrinoless double beta decay in many respects. However, if used alone, they do not exhibit any feature that allows to discriminate an energy deposit from a one. This fact limits their ability to reject the background due to natural radioactivity and eventually affects the sensitivity of the search. In this paper we show the results of a TeO2 crystal where, in coincidence with its bolometric heat signal, also the luminescence light escaping the crystal is recorded. The results show that we are able to measure the light produced by particles, which can be explained as due to Cerenkov emission. No light is detected from particles, allowing the rejection of this background source.
keywords:
neutrino mass , double beta decay , bolometers , Cerenkov detectorPACS:
14.60.Pq , 23.40.-s, 07.57.Kp , 29.40.Ka1 Introduction
Mysteries about neutrinos are several and of different nature. We know that they are neutral particles with an extraordinary little mass compared to the one of all the other particles. Although they are massive, we have not succeeded yet in measuring their mass. We do not know if the neutrino is a particle different from its antiparticle or rather, as hypothesized by Majorana [1], they are the same particle. Majorana observed that the minimal description of spin 1/2 particles involves only two degrees of freedom and that such a particle, absolutely neutral, coincides with its antiparticle. If the Majorana conjecture holds, then it can be possible to observe an extremely rare process called neutrinoless double beta decay (0DBD) [2]. In the 0DBD a nucleus decays into another nucleus emitting two electrons and no anti-neutrino, thus violating the total lepton number. The decay is mediated by the exchange between two vertexes of a neutrino, which controls the decay rate through its mass ().
The signature of this process is a monochromatic line at the Q-value of the decay in the sum energy spectrum of the two electrons. The sensitivity of an experiment to the 0DBD half-life goes as:
| (1) |
It is clear that increasing the isotopic abundance () and the efficiency of the signal () will end up in a linear gain on the sensitivity. Detector mass () and time (), on the other hand, contribute only as the square root, as well as background level () and energy resolution (). The experimental investigation of this process definitely requires a large amount of DBD emitter, in ultra-low background detectors with the capability of selecting reliably the signal from the background. The bolometric technique offers several advantages and it has been demonstrated viable by the CUORICINO [3] detector in such a convincing way that a 1-ton scale experiment, CUORE [4], is now in construction. Bolometers are low-temperature-operated particle detectors which provide superior energy resolution, lower energy thresholds and broader material choice than any other conventional device. They can be thought as perfect calorimeters, able to fully thermalize the energy released by a particle. Up to now, the choice for bolometers as 0DBD detectors has fallen on natural TeO2 crystals that have very good mechanical and thermal properties together with a very large content of the candidate isotope 130Te (34.2 isotopic abundance [5]). CUORE will be made of 988 TeO2 bolometers of 750 g each, featuring an energy resolution of 5 keV FWHM at the Q-value of the decay, which is around 2527 keV [6].
Bolometer-based 0DBD searches require however extremely low levels of background. Even if the background arising from radioactive contaminants in the bolometers themselves is reduced drastically, there is still the problem of the surrounding materials. Surface contamination is of particular concern. particles, arising from radioactive contaminations located on the surfaces of the detector or of passive elements facing them, can lose part of their energy in a few microns and deposit the rest in a detector. This produces an essentially flat background that affects also the Region of Interest (ROI) around the 0DBD Q-value [7]. The expected background in CUORE is about 0.001 counts/(keV kg y) from interactions () and between 0.01 and 0.04 counts/(keV kg y) from ’s (). Because of the background the 1- sensitivity of CUORE to 0DBD, assuming 5 y of data taking, is limited to [4]:
| (2) |
To cover the entire space of the parameters allowed for the inverted hierarchy of neutrino masses ( meV) [2], the sensitivity must be at least y, estimate obtained by averaging the Nuclear Matrix Elements of Ref. [8].
Although TeO2 crystals are extremely good bolometers, the shape of the bolometric response does not allow any discrimination of particle signals with respect to ’s ones [9]. The natural way to discriminate this background would be to use a scintillating bolometer [10]. In such a device the simultaneous and independent read out of the heat and the scintillation light permits to discriminate events due to , and neutrons thanks to their different scintillation yield. For what is known to date, at bolometric temperatures (10 mK), TeO2 crystals do not scintillate. The advantage, however, offered by this material in terms of bolometric performances and natural isotopic abundance are a strong motivation to pursue another, even if extremely challenging, option: the read-out of the Cerenkov light emitted in interactions (and not in ones). This possibility has been pointed out in Ref. [11] and this phenomenon may explain what has been reported in Ref. [12]. The Cerenkov light emitted in visible wavelengths is predicted to be about 350 eV at the 0DBD Q–value (2.5 MeV). This value is extremely low compared to usual scintillating bolometers, which emit tens of keV at the same energy.
In this paper we report the observation of light emitted by electrons in a TeO2 bolometer, which allows the discrimination of interactions from interactions. The amount of light is compatible with the Cerenkov emission, even though the scintillation hypothesis cannot be discarded. The outline of this paper is the following: in Section 2 the experimental set-up is described, in Section 3 the data analysis is presented, in Section 4 the results are given and in Section 5 their potential impact on future experiments is discussed.
2 Experimental set–up
We operated as bolometer a 3.02.42.8 cm3 TeO2 crystal, whose weight was 116.65 g. The crystal was doped with natural samarium, which contains 15% of 147Sm, a long living isotope (T1/2 = 1.071011 y [13]) that undergoes decay with a Q–value of 23101 keV [14]. This decay allowed a direct analysis of the behavior of ’s in an energy region close to the 0DBD. The details about the crystal growth and the doping process can be found in Ref. [15].
To detect light, we faced to the TeO2 crystal a high sensitivity dark bolometer [16]. The light detector (LD) consisted of a 66 mm diameter 1 mm thick pure Ge crystal, covered with a 600 layer of SiO2 to ensure good light absorption. A reflecting foil (3M VM2002) was placed around the TeO2 crystal to enhance the light collection.
The temperature sensor of the TeO2 crystal was a Neutron Transmutation Doped (NTD) germanium thermistor [17] of 31 mm3, thermally coupled to the crystal surface by means of 9 epoxy glue spots of about 0.6 mm diameter and 50 m height. The LD was equipped with two NTD-Ge thermistors of 31.50.4 mm3, labeled as L1 and L2. The TeO2 crystal and the LD were held in a copper structure by Teflon (PTFE) supports, thermally coupled to the mixing chamber of a dilution refrigerator which kept the system at a temperature of about 10 mK.
The detector was operated deep underground in the Gran Sasso National Laboratories in Italy, in the CUORE RD cryostat. One of the purposes of the test was to assess the performances of light detectors for the LUCIFER RD on scintillating bolometers [18].
The read–out of the thermistors was performed via a cold pre–amplifier stage, located inside the cryostat, and a second amplification stage, located on the top of the cryostat at room temperature. After the second stage, the signals were filtered by means of an anti-aliasing 6-pole active Bessel filter (120 db/decade), and then fed into a NI PXI-6284 analog-to-digital converter operating at a sampling frequency of 2 kHz. The Bessel cutoff was set at 120 Hz on L1 and L2, and at 80 Hz on the TeO2. The details of the cryogenic facility and of the electronics can be found in [19, 20, 21].
The trigger was software generated on each bolometer. When it fired, waveforms 2 s long were saved on disk. If the trigger fired on the TeO2, waveforms from L1 and L2 were anyhow saved, irrespective of their trigger. To maximize the signal to noise ratio, waveforms were processed offline with the optimum filter algorithm [22]. The main parameters of the bolometers are reported in Tab. 1. The rise and decay times of the pulses are computed as the time difference between the 10% and the 90% of the leading edge, and the time difference between the 90% and 30% of the trailing edge, respectively. The intrinsic energy resolution of the detector is evaluated from the fluctuation of the detector noise, after the application of the optimum filter.
| [V/MeV] | [keV RMS] | [ms] | [ms] | |
|---|---|---|---|---|
| TeO2:Sm | 43 | 1.31 | 15 | 116 |
| Ge (L1) | 1.1103 | 0.127 | 3 | 5 |
| Ge (L2) | 2.3103 | 0.097 | 3 | 10 |
3 Data collection and analysis
We collected 18.5 days of data. The detector was exposed to a 232Th source placed outside the cryostat for 7.7 additional days, to provide statistics to the sample, and to perform the energy calibration of the TeO2 bolometer. The measured energy spectra with the source (calibration data) and without the source (background data) are shown in Fig. 1.
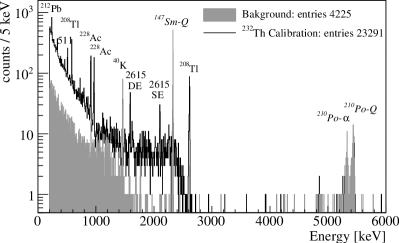
The peak at 2310 keV corresponds to the decay of 147Sm. The two peaks around 5400 keV are due to the decay of 210Po, a contaminant of the TeO2 crystal. The remaining peaks are ’s from the 232Th source, except for the peak at 1461 keV, which is a from 40K contamination of the cryostat. Both the single escape peak (SE) and the double escape peak (DE) of the 2615 keV from 208Tl are visible. The DE is of particular interest because it is a single site production of ’s (and ’s), like the 0DBD.
The LD was permanently exposed to a 55Fe source, placed on the LD surface opposite to the TeO2 crystal. The source produces two X-rays at 5.9 and 6.5 keV, which are used for the absolute calibration of the bolometer.
Signals from the TeO2 are very large compared to the noise, which is 1.3 keV RMS, and the signal amplitude is simply estimated from the maximum of the filtered signal. On the LD we expect very small amounts of light from the TeO2 crystal. As said previously, the energy released by Cerenkov light in visible wavelengths is predicted to be 350 eV at 2.5 MeV [11], and the collection efficiency, not precisely evaluated, is in the range 10-60%. The signal from the LD is therefore at the level of the noise, which is 127 eV RMS on L1 and 97 eV RMS on L2. We applied the maximum search algorithm to the LD waveforms and we were not able to detect signals. Irrespective of the energy released in the TeO2, in fact, we measured a constant pedestal at about 350 eV.
To increase the sensitivity of the LD we developed a new method which leads to a lowering of the energy threshold by about a factor 4 with respect to the maximum search algorithm [23]. The method can be summarized as follows. Both TeO2 and LD bolometers respond in milliseconds, a time which is orders of magnitude greater than that of the process of light emission. The time delay between the two signals depends only on the differences between the thermal and electronic responses of the two bolometers, and therefore is fixed. Instead of looking for a maximum, we take the value of the LD filtered waveform at a fixed time delay with respect to the signal found on the TeO2. To estimate the time delay, we selected events generated by particles traversing at the same time the LD and the TeO2. In these events the signals are greater than 200 keV on both bolometers, allowing an easy identification of the pulses.
4 Results
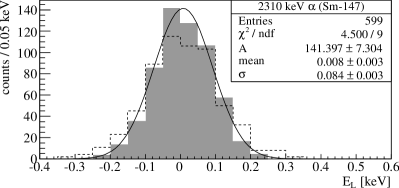
We use the calibration data to estimate the light emitted from interactions, and the background data to estimate the light from interactions. The distributions of the light measured using thermistor L2 for the two peaks close to the 0DBD energy, the -ray at 2615 keV and the decay at 2310 keV, are shown in Fig. 2.
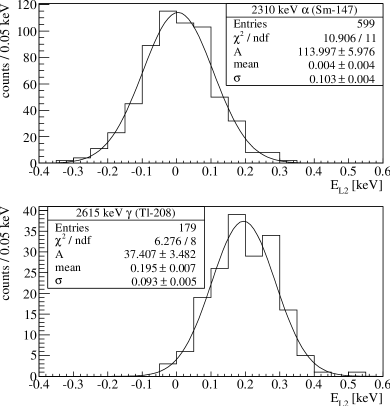
The average energy is eV for the -ray and eV for the decay, and the resolutions are compatible with the intrinsic resolutions reported in Tab. 1.
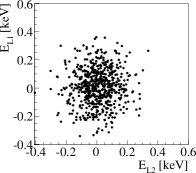
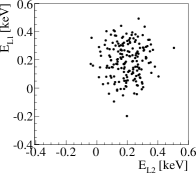
The results obtained using thermistor L1 in place of L2 are similar, even though the energy resolution of L1 is worse by approximately 30%. The correlation between the energies measured by the two thermistors is negligible (Fig. 3), implying that the resolution is dominated by the noise from some component of the read-out system and not by the germanium slab.
To improve the energy resolution, we combine the energies measured by the two thermistors into an unique energy estimator:
| (3) |
where . The resolution on the peak improves from eV to eV (Fig. 4).
The distribution of versus particle energy is shown in Fig. 5. The peaks in the background data (top) and in the calibration data (middle) are used to estimate the light emitted by interactions and decays, respectively. We estimate the average light of each peak, , by means of Gaussian fits, fixing the variance of the Gaussian to the value estimated on the 147Sm peak, and we perform separate linear fits for ’s and ’s to the distribution of versus energy (bottom of the figure):
| (4) |
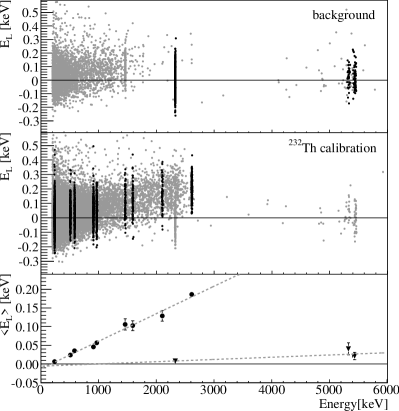
The results of the linear fits are reported in Tab. 2. The value of is compatible with zero within two standard deviations, which is expected if the light we detect from interactions is due to Cerenkov radiation. The line interpolating the ’s indicates that the 2615 keV DE peak, which is actually due to interactions, behaves like peaks. From the line parameters we evaluate the threshold on the particle energy, , to be keV.
| [eV] | [eV/ MeV] | [%] | /ndf | |
|---|---|---|---|---|
| -93 | 1/1 | |||
| -76 | 11/7 |
Although the energy threshold for Cerenkov emission by an electron in TeO2 is about 50 keV, the value we measure is compatible with the fact that in interactions multiple electrons are produced. The scintillation hypothesis, however, cannot be ruled out completely, since we cannot measure the wavelenght spectrum, nor the time characteristics of the light signal. Moreover the light from ’s (if any) could be even smaller than what we measure, since cross talks in the electronics cannot be excluded at this level of precision.
5 Perspectives
We study the improvements that can be obtained with an experiment like CUORE, but equipped with light detectors. The light emitted from ’s is considered null independently of the particle energy. The light emitted from ’s follows Eq. 4, which implies for a with 0DBD energy eV. By applying a threshold on the detected light (), the background is reduced by a factor . The threshold affects also the 0DBD signal and the background, reducing them by a different factor, . The sensitivity of the experiment is then modified as follows:
| (5) |
The value of which maximizes , assuming and , is found to be 148 eV, corresponding to y.
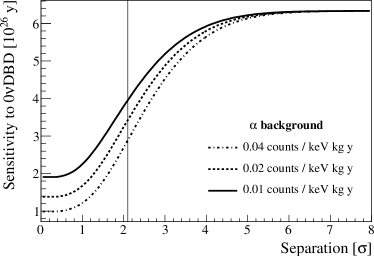
We define the separation of the 0DBD from ’s as the distance of from zero energy in units of the energy resolution. In Fig. 6 we show as a function of the separation for an experiment equal to CUORE, but equipped with light detectors, for different values of the background. The separation obtained in this work is . The sensitivity plateau is reached when the separation is greater than , i.e. about a factor 2 higher than the present work. The sensitivity would then be from 3 to 6 times higher than in CUORE, depending on the amount background that will be present.
The separation can be improved by reducing the noise, which seems dominated by the read-out of the bolometer (thermistor, cables or electronics). It can also be improved by increasing the efficiency of light collection. If the Cerenkov hypothesis is confirmed, in fact, about the of the light is emitted in the UV range, a region where the reflectivity of the foil we used (VM2002 from 3M) is less than . Wide band reflectors, like PTFE and alluminium, should substantially increase the amount of light detected.
If this technique could be complemented with a 95 enrichment of the crystals in 130Te, an additional factor 3 could be gained, projecting the final sensitivity to the desired value of y, capable of probing as low as 20 meV.
6 Acknowledgments
The project LUCIFER has received funding from the European Research Council under the European Union s Seventh Framework Programme (FP7/2007-2013) / ERC grant agreement n. 247115.
References
- [1] E. Majorana, Il Nuovo Cimento 14 171 (1937).
- [2] F. T. Avignone, S. R. Elliott and J. Engel, Rev. Mod. Phys. 80 481 (2008).
- [3] E. Andreotti et al., Astropart. Phys. 34 822 (2011).
-
[4]
R. Ardito et al. arXiv:hep-ex/0501010 (2005);
C. Arnaboldi et.al, Nucl. Instrum. Meth. A 518 775 (2004). - [5] M. A. Fehr, M. Rehkamper and A. N. Halliday, Int. J. Mass Spectrom. 232 83 (2004).
- [6] M. Redshaw, B. J. Mount, E. G. Myers and F. T. Avignone, Phys. Rev. Lett. 102 12502 (2009).
- [7] M. Pavan et al., Eur. Phys. J. A 36 159 (2008).
-
[8]
J. Barea and F. Iachello, Phys. Rev. C 79 044301 (2009);
F. Simkovic et al., Phys. Rev. C 77 045503 (2008);
O. Civitarese and J. Suhonen, J. Phys. Conf. Ser. 173 012012 (2009). - [9] C. Arnaboldi et al. Astropart. Phys. 34 797 (2011).
- [10] S. Pirro et al. Phys. Atom. Nucl. 69 2109 (2006).
- [11] T. Tabarelli de Fatis, Eur. Phys. J. C 65 359 (2010).
- [12] N. Coron et al., Nucl. Instrum. Meth. A 520 159 (2004).
- [13] K Kossert, G. Jörg, O. Nähle and C. L. V. Gostomski, Appl. Radiat. Isotopes 67 1702 (2009).
- [14] M. C. Gupta and R. D. MacFarlane, J. Inorg. Nucl. Chem. 32 3425 (1970).
- [15] F. Bellini et al., JINST 5 P12005 (2010).
- [16] S. Pirro et al., Nucl. Instrum. Meth. A 559 361 (2006).
- [17] E. E. Haller et al., in Neutron transmutation doping of semiconducting materials, edited by R.D. Larrabee (Plenum Press, New York, 1984), p. 21.
- [18] F. Ferroni, J. Phys. Conf. Ser. 293 012005 (2011).
- [19] S. Pirro, Nucl. Instrum. Meth. A 559 672 (2006).
- [20] C. Arnaboldi, G. Pessina and S. Pirro, Nucl. Instrum. Meth. A 559 826 (2006).
- [21] C. Arnaboldi et al., Nucl. Instrum. Meth. A 520 578 (2004).
- [22] E. Gatti and P.F. Manfredi, Riv. Nuovo Cimento 9 1 (1986).
- [23] G. Piperno, S. Pirro and M. Vignati, A data analysis method to lower the energy threshold of light detectors coupled to scintillating bolometers, paper in preparation.