Towards two-dimensional search engines
Abstract
We study the statistical properties of various directed networks using ranking of their nodes based on the dominant vectors of the Google matrix known as PageRank and CheiRank. On average PageRank orders nodes proportionally to a number of ingoing links, while CheiRank orders nodes proportionally to a number of outgoing links. In this way the ranking of nodes becomes two-dimensional that paves the way for development of two-dimensional search engines of new type. Statistical properties of information flow on PageRank-CheiRank plane are analyzed for networks of British, French and Italian Universities, Wikipedia, Linux Kernel, gene regulation and other networks. A special emphasis is done for British Universities networks using the large database publicly available at UK. Methods of spam links control are also analyzed.
pacs:
89.75.Fb, 89.75.Hc, 89.20.Hh1 Introduction
During the last decade the modern society developed enormously large communication networks. The well known example is the World Wide Web (WWW) which starts to approach to webpage [1]. The sizes of social networks like Facebook [2] and VKONTAKTE [3] also become enormously large reaching 600 and 100 millions user pages respectively. The information retrieval from such huge data bases becomes the foundation and main challenge for search engines [4, 5]. The fundamental basis of Google search engine is the PageRank algorithm [6]. This algorithm ranks all websites in a decreasing order of components of the PageRank vector (see e.g. detailed description at [7], historical surveys of PageRank are given at [8, 9]). This vector is a right eigenvector of the Google matrix at the unit eigenvalue, it is constructed on the basis of the adjacency matrix of the directed network, its components give a probability to find a random surfer on a given node.


The Google matrix of a directed network with nodes is given by
| (1) |
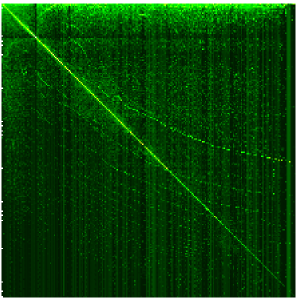
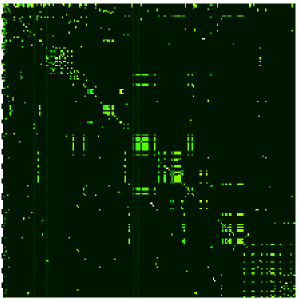
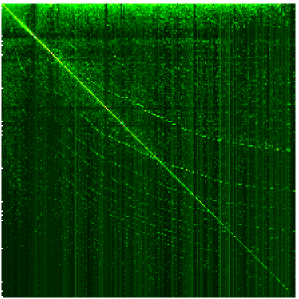
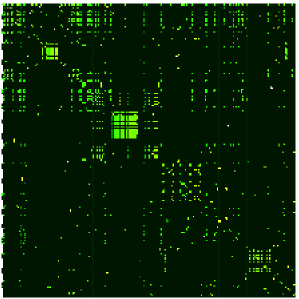
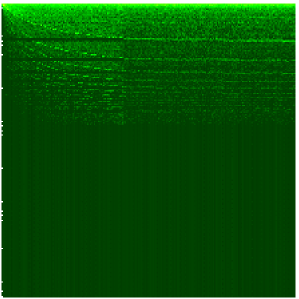
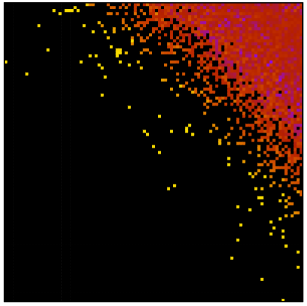
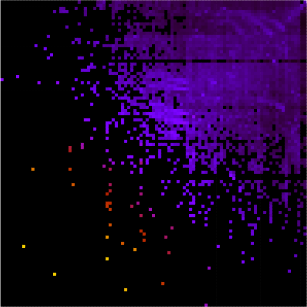
where the matrix is obtained by normalizing to unity all columns of the adjacency matrix , and replacing columns with zero elements by . An element of the adjacency matrix is equal to unity if a node points to node and zero otherwise. The damping parameter in the WWW context describes the probability to jump to any node for a random surfer. The value gives a good classification for WWW [7] and thus we also use this value here. A few examples of Google matrix for various directed networks are shown in Fig. 1. The matrix belongs to the class of Perron-Frobenius operators [7], its largest eigenvalue is and other eigenvalues have . The right eigenvector at gives the probability to find a random surfer at site and is called the PageRank. Once the PageRank is found, all nodes can be sorted by decreasing probabilities . The node rank is then given by index which reflects the relevance of the node . The PageRank dependence on is well described by a power law with . This is consistent with the relation corresponding to the average proportionality of PageRank probability to its in-degree distribution where is a number of ingoing links for a node [10, 7]. For the WWW it is established that for the ingoing links (with ) while for out-degree distribution of outgoing links a power law has the exponent [11, 12]. Similar values of these exponents are found for the WWW British university networks [13], the procedure call network (PCN) of Linux Kernel software introduced in [14] and for Wikipedia hyperlink citation network of English articles (see e.g. [15]).
The PageRank gives at the top the most known and popular nodes. However, an example of the Linux PCN studied in [14] shows that in this case the PageRank puts at the top certain procedures which are not very important from the software view point (e.g. printk). As a result it was proposed [14] to use in addition another ranking taking the network with inverse link directions in the adjacency matrix corresponding to and constructing from it an additional Google matrix according to relation (1) at the same . The eigenvector of with eigenvalue gives then a new inverse PageRank with ranking index . This ranking was named CheiRank [15] to mark that it allows to chercher l’information in a new way (that in English means search the information in a new way). Indeed, for the Linux PCN the CheiRank gives at the top more interesting and important procedures compared to the PageRank [14] (e.g. start_kernel). While the PageRank ranks the network nodes in average proportionally to a number of ingoing links, the CheiRank ranks nodes in average proportionally to a number of outgoing links. The physical meaning of PageRank vector components is that they give the probability to find a random surfer on a given node when a surfer follows the given directions of network links. In a similar way the CheiRank vector components give the probability to find a random surfer on a given node when a surfer follows the inverted directions of network links. Since each node belongs both to CheiRank and PageRank vectors the ranking of information flow on a directed network becomes two-dimensional. We note that there have been earlier studies of PageRank of the Google matrix with inverted directions of links [16, 17], but no systematic analysis of statistical properties of 2DRanking was presented there.
An example of variation of PageRank probability with and CheiRank probability with are shown in Fig. 2 for the WWW network of University of Cambridge in years 2006 and 2011. Other examples for PCN Linux Kernel and Wikipedia can be find in [14, 15]. Detailed parameters of networks which we analyze in this paper and their sources are given in Appendix.

A detailed comparative analysis of PageRank and CheiRank two-dimensional classification was done in [15] on the example of Wikipedia hyperlink citation network of English articles. It was shown that CheiRank highlights communicative property of nodes leading to a new way of two-dimensional ranking. While according to the PageRank top three countries are 1. USA, 2. UK, 3. France the CheiRank gives 1.India, 2.Singapore, 3.Pakistan as most communicative Wikipedia country articles. Top 100 personalities of PageRank has the following percents in 5 main category activities 58 (politics), 10 (religion), 17 (arts), 15 (science), 0 (sport) [15]. Clearly the significance of politicians is overestimated. In contrast, the CheiRank gives more balanced distribution over these categories with 15, 1, 52, 16, 16 respectively. It allows to classify information in a new way finding composers, architects, botanists, astronomers who are not well known but who, for example, discovered a lot of Australians butterflies (George Lyell) or many asteroids (Nikolai Chernykh). These two persons appear in the large Listings of Australians butterflies and in the Listing of Asteroids (since they discovered many of them) and due to that they gain high CheiRank values. This shows that the information retrieval, which uses both PageRank and CheiRank, allows to rank nodes not only by an amount of their popularity (how known is a given node) but also by an amount of their communicative property (how communicative is a given node). This 2DRanking was also applied to the brain model of neuronal network [18] and the business process management network [19] and it was shown that it gives a new useful way of information treatment in these networks. The 2DRanking in the PageRank-CheiRank plane also naturally appears for the world trade network corresponding to import and export trade flows [20]. Thus the 2DRanking based on PageRank and CheiRank paves the way to a development of 2D search engines which can become more intelligent than the present Google search based on 1D PageRank algorithm.
In this work we study the statistical properties of such a 2DRanking using examples of various real directed networks including the WWW of British, French and Italian University networks [21], Wikipedia network [15], Linux Kernel networks [14, 22], gene regulation networks [23, 24] and other networks. The paper is constructed as following: in Section 2 we study the properties of node density in the plane of PageRank and CheiRank, in Section 3 the correlator properties between PageRank and CheiRank vectors are analyzed for various networks, information flow on the plane of PageRank and CheiRank is analyzed in Section 4, methods of control of SPAM outgoing links are discussed in Section 5, 2DRanking applications for the gene regulation networks are considered in Section 6, discussion of results is presented in Section 7. The parameters of the networks and references on their sources are given in Appendix.
2 Node Density of 2DRanking


A few examples of the Google matrix for four directed networks are shown in Fig. 1. There is a significant similarity in the global structure of for Universities of Cambridge and Oxford with well visible hyperbolic curves (left column) even if at small scales the matrix elements are rather different (right column) in these two networks (see Fig. 1). Such hyperbolic curves are also visible in the Google matrix of Wikipedia (left column) even if here they are less pronounced due to much larger averaging inside the cells which contain about times larger number of nodes (see network parameters in Appendix). We make a conjecture that the appearance of such curves is related to existence of certain natural categories existing in the network, e.g. departments for Universities or countries, cities, personalities etc for Wikipedia. We expect that there are relatively more links inside a given category compared to links between categories. However, this is only a statistical property since on small scales at small values the hyperbolic curves are not visible (right column in Fig. 1). Hence, more detailed studies are required for verification of this conjecture. At small scale matrix of Wikipedia is much more dense compared to the cases of Cambridge and Oxford (right column). We attribute such an increase of density of significant matrix elements to a stronger connectivity between nodes with large in Wikipedia compared to the case of universities where the links have more hierarchical structure. Partially this increase of density can be attributed to a larger number of links per node in the case of Wikipedia but this increase by a factor is not so strong and cannot explain all the differences of densities at small scale. For Wikipedia there is about 20% of nodes at the bottom of the matrix where there are almost no links. For PCN of Linux Kernel this fraction becomes significantly larger with about 60% of nodes. The hyperbolic curves are still well visible for Linux PCN inside remaining 40% of nodes. On a small scale the density of matrix elements for Linux is rather small compared to the three previous cases. We attribute this to a much smaller number of links per node which is by factor 5 smaller for Linux compared to the university networks of Fig. 1 (see data in Appendix).
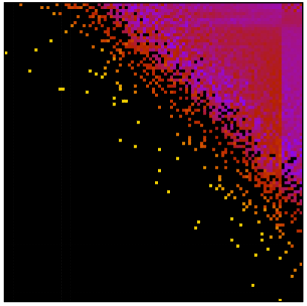
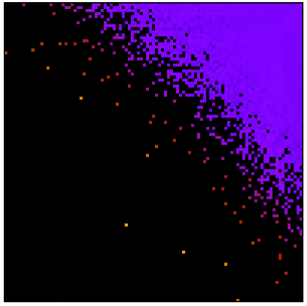

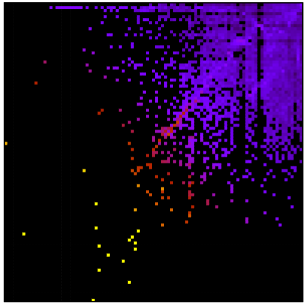
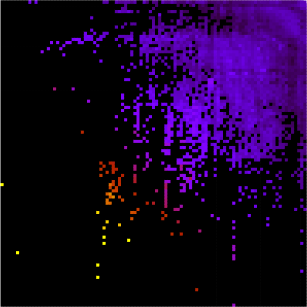
The distributions of density of nodes in the plane of PageRank and CheiRank in log-scale are shown for four networks of British Universities in Fig. 3. Here is a number of nodes in a cell of size (see detailed description in [15]). Even if the coarse-grained matrices for Cambridge and Oxford look rather similar the density distributions in plane are rather different. The density distributions for all four universities clearly show that nodes with high PageRank have low CheiRank that corresponds to zero density at low , values. At large , values there is a maximum line of density which is located not very far from the diagonal . The presence of such a line should correspond to significant correlations between and vectors that will be discussed in more detail in next Section. The presence of correlations between and leads to a probability distribution with one main maximum along a diagonal at . This is similar to the properties of density distribution for the Wikipedia network discussed in [15] (see also bottom right panel in Fig. 13 below).
The density of nodes for Linux networks is shown in Fig. 4. In these networks the density is homogeneous along lines that corresponds to absence of correlations between and . Indeed, in absence of such correlations the distribution of nodes in , plane is given by the product of independent probabilities. In the log-scale format used in Fig. 4 this leads to a homogeneous density of nodes in the top right corner of plane as it was discussed in [15] (see right panel in Fig. 4 there). Indeed, the distributions in Fig. 4 are very homogeneous inside top-right triangle. We note that, a part of fluctuations, the distributions remain rather stable even if the size of the network is changed by factor 20 from V2.0 to V2.6 version. The physical reasons for absence of correlations between and have been explained in [14] on the basis of the concept of ”separation of concerns” used in software architecture. As discussed in [14], a good code should decrease a number of procedures that have high values of both PageRank and CheiRank since such procedures will play a critical role in error propagation since they are both popular and highly communicative at the same time. For example in the Linux Kernel, do_fork(), that creates new processes, belongs to this class. These critical procedures may introduce subtle errors because they entangle otherwise independent segments of code. The above observations suggest that the independence between popular procedures, which have high and fulfill important but well defined tasks, and communicative procedures, which have high and organize and assign tasks in the code, is an important ingredient of well structured software. We discuss the properties of PageRank-CheiRank correlations in the next Section.
3 Correlations between PageRank and CheiRank
The correlations between PageRank and CheiRank can be quantitatively characterized by the correlator
| (2) |
Such a correlator was introduced in [14] for and we will use the same notation . This correlator at shows if there are correlations and dependencies between PageRank and CheiRank vectors. Indeed, for homogeneous vectors we have corresponding to absence of correlations. We will see below that the values of are very different for various directed networks. Hence, this new characteristic is able to distinguish various types of networks even if they have rather similar algebraic decay of PageRank and CheiRank vectors.
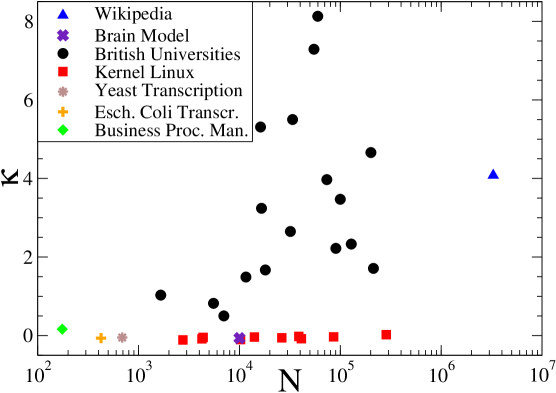
The values of for networks of various size are shown in Fig. 5. The two types of networks are well visible according to these data. The human created university and Wikipedia networks have typical values of in the range . Other networks like Linux PCN, Gene Transcription networks, brain model and business process management networks have .

The dependence of on the correlation “time” is shown in Fig. 6. For the PCN of Linux there are no correlations at any while for the university networks we find that the correlator drops to small values with increase of (e.g. ) even if at certain rather large values of significant values of correlator can reappear.

It is interesting to see what are typical values of contributions in the correlator sum (2) at . The distribution of values for a few networks are shown in Fig. 7. All of them follow a power law with an exponent 1.23 for PCN Linux, Wikipedia and Univ. of Cambridge (2006) and (2011). We note that further studies are required to obtain analytically the values of the exponent . In the later two cases the exponent and the distribution shape remains stable in time, however, in 2011 there appear few nodes with very large values which give a significant increase of the correlator from (in 2006) up to (in 2011). It is possible that such a situation can appear if it is imposed that practically any page points to the main university page which may have rather high CheiRank due to many outgoing links to other departments and university divisions. We suppose that these are also the reasons due to which we have appearance of large values of in University networks. At the same time more detailed studies are required to clarify the correlation properties on directed networks of a deeper level. We will return to a discussion of university networks collected in 2011 in Section 7.
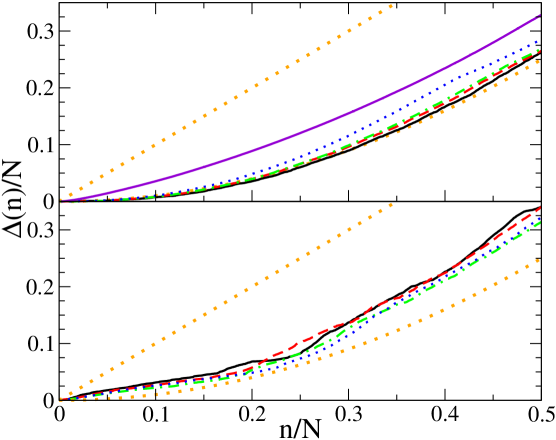
Another way to analyze the correlations between PageRank and CheiRank is simply to count the number of nodes inside a square . For a totally correlated distribution with we have while in absence of correlations we should have points homogeneously distributed inside a square that gives . The dependence of such point-count correlator on size is displayed in Fig. 8 for various networks. These data clearly show that the Linux PCN is uncorrelated being close to the limiting uncorrelated dependence while Wikipedia and British University networks show intermediate strength of correlations being between the two limiting functions of .
4 Information flow of 2DRanking
According to 2DRanking all network nodes are
distributed on a two-dimensional plane .
The directed links of the network create an
information flow in this plane. To visualize
this flow we use the following procedure:
a) each node is represented by one point in the plane;
b) the whole space is divided in equal size
cells with indexes with the
number of nodes inside each cell being ,
in Fig. 9 we use cells of equal size in usual (left column)
and logarithmic (right column) scales;
c) for each node inside the cell , pointing to any other cell
, we compute the vector and
average it over all nodes inside the cell
(the weight of links is not taken into account);
d) we put an arrow centered at with the modulus and direction
given by the average vector computed in c).

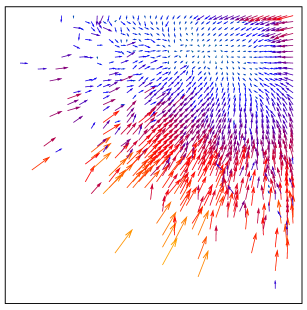
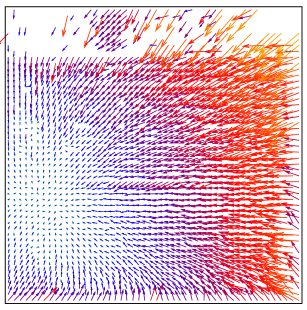
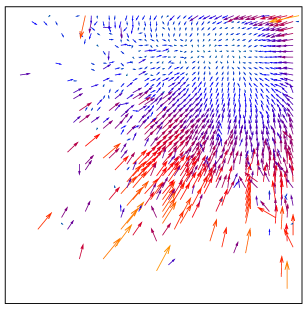
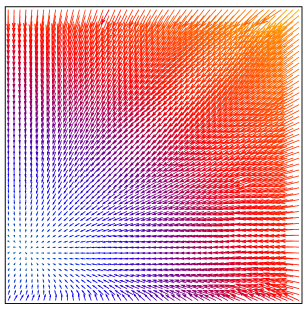
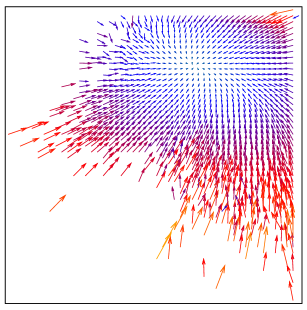
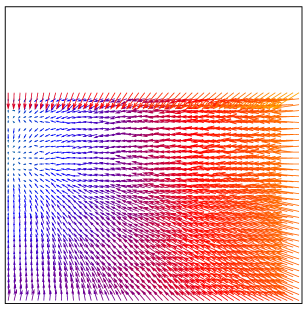

Examples of such average flows for the networks of Fig. 1 are shown in Fig. 9. All flows have a fixed point attractor. The fixed point is located at rather large values that is due to the fact that in average nodes with maximal values point to lower values. At the same time nodes with very small still point to some nodes which have larger values of that places the fixed point at certain intermediate values. We note that the analyzed directed networks have dangling nodes which have no outgoing links, the fraction of such nodes is especially large for the Linux network. Due to absence of outgoing links we obtain an empty white regions in the information flow shown in Fig. 9. A more detailed analysis of statistical properties of information flows on PageRank-CheiRank plane requires further studies.
5 Control of spam links
For many networks ingoing and outgoing links have their own importance and thus should be treated on equal grounds by PageRank and CheiRank as it is described above. However, for the WWW it is more easy to manipulate outgoing links which are handled by an owner of a given web page, while ingoing links are handled by other users. This requires to introduce some level of control on the outgoing links which should be taken into account for the ratings. Since it is very easy to create links to highly popular sites, we will call “spam links” links for which the destination site is much more popular than the source. A quantitative measure of popularity can be provided by the PageRank of the sites. We do not think that spam links are frequent in networks like such as procedure calls in the Linux kernel, Wikipedia and gene regulation. Even for University networks we think that there are no much reasons to put spam links inside the university domain. However, for a large scale WWW an excessive number of such spam links can become harmful for the network performance. However, for WWW networks spam links are probably more widespread. Some websites may try to improve their rating by carefully choosing their outgoing links. Also it is a common policy to have links back to a website’s root pages to facilitate navigation. Naturally, a good rating should not be sensitive to the presence of such links. Thus it is important to treat spam-links appropriately in order to construct a two dimensional web-search engine. Below we propose a method for spam links control and test it on an example of the Wikipedia network which has the largest size among networks analyzed in this paper. We stress that this is done as a test example and not because we think that there are spam links between Wikipedia articles.

With this aim we propose the following filter procedure for computation of CheiRank. The standard procedure described above is to invert the directions of all links of the network and then to compute the CheiRank. The filter procedure inverts a link from to only if where is some positive filter parameter. After a such inversion of certain links, while other links remain unchanged, the matrix and are computed and the CheiRank vector of is determined in a usual way. From the definition it is clear that for there are no inverted links and thus after filtering is the same as the PageRank vector . In the opposite limit all links are inverted and is then the usual CheiRank discussed in previous sections. Thus intermediate values of allow to handle the properties of CheiRank depending on a wanted strength of filtering.
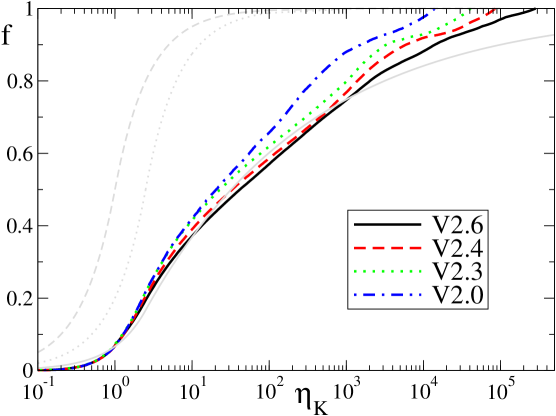
The dependence of the fraction of inverted links (defined as a ration between the number of inverted links to the total number of links) on the filter parameter is shown for various networks in Fig. 10. There is a significant jump of at for British University networks. In fact the condition corresponds approximately to the border relation with that marks the diagonal of the matrix shown in Fig. 1 which has a significant density of matrix elements. As a result for we have a significant increase of inversion of links leading to a jump of present in Fig. 10. The diagonal density is most pronounced for university networks so that for them the jump of is mostly sharp.
It is also convenient to consider another condition for link inversion defined not for but directly in the plane defined by the condition: links are inverted only if (where node points to node , ). In a first approximation we can assume that the links are homogeneously distributed in the plane of transitions from to . This density is similar to the density distribution of Google matrix elements shown in Fig. 1. For the homogeneous distribution the fraction of inverted links is given by an area of a triangle, which height is and the basis is , for . In a similar way we have for . We can generalize this distribution assuming that there are only links with , that is approximately the case for Linux network where (see Fig. 1 bottom row), and that inside this interval the density of links decreases as . Then after computing the area we obtain the expression for the fraction of inverted links valid for :
| (3) |
The comparison of this theoretical expression with the numerical data for Linux PCN is shown in Fig. 11. It shows that the data for Linux are well described by the theory (3) with and . The last value takes into account the fact that the density of links decreases with PageRank index as it is well visible in Fig. 1.
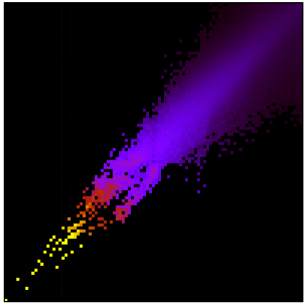
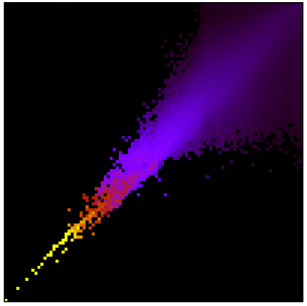
The variation of nodes density in the plane of PageRank and filtered CheiRank for the Wikipedia network is shown in Fig. 12 with the filtering by for and values. At moderate values the density is concentrated near diagonal, with further increase of a broader density distribution appears at large values which goes to smaller and smaller until the limiting distribution without filtering is established at very large . The top 100 Wikipedia articles obtained with filtered CheiRank at the above values of are given at [25]. We also give there top articles in 2DRank which gives articles in order of their appearance on the borders of a square of increasing size in plane (see detailed description in [15]). These data clearly show that filtering eliminates articles with many outgoing links and gives a significant modification of top CheiRank articles. Thus the described method can be efficiently used for control of spam links present at the WWW.
6 2DRanking of gene regulation networks
The method of 2DRanking described above is rather generic and can be applied to various types of directed networks. Here we apply it to gene regulation networks of Escherichia Coli and Yeast with the network links taken from [24]. Such transcription regulation networks control the expression of genes and have important biological functions [23].
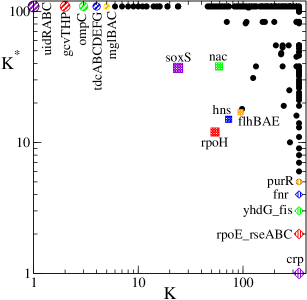
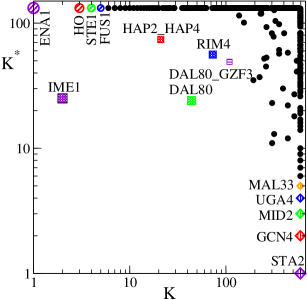
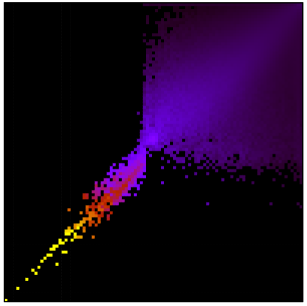
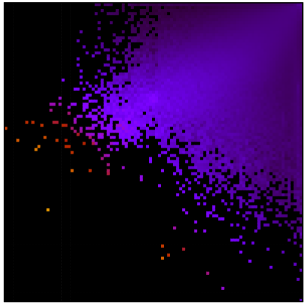
The distribution of nodes in PageRank-CheiRank plane is shown in Fig. 13. The top 5 nodes in CheiRank probability value (lowest CheiRank indexes) are those which send many outgoing orders, top 5 in PageRank probability are those which obtain many incoming signals and the top 5 indexes in 2DRank (with 5 lowest 2DRank index values) combine these two functions. For these networks the correlator is close to zero (even slightly negative) which indicates the statistical independence between outgoing and ingoing links quite similarly to the case of the PCN for the Linux Kernel. This may indicate that a slightly negative correlator is a generic property for the data flow network of control and regulation systems. Whether the obtained ratings can bring some insights on the functioning of gene regulation can only be assessed by experts in the field. However, we hope that such an analysis will prove to be useful for a better understanding of gene regulation networks.
7 Discussion
Above we presented extensive studies of statistical properties of 2DRanking based of PageRank and CheiRank for various types of directed networks. All studied networks are of a free-scale type with an algebraic distribution of ingoing and outgoing links with a usual values of exponents. In spite of that their statistical characteristics related to PageRank and CheiRank are rather different. Some networks have high correlators between PageRank and CheiRank (e.g. Wikipedia, British Universities), while others have practically zero correlators (PCN of Linux Kernel, gene regulation networks). The distribution of nodes in PageRank-CheiRank plane also varies significantly between different types of networks. Thus 2DRanking discussed here gives more detailed classification of information flows on directed networks.


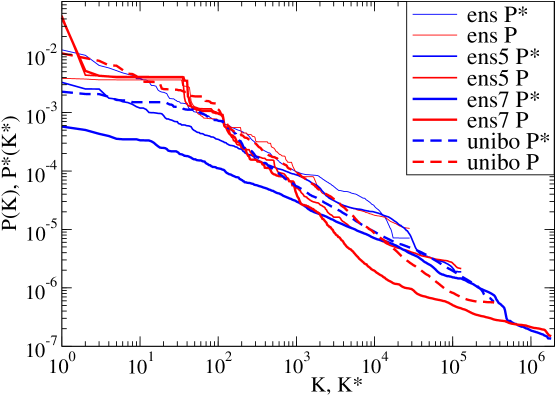
We think that 2DRanking gives new possibilities for information retrieval from large databases which are growing rapidly with time. Indeed, for example the size of the Cambridge network increased by a factor 4 from 2006 to 2011 (see Appendix and Fig. 2). At present, web robots start automatically generate new webpages. These features can be responsible for appearance of gaps in density distribution in plane at large values visible for large scale university networks of Cambridge and ENS Paris in 2011 (see Fig. 14). Such an automatic generation of links can change the scale-free properties of networks. Indeed, for ENS Paris we observe appearance of large step in the PageRank distribution shown in Fig. 15. This step for remains not sensitive to the deepness of crawling which goes on a level of and links. However, the CheiRank distribution changes with the deepness level becoming more and more flat (see Fig. 15). Such a tendency in a modification of network statistical properties is visible in 2011 for large size university networks, while networks of moderate size, like University of Bologna 2011 (see data in Figs. 14,15), are not yet affected. A sign of ongoing changes is a significant growth of the correlator value which increases up to very large value ( for Cambridge 2011 and for ENS Paris). There is a danger that automatic generation of links can lead to a delocalization transition of PageRank that can destroy efficiency of information retrieval from the WWW. We note that it is known that PageRank delocalization can appear in certain models of Markov chains and Ulam networks [26]. Such a delocalization of PageRank would make the ranking of nodes inefficient due to high sensitivity of ranking to fluctuations that would create a very dangerous situation for the WWW information retrieval and ranking. We also note that the spectrum of the Google matrix of British universities networks has been recently analyzed in [27]. The spectrum and eigenstates analysis can be a sensitive tool for location of precursors of a delocalization transition.
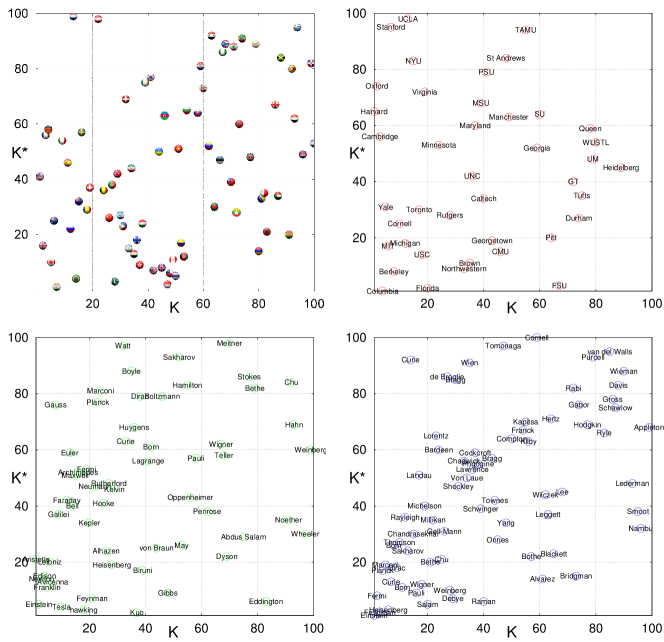
Our studies of 2DRanking pave the way to development of two-dimensional search engines which will use the advantages of both PageRank and CheiRank. Indeed, the Google search engine uses as the fundamental mathematical basis the one-dimension ranking related to PageRank [7]. Of course, there are various other important elements used by the Google search which remain the company secret and not only PageRank order matters for the Google ranking. However, the mathematical aspects of these additional elements are not really known (e.g. they are not described in [7]). At the same time the size of databases generated by the modern society continues its enormous growth. Due to that the information retrieval and ordering of such data sets becomes of primary importance and new mathematical tools should be developed to operate and characterize efficiently their information flows and ranking. Here we proposed and analyzed the properties the new two-dimensional search engine, which we call Dvvadi from Russian “dva (two)” and “dimension”, will use the complementary ranking abilities of both PageRank and CheiRank. Now the procedure of ordering of all network nodes uses not one but two vectors of the Google matrix of a network. The computational efforts are twice more expensive but for that we obtain a new quality since now the nodes are ranked in 2D plane not only by their degree of popularity but also by their degree of communicability. Thus for the Wikipedia network the top 3 articles in PageRank probability are 3 countries (most popular), while the top 3 articles in CheiRank probability are 3 listings of knowledge, state leaders and geographical places (most communicative). Hence, we can rank the nodes of the network in a new two-dimensional manner which highlight complementary properties of node popularity and communicability. Thus the Dvvadi search can present nodes not in a line but on a 2D plane characterizing these two complementary properties of nodes. Examples of such 2D representation of nodes selected from Wikipedia articles by a specific subject are shown in Fig. 16: we determine global and indexes of all articles, select a specific subject (e.g. countries) and then represent countries in the local index and corresponding to their appearance in the global order via PageRank and CheiRank. For countries we see a clear tendency that the countries on the top of PageRank probability (low ) have relatively high CheiRank index (high ) (e.g. US, UK, France) while small countries in the region have another tendency (e.g. Singapore). We attribute this to specific routes of cultural and industrial development of the world: e.g. Singapore was a colony of UK became a strong trade country and due to that have historically many links pointing to UK and other developed countries. For universities we also see that those at the top of PageRank (Harvard, Oxford, Cambridge) are not very communicative having high values, while Columbia, Berkeley are more balanced and Florida and FSU are very communicative probably due to initial location of Wikimedia Foundation at Florida. For physicists we see that links to many scientific fields (like Shen Kuo) or polularization of science (like Hawking and Feynman) place those people at the top positions of CheiRank. In a similar way for the Nobel laureates in physics we see that CheiRank stresses the communicative aspects: e.g. Feynman, due to his popularization of physics; Salam due to the Institute on his name at Trieste with a broad international activity; Raman due to Raman effect.
On the basis of the above results we think that PageRank-CheiRank classification of network nodes on 2D plane will allow to analyze the information flows on directed networks in a better way. It is also important to note that 2DRanking is very natural for financial and trade networks. Indeed, the world trade usually uses the import and export ranking which is analogous to PageRank and CheiRank, as it is shown in [20]. We think that such Dvvadi engine/motor [25] will find useful applications for treatment of enormously large databases created by modern society.
Appendix A Appendix
We list below the directed networks used in this work giving for them number of nodes , number of links and correlator between PageRank and CheiRank . Additional data can be find at [25].
Linux Kernel Procedure Call Networks are taken from [14]
(see also [22]) with the parameters for various
kernel versions shown in Table 1
-
version V1.0 2752 5933 V1.1 4247 9710 V1.2 4359 10215 V1.3 10233 24343 V2.0 14080 34551 V2.1 26268 59230 V2.2 38767 87480 V2.3 41117 89355 V2.4 85757 195106 V2.6 285510 588861
Web networks of British Universities dated by year 2006 are taken from [21], and are shown in Table 2.
-
University RGU (Abardeen) 1658 15295 Uwic (Wales) 5524 111733 NTU (Nottingham) 6999 143358 Liverpool 11590 141447 Hull 16176 236525 Keele 16530 117944 UCE (Birmingham) 18055 351227 Kent 31972 277044 East Anglia 33623 325967 Sussex 54759 804246 York 59689 414200 Bath 73491 541351 Glasgow 90218 544774 Manchester 99930 1254939 UCL (London) 128450 1397261 Oxford 200823 1831542 Cambridge (2006) 212710 2015265
We also developed a special code with which we performed crawling of university web networks in January - March 2011 with the parameters given below: University of Cambridge (2011) with , , ; École Normale Supérieure, Paris (ENS 2011) with , , (crawling deepness level of 3 links), , , (crawling deepness level of 5 links), , , (crawling deepness level of 7 links); University of Bologna with , , .
The data for hyperlink network of Wikipedia English articles (2009) are taken from [15] with , , .
Transcription Gene networks are taken from [24]. We have for them: Escherichia Coli with , , ; Yeast with , , ; for all links the weight is take to be the same.
Business Process Management network is taken from [19] with , , .
Brain Model network is taken from [18] with , , (unweighted), (weighted).
References
References
-
[1]
See, e.g.,
http://www.worldwidewebsize.com/ -
[2]
Facebook 2011 (February 17)
In Wikipedia, The Free Encyclopedia. Retrieved 13:23, from
http://en.wikipedia.org/w/index.php?title=\\Facebook\&oldid=414391918 -
[3]
Vkontakte. (2011, February 17). In Wikipedia,
The Free Encyclopedia. Retrieved 13:30, February 17, 2011, from
http://en.wikipedia.org/w/index.php?title=\\Vkontakte\&oldid=414344158 -
[4]
Web search engine. (2011, February 14).
In Wikipedia, The Free Encyclopedia. Retrieved 15:52, February 17, 2011
from
http://en.wikipedia.org/w/index.php?title=Web\_search\_engine\&oldid=413786199 - [5] Büttcher S, Clarke C L A and Cormack G V 2010 Information Retrieval. Implementing and Evaluating Search Engines, (Massachusetts: The MIT Press)
- [6] Brin S and Page L 1998 Computer Networks and ISDN Systems 30 107
- [7] Langville A M and Meyer C D 2006 Google’s PageRank and Beyond: The Science of Search Engine Rankings, (Princeton: Princeton University Press)
-
[8]
Franceschet M 2010
PageRank: Standing on the shoulders of giants
arXiv:1002.2858v3[cs.IR] -
[9]
Vigna S dated November 12 2010
Spectral Ranking available at
http://vigna.dsi.unimi.it/ftp/papers/SpectralRanking.pdf - [10] Litvak N, Scheinhardt W R W, and Volkovich Y 2008 Lecture Notes in Computer Science 4936 72
- [11] Donato D, Laura L, Leonardi S and Millozzi S 2004 Eur. Phys. J. B 38 239
- [12] Pandurangan G, Raghavan P and Upfal E 2005 Internet Math. 3 1
- [13] Georgeot B, Giraud O and Shepelyansky DL 2010 Phys. Rev. E 81 056109
-
[14]
Chepelianskii A D 2010
arXiv:1003.5455[cs.SE],http://www.quantware.ups-tlse.fr/QWLIB/linuxnetwork/ -
[15]
Zhirov A O, Zhirov O V and Shepelyansky D L 2010
Eur. Phys. J. B 77 523,
http://www.quantware.ups-\-tlse.fr/QWLIB/2drankwikipedia/ - [16] Fogaras D, Lecture Notes in Computer Science 2003 2877 65
- [17] Hrisitidis V, Hwang H, Papakonstantinou Y, 2008 ACM Trans. Database Syst. 33 1
- [18] Shepelyansky D L and Zhirov O V 2010 Phys. Lett. A 374 3206
-
[19]
Abel M and Shepelyansky D L 2011
Eur. Phys. J. B 84 493
http://www.quantware.ups-\-tlse.fr/QWLIB/cheirankbusiness/ -
[20]
Ermann L and Shepelyansky D L 2011
Acta Phys. Polonica 120(6A) A158,
arXiv:1103.5027[q-fin.GN],http://www.quantware.ups-tlse.fr/QWLIB/tradecheirank/ -
[21]
Academic Web Link Database Project
http://cybermetrics.wlv.ac.uk/database/ - [22] Ermann L, Chepelianskii A D and Shepelyansky D L 2011 Eur. Phys. J. B 79 115
- [23] Milo R, Shen-Orr S, Itzkovitz S, Kashtan N, Chklovskii D and Alon U 2002 Science 298 824
-
[24]
Alon U
http://www.weizmann.ac.il/mcb/UriAlon/(section Complex networks) -
[25]
http://www.quantware.ups-tlse.fr/QWLIB/dvvadi/ - [26] Shepelyansky D L and Zhirov O V 2010 Phys. Rev. E 81 036213; Ermann L and Shepelyansky D L 2010 Phys. Rev. E 81 036221
- [27] Frahm K M, Georgeot B and Shepelyansky D L 2011 J. Phys. A: Math. Theor. 44 465101