11email: tremblay@astro.umontreal.ca, bergeron@astro.umontreal.ca 22institutetext: Zentrum für Astronomie der Universität Heidelberg, Landessternwarte, Königstuhl 12, 69117 Heidelberg
22email: hludwig@lsw.uni-heidelberg.de 33institutetext: Leibniz-Institut für Astrophysik Potsdam, An der Sternwarte 16, D-14482 Potsdam, Germany
33email: msteffen@aip.de 44institutetext: CNRS, Université de Lyon, École Normale Supérieure de Lyon, 46 allée d’Italie, F-69364 Lyon Cedex 7
44email: bernd.freytag@ens-lyon.fr
Solution to the problem of the surface gravity distribution of cool DA white dwarfs from improved 3D model atmospheres
Abstract
Context. The surface gravities of cool ( K) hydrogen-atmosphere DA white dwarfs, determined from spectroscopic analyses, are found to be significantly higher than the canonical value of expected for these stars. It was recently concluded that a problem with the treatment of convective energy transport within the framework of the mixing-length theory was the most plausible explanation for this high- problem. We pursue the investigation of this discrepancy by computing model spectra of cool convective white dwarfs from a small sequence (11,300 K 12,800 K) of 3D hydrodynamical model atmospheres, which feature a sophisticated treatment of convection and radiative transfer. Our approach is to proceed with a differential analysis between 3D and standard 1D models. We find that the 3D spectra predict significantly lower surface gravities, with corrections of the right amplitude as a function of effective temperature to obtain values of on average. We conclude that the surface gravity distribution of cool convective DA white dwarfs is much closer to that of hotter radiative objects when using, for the treatment of the convection, 3D models instead of the mixing-length framework.
Aims.
Methods.
Results.
Key Words.:
convection — line: profiles — stars: atmospheres — white dwarfs1 Introduction
The shape of Balmer lines in hydrogen-atmosphere DA white dwarfs is particularly sensitive to variations of the atmospheric parameters ( and ). Therefore, the spectroscopic technique, which consists in comparing the observed line profiles of the Balmer series with the predictions of detailed model atmospheres, is by far the most accurate method for determining the atmospheric parameters. This technique was initially applied to a sample of 37 cool ( K) DA white dwarfs by Bergeron et al. (1990) who showed that the values measured for these white dwarfs were significantly higher than the expected canonical value of , which is about the mean value determined later for hotter DA stars (e.g., Bergeron et al. 1992). This discrepancy is now observed in all large spectroscopic surveys of DA white dwarfs (e.g., Eisenstein et al. 2006; Gianninas et al. 2009) and no satisfactory explanation has been reported until now. In Fig. 1, we present our current view of this high- problem for the spectroscopically identified DA stars in the Sloan Digital Sky Survey (SDSS). This long-standing problem implies that we cannot obtain reliable atmospheric parameters determined from spectroscopy at the cool end of the white dwarf evolutionary sequence. Since the problem manifests itself for white dwarfs older than 1 Gyr, it has important implications on our ability to use these objects as cosmochronometers and distance indicators (Winget et al. 1987; Fontaine et al. 2001).

Since white dwarf stars are expected to cool at constant mass and almost constant radius, the sudden and significant increase in cannot be explained in terms of simple astrophysical arguments. Tremblay et al. (2010, hereafter TB10; see also ) made an extensive review of the possible solutions, which range from inadequate assumptions about the composition of these stars to inaccuracies in the model atmosphere calculations. The non-detection of He i lines in high-resolution Keck observations of cool DA stars by TB10 ruled out the systematic presence of helium in the atmospheres, which would mimic higher spectroscopic determinations, as initially proposed by Bergeron et al. (1990). TB10 concluded – as Koester et al. (2009) did – that a problem with the treatment of convective energy transport, currently based on the mixing-length theory (MLT; Böhm-Vitense 1958), is the only viable explanation for the high- problem.
The MLT approximation is a phenomenological description of the complex convective fluid movements in a star. According to this model, bubbles transport energy in the convection zone over a characteristic distance – the mixing length – where they dissolve and release their extra energy in the environment. Even though the MLT framework, properly calibrated, provides a reasonable description of white dwarf model atmospheres (TB10 and references therein), even small changes in the convective efficiency, or equivalently the mixing-length parameter, can have a significant impact on the predicted line profiles (see, e.g., Fig. 3 of Bergeron et al. 1995) in the regime where the high- problem is most important. This comes from the fact that convective energy transport may affect dramatically the temperature and pressure structures of the atmosphere, and consequently the shape of the broad hydrogen lines, formed at different depths in the atmosphere. The observations reveal that the high- problem seems to be related to the line profiles only, and not to the continuum flux (as demonstrated from photometric analyses of these stars; see, e.g., TB10 and Koester et al. 2009), and that the problem occurs when convection becomes important in the photosphere (TB10). This is consistent with the MLT framework being the source of the problem.
A more detailed multidimensional radiation-hydrodynamics (RHD) treatment of convective motions in DA white dwarfs, based on first physical principles, has already been studied by Ludwig et al. (1994), Steffen et al. (1995), and Freytag et al. (1996). These studies revealed that the differences between 2D spectra and those computed from standard 1D hydrostatic models were qualitatively small. However, a visual inspection of Fig. 13 from TB10 reveals that the model predictions do not need to change by much to rectify the high- problem. These 2D calculations have not been pursued further, and in the meantime, full three dimensional RHD simulations (hereafter 3D models) have become more sophisticated, and accurate enough to make realistic predictions (see, e.g., Asplund et al. 2000 and references therein).
In this work, we present an updated investigation of the differences between standard DA spectra and those calculated from 3D model atmospheres. In Sect. 2, we describe our computation of a small number of 3D model atmospheres for cool convective DA white dwarfs. We then address, in Sect. 3, the status of the high- problem from a purely differential analysis between the Balmer line profiles predicted by the 3D models, and those computed from 1D models with the same underlying microphysics.
2 Improved 3D model atmospheres
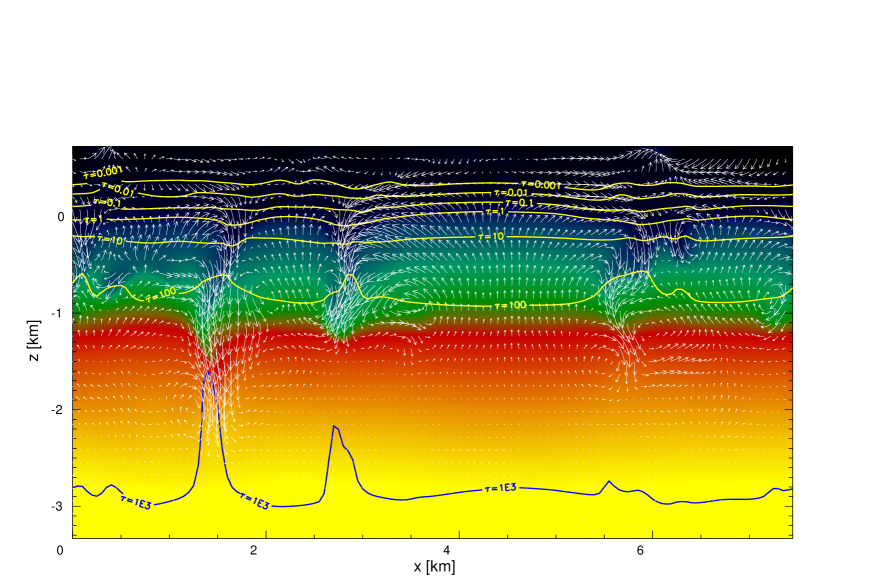
We computed a small set (11,300 K 12,800 K) of pure-hydrogen 3D model atmospheres at with the CO5BOLD code111www.astro.uu.se/bf/co5boldmain.html (Freytag et al. 2002; Wedemeyer et al. 2004). This code solves the time-dependent hydrodynamical equations (conservation of mass, momentum, and energy) for a fully compressible fluid with a finite-volume approach, coupled to the radiative transfer. The DA white dwarfs investigated here have a shallow convective zone, which can be included entirely in the simulation domain (for the vertical direction). This allows for dynamically stable layers at the top and bottom of the domain, and accounts for the entire overshooting layer. The lateral boundaries are periodic, and the radiative flux entering the domain at the bottom defines the effective temperature. We rely on a standard stellar equation of state, and the opacities are the same as those used in the simulations of Ludwig et al. (1994). We computed both gray and non-gray models, the latter using 7 opacity bins for the radiative transfer (Ludwig et al. 1994). Table 1 presents the basic properties for our set of models. In Fig. 2, we illustrate the structure of the non-gray 11,975 K model. We find that our new models are qualitatively similar to those computed by Ludwig et al. (1994) and Steffen et al. (1995) in terms of the properties of the convective zone (i.e., depth and maximum velocities).
| Opacity bins | Timea𝑎aa𝑎aTotal stellar time. | b𝑏bb𝑏b Maximum flux error, defined as (), taken over the whole depth of the computation box. is the nominal flux , and is the total energy flux (radiative, convective, kinetic, viscous and potential fluxes) averaged over 2 seconds (or 5 seconds for the coolest gray and non-gray models) at the end of the simulation. Note that the maximum flux error generally occurs at the base of the simulation and that in the line forming layers, the flux error is much smaller. | ||
| (K) | (s) | () | ||
| Non-gray models | ||||
| 11,300 | 8.0 | 7 | 10 | 2.46 |
| 11,975 | 8.0 | 7 | 10 | 0.07 |
| 12,390 | 8.0 | 7 | 10 | 0.16 |
| 12,800 | 8.0 | 7 | 10 | 0.02 |
| Gray models | ||||
| 11,350 | 8.0 | 1 | 40 | 1.20 |
| 11,975 | 8.0 | 1 | 10 | 0.70 |
| 12,390 | 8.0 | 1 | 15 | 0.03 |
| 12,800 | 8.0 | 1 | 15 | 0.06 |
2
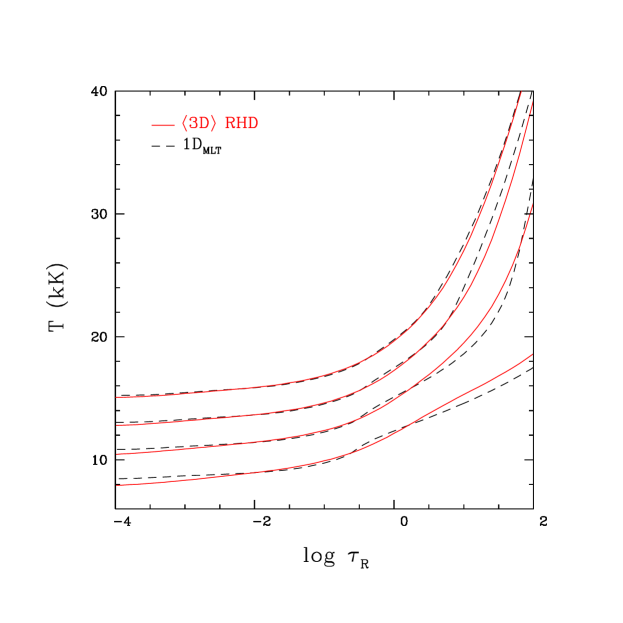
In order to make our comparison strictly differential, we also employ 1D models in which the microphysics and radiation transfer numerical schemes (e.g., the opacity binning) are identical to those included in the 3D models. We computed these hydrostatic 1D models with the LHD code (Caffau & Ludwig 2007), which treats convection within the MLT framework using our most recent ML2/ parameterization (see TB10 for details). In Fig. 3, we present these models hereafter named 1DMLT (the gray models are omitted for clarity). In addition, we computed mean 1D structures that correspond to the and spatial average of the 3D models over surfaces of constant Rosseland optical depth. We followed this procedure with temporal averages over 12 selected snapshots. These averages, called 3D models and shown in Fig. 3, have had their horizontal temperature and pressure fluctuations removed, and therefore, a comparison of 3D and 3D models highlights the effect of these fluctuations.
At first, we rely on the Linfor3D three-dimensional spectral synthesis code333www.aip.de/mst/linfor3Dmain.html to compute H line profiles from our DA model atmospheres. Figure 4 presents the 3D, 3D, and 1DMLT profiles at K and 12,390 K. It is already obvious that the 3D spectra are indistinguishable from the spectra computed from the corresponding averaged 3D models, an effect also observed by Steffen et al. (1995) in their 2D simulations. This is a non-trivial result since significant temperature and pressure inhomogeneities are present in the hydrodynamical simulations (see Fig. 2). In the case of main-sequence stars, for instance, differences between 3D and 3D spectra can be important (Ludwig et al. 2009). However, in the case of DA white dwarfs, an optical spectrum can be safely computed using a single averaged atmospheric structure. In this context, one can therefore neglect the time-consuming task of 3D spectral synthesis.
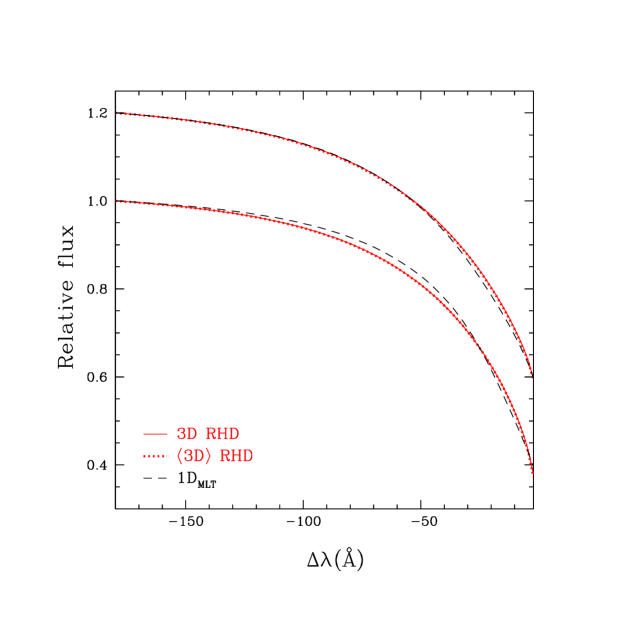
On the other hand, Fig. 4 also demonstrates that the differences between the 3D and 1DMLT models are significant. This suggests that most of the effects from the RHD treatment of convection originate from changes in the mean vertical atmospheric structure. An examination of Fig. 3 indeed reveals that the 3D – hereafter equivalent to 3D – and 1DMLT structures have a significantly different shape in the photosphere. For the remainder of this study, our goal is to quantify the differences between these models.
We chose to compute optical synthetic spectra (3500 Å 5500 Å) for all our 3D and 1DMLT structures calculated in this work using the standard spectral synthesis code for DA white dwarfs from the Montreal group (Tremblay & Bergeron 2009, TB10). The rationale behind this choice is that, as described above, one can neglect the 3D spectral synthesis, and moreover, our code relies on an equation of state and opacity sources that are more appropriate for DA white dwarfs (e.g., with a proper account of line blending, including non-ideal gas effects). We verified that the structures calculated in this work from the LHD and CO5BOLD codes (with the microphysics dating from Ludwig et al. 1994) are comparable to those computed with the Montreal code. This implies that the differences in the microphysics are small, after all, and that our procedure is adequate for a differential analysis.
3 Application to the high- problem
To quantify the effects of the 3D white dwarf models, we compute in this section the 3D atmospheric parameter corrections with respect to the reference 1DMLT models. These are defined as the differences in and when we fit the normalized line profiles of both the 1DMLT and 3D spectra with a reference grid444We neglect the center of the lines ( Å), which are formed at low values of where the number of frequencies taken into account in the structure calculations can have a strong impact on the predictions.. More specifically, the corrections are defined as 1D3D, since we are interested in how much the atmospheric parameters of real stars would change when using 3D model spectra. Our approach is similar to that of Ludwig et al. (2009) who studied these corrections for late-type main sequence stars. We use as a reference grid the spectra computed in TB10555We also calculated a similar reference grid from gray structures to fit our gray models.. Obviously, the atmospheric parameter corrections will not be exact since the independent reference grid does not exactly reproduce the spectra computed in this analysis. Nevertheless, the good quality of our fits achieved in all cases implies that our approach should be valid to within a few percents. The 3D corrections are presented in Fig. 5. In the case of the 3D corrections in effective temperature, we find that they are all relatively small ( K at K). They are certainly of the same order as the accuracy of the spectroscopic method, and therefore we do not discuss them further. We note that the 3D corrections should approach zero for K, since the convection zone is rapidly shrinking, and the 1DMLT and 3D spectra are otherwise identical.
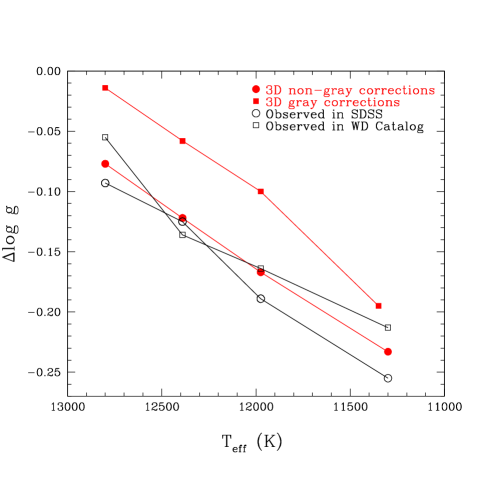
The non-gray 3D corrections are the key values to assess the high- problem. A preliminary observation reveals that these corrections are negative for all spectra (i.e., the 3D models predict lower surface gravities), which is in the appropriate direction to correct the problem. The mean amplitude of the corrections is significant ( 0.15 dex), which may not be surprising since the complicated flow patterns are not expected to be fully represented by a unique free parameter for all atmospheric depths, and for all white dwarfs. Also given in Fig. 5 are the observed shifts in derived from the SDSS white dwarf sample displayed in Fig. 1. These shifts correspond to the corrections required, in a bin of 1000 K around the model temperature, to match the median mass value obtained from hot DA stars, represented by the dashed line in Fig. 1. We also computed similar shifts from the sample of Gianninas et al. (2009), drawn from the Villanova White Dwarf Catalog, to account for observational uncertainties. We can see that the 3D corrections have almost exactly the right slope and amplitude to solve the high- problem. This result clearly indicates that the surface gravity distribution of cool convective DA stars ( K) would be much more stable, as a function of , if 3D model atmospheres were used instead of the 1D standard models.
We also verified that the non-gray corrections are fairly independent of the corrections by redoing our fits at fixed temperatures (). The corrections we obtain with this method are within % of those found in Fig. 5. Finally, the fact that we have a set of 3D gray models allows us to evaluate the impact on our results of the opacity binning procedure in the non-gray models. The shifts in that we obtain with 1 opacity bin (gray models) are smaller than those with 7 bins (non-gray models), but still correct to a large degree the high- problem. This shows that further improvements in the binning procedure of the RHD models are not expected to change our differential analysis significantly.
4 Conclusion
We conducted a differential analysis of synthetic spectra for cool convective DA white dwarfs computed from model atmospheres with a detailed 3D radiation-hydrodynamical treatment of convective motions, and with the standard 1D mixing-length theory. We introduced the concept of 3D atmospheric parameter corrections, which are defined as the difference in and between 1DMLT and 3D spectra when fitted with an independent grid. These corrections illustrate by how much the atmospheric parameters of DA stars would change if we were to use a grid of 3D spectra to fit the observations. We find that the 3D surface gravity corrections have the correct amplitude ( dex) to solve the high- problem for DA white dwarfs in the range 11,300 K 12,800 K. This indubitably suggests that a weakness with the standard MLT theory is creating the high values reported in recent spectroscopic analyses (e.g., TB10).
Our next goal will be to review the microphysics and the opacity binning procedure in the CO5BOLD code to connect the absolute properties of these hydrodynamical models with those of standard white dwarf models. We will then be able to compute improved 3D model spectra that can actually be compared with observations to determine the atmospheric parameters. We also plan to look at convective white dwarfs cooler than those studied in this work, where the MLT theory predicts an increasingly adiabatic convection, which is less sensitive to the mixing-length parameter. It remains to be seen how the 3D corrections would behave in this regime.
Acknowledgements.
This work was supported in part by the NSERC Canada and by the Fund FQRNT (Québec). B.F. acknowledges financial support from the Agence Nationale de la Recherche (ANR), and the “Programme Nationale de Physique Stellaire” (PNPS) of CNRS/INSU, France.References
- Asplund et al. (2000) Asplund, M., Ludwig, H.-G., Nordlund, Å., & Stein, R F. 2000, A&A, 359, 669
- Bergeron et al. (1992) Bergeron, P., Saffer, R. A., & Liebert, J. 1992, ApJ, 394, 228
- Bergeron et al. (1990) Bergeron, P., Wesemael, F., Fontaine, G., & Liebert, J. 1990, ApJ, 351, L21
- Bergeron et al. (1995) Bergeron, P., Wesemael, F., Lamontagne, R., et al. 1995, ApJ, 449, 258
- Böhm-Vitense (1958) Böhm-Vitense, E. 1958, ZAp, 46, 108
- Caffau & Ludwig (2007) Caffau, E., & Ludwig, H.-G. 2007, A&A, 467, L11
- Eisenstein et al. (2006) Eisenstein, D. J., Liebert, J., Harris, H. C., et al. 2006, ApJS, 167, 40
- Fontaine et al. (2001) Fontaine, G., Brassard, P., & Bergeron, P. 2001, PASP, 113, 409
- Freytag et al. (1996) Freytag, B., Ludwig, H.-G., & Steffen, M. 1996, A&A, 313, 497
- Freytag et al. (2002) Freytag, B., Steffen, M., & Dorch, B. 2002, Astron. Nachr., 323, 213
- Gianninas et al. (2009) Gianninas, A., Bergeron, P., & Ruiz, M. T. 2009, Journal of Physics Conference Series, 172, 012021
- Koester et al. (2009) Koester, D., Kepler, S. O., Kleinman, S. J., & Nitta, A. 2009, Journal of Physics Conference Series, 172, 012006
- Ludwig et al. (2009) Ludwig, H.-G., Behara, N. T., Steffen, M. & Bonifacio, P. 2009, A&A, 502, 1L
- Ludwig et al. (1994) Ludwig, H.-G., Jordan, S., & Steffen, M. 1994, A&A, 284, 105
- Steffen et al. (1995) Steffen, M., Ludwig, H.-G. & Freytag, B. 1995, A&A, 300, 473
- Tremblay & Bergeron (2009) Tremblay, P.-E., & Bergeron, P. 2009, ApJ, 696, 1755
- Tremblay et al. (2011) Tremblay, P.-E., Bergeron, P. & Gianninas, A. 2011, ApJ, 730, 128
- Tremblay et al. (2010) Tremblay, P.-E., Bergeron, P., Kalirai, J. S. & Gianninas, A. 2010, ApJ, 712, 1345 (TB10)
- Wedemeyer et al. (2004) Wedemeyer, S., Freytag, B., Steffen, M., Ludwig, H.-G. & Holweger, H. 2004, A&A, 414, 1121
- Winget et al. (1987) Winget, D. E., Hansen, C. J., Liebert, J., et al. 1987, ApJ, 315, L77