The relation in galaxy clusters:
Effects of radiative
cooling and AGN heating
We present a detailed investigation of the X-ray luminosity ()-gas temperature () relation of the complete X-ray flux-limited sample of the 64 brightest galaxy clusters in the sky (HIFLUGCS). We study the influence of two astrophysical processes, active galactic nuclei (AGN) heating and intracluster medium (ICM) cooling, on the relation, simultaneously for the first time. We employ homogeneously determined gas temperatures and central cooling times, measured with Chandra, and information about a central radio source from Mittal and collaborators. We determine best-fit relations for different subsamples using the cool-core strength and the presence of central radio activity as selection criteria. We find the strong cool-core clusters (SCCs) with short cooling times ( Gyr) to display the steepest relation () and the non-cool-core clusters (NCCs) with long cooling times ( Gyr) to display the shallowest (). This has the simple implication that on the high-mass scale (keV) the steepening of the relation is mainly due to the cooling of the intracluster medium gas. We propose that ICM cooling and AGN heating are both important in shaping the relation but on different length-scales. While our study indicates that ICM cooling dominates on cluster scales ( keV), we speculate that AGN heating dominates the scaling relation in poor clusters and groups ( keV).
The intrinsic scatter about the relation in X-ray luminosity for the whole sample is and varies from a minimum of for weak cool-core clusters to a maximum of for clusters with no central radio source. The scatter does not decrease if SCC clusters are excluded from the full sample. We find that the contribution of core luminosities within the cooling radius , where the cooling time is Gyr and gas cooling may be important, to the total X-ray luminosities amounts to and for the SCC and WCC clusters, respectively. We find that after excising the cooling region, the scatter in the relation drops from to , implying that the cooling region contributes to the overall scatter. The remaining scatter is largely due to the NCCs.
Lastly, the statistical completeness of the sample allows us to quantify and correct for selection effects individually for the subsamples. We find the true SCC fraction to be 25% lower than the observed one and the true normalizations of the relations to be lower by , , and for SCC, WCC, and NCC clusters, respectively.
1 Introduction
Scaling relations in galaxy clusters and groups are of great interest for the determination of cosmological key parameters (e.g. Borgani & Guzzo 2001; Rosati et al. 2002; Reiprich & Böhringer 2002; Stanek et al. 2006; Reiprich 2006; Mantz et al. 2008; Vikhlinin et al. 2009; Leauthaud et al. 2010). Of prime importance is to keep track of the systematics that enter the slope and normalization determination due to different physical mechanisms. These physical processes may, for example, be related to AGN activity, sloshing or bulk motions of gas, or cooling of the intracluster medium (ICM).
In the context of cooling flows and AGN heating, there is still a considerable amount of debate about the X-ray luminosity ()-temperature () relation (e.g. Markevitch 1998; Voit & Bryan 2001; Fabian et al. 1994; Bower et al. 2008; Magliocchetti & Brüggen 2007; McCarthy et al. 2004). The relation currently faces two main challenges. Firstly, the slope as determined from observations is much higher (, Allen & Fabian 1998; Arnaud & Evrard 1999) than that predicted based on the self-similarity of halos (, Kaiser 1986; Eke et al. 1998). Secondly, the intrinsic dispersion (excluding statistical errors) in the relation is large, which diminishes its utility in constraining cosmological parameters. As per the results of Pratt et al. (2009), the raw scatter about the relation is about 70% in , which decreases significantly on excising the cluster central regions (see Section 4). Both these findings illustrate our lack of understanding of the physics that governs the formation and evolution of the largest virialized structures in the Universe. As a first step towards using galaxy clusters as cosmological tools, we need to address variations in their physical and structural properties caused by baryon processes, such as radiative cooling, heating due to AGN or conduction, and eradicate their effects on the scaling relations.
Several works, based on both observations and simulations, have indicated that the relation in low-mass halos with a central radio source differs systematically from that in systems without a central radio source Sijacki & Springel (2006); Croston et al. (2005); Puchwein et al. (2008). Studies also show that clusters with strong cooling, as indicated by either the short cooling times of the intracluster gas or high classical gas mass deposition rates, lie on a different plane (e.g., Allen & Fabian 1998; O’Hara et al. 2006). In this work, we extend these studies to understand the behaviour of the relation in the presence of both AGN heating and ICM cooling. The sample we use to do this is the complete flux-limited HIFLUGCS sample (Reiprich & Böhringer 2002), constituting the 64 X-ray brightest galaxy clusters with high-quality Chandra data (Hudson et al. 2010) and radio data with good spectral coverage (Mittal et al. 2009) for all the clusters. Thus, a rich database of X-ray and radio data allows us to study the influence of both the mechanisms in parallel.
Residuals
.
This article is organized as follows. In section 2, we describe the data used for the work and the data analysis. In section 3, we outline the subsamples created based on the radio and cooling properties and compare the individual fits. In section 4, we scrutinize the cooling activity as the main cause of the scatter about the observed relation. In section 5, we investigate systematics, such as the selection effects that might bias the observed fractions of the different type of cool-core clusters and whether the new Chandra calibration has any impact on the slope of the fitted relations. Finally, in sections 6 and 7, we discuss our results and present our conclusions. We assume throughout this paper a CDM concordance Universe, with km/s/Mpc, , and .
2 Data and analysis
In this section, we present a brief introduction of the datasets and quantities used in this work. The data reduction and analysis can be found in detail in Hudson et al. (2010) [hereafter H10] for the X-ray data and Mittal et al. (2009) [hereafter M09] for the radio data.
The study in H10 used Ms of high-resolution Chandra data and provided a detailed census of the inner regions of clusters offering an insight into the physics governing cluster cores. It summarized 16 different cool-core diagnostics and found that the central cooling time, , was the best indicator. This choice resulted in 44% strong cool-cores (SCC) with Gyr, 28% weak cool-cores (WCC) with Gyr Gyr and another 28% non-cool-cores (NCC) with Gyr. Following this result, we use as the measure of the cooling strength of a cluster, such that those with shorter have higher cooling strengths.
M09 utilized more than different radio flux-density measurements in their study and obtained the total radio luminosities for correlation with cooling properties. They also determined the fraction of central radio sources (CRSs) in the HIFLUGCS sample and found that 48 out of 64 clusters (75%) contain cluster-centre radio sources that are either cospatial with or within 50kpc of the X-ray peak emission. In addition, M09 found that the probability of finding a cluster-centre radio source increases with cooling strength, from 45% to 67%111In the meantime, one more WCC cluster (A1650) has been found, owing to higher sensitivity of the more recent radio observations, to harbour a central radio source (Govoni et al. 2009), increasing the total number of cluster-centre radio sources from 48 to 49 and the fraction of CRSs in the WCC category from 67% to 72%. to 100% for NCC, WCC and SCC clusters, respectively. This provides evidence of a connection between the supermassive black hole activity and the cooling of the ICM.
The virial temperatures, , were taken from H10. The authors determined by removing the central region of the observed Chandra temperature profile. This was done in order to prevent the cool-core region from corrupting the global cluster temperature estimates. To determine the size of the central region to be excluded, we fitted the temperature profiles to a broken power-law. The radius of the central region in the power-law was free and the index of the outer component was fixed to be zero. Owing to the limited field-of-view of Chandra, the outer radius for the determination varies. This may introduce a small amount of scatter, although, tests on two of the highest-redshift clusters in the sample, A2204 and A2163, indicate that our conclusions are not affected by this.
The bolometric X-ray cluster luminosities over the range (0.01 to 40) keV, , as measured with ROSAT using mostly ASCA temperatures, were taken from Reiprich & Böhringer (2002). ROSAT data were preferred over those of Chandra for the total cluster luminosities because ROSAT has a larger field of view and a lower instrumental background than Chandra. The errors in the bolometric luminosities are reflective of the errors in the count rate. Temperature uncertainties, which are on the order of 10% (Reiprich & Böhringer 2002), form an additional source of statistical scatter. On the basis of on simulations using PIMMS (portable, interactive multi-mission simulator) and theoretical grounds (), a 10% error in temperature implies a error in . Although we do not take this additional uncertainty into account, one may conservatively add a 5% error to the statistical uncertainty in quadrature. To scrutinize the cooling effects on the relation, we used, as the first step, the total X-ray luminosities, i. e. without performing any correction to avoid the contribution from the cool-core region. As the second step, we made the cool-core correction to the luminosities by excluding the contribution to the luminosity from a central region where cooling is putatively important. The size of the excluded central region was determined using the “cooling radius”, , defined as the radius at which the gas cooling time is Gyr (the cooling time at radii greater than is longer than this time scale). For comparison, we also considered excluding a region of radius a fixed fraction of the virial radius, known as the “core radius”, .
Luminosities within the cooling radius, , were determined using CIAO 4.2 and CALDB 4.3.0. and the CIAO tool specextract. For each cluster with , spectra were extracted from within the cooling radius for each ObsID in which the entire aperture fit on a single CCD. Blank sky backgrounds and weighted response functions were used, and each spectrum was binned by 25 counts per bin. Spectra for each cluster were simultaneously fit in XSPEC using a wabs*APEC spectral model over the range (0.3 to 10.0) keV, and allowing the temperature, abundance, and normalization to vary. The hydrogen absorbing column densities were fixed to the values used for the H10 study, which were in turn taken, except in a few cases, from the Leiden/Argentine/Bonn Hi Survey (Kalberla et al. 2005). The best-fitting model parameters were used with the XSPEC ’dummyrsp’ command to provide unabsorbed within the energy range (0.01 to 40) keV.
For four of the clusters (A0262, NGC4636, A3526, and NGC5044), the cooling radius proved to be larger than a single chip. In those cases, spectra were extracted from neighboring chips and fit simultaneously, tying the temperatures and abundances together but allowing the normalizations to vary separately. When neighboring chips were too small to contain a complete annulus, Lx within the total annulus was estimated using simple geometric arguments. Note that and were taken from H10, wherein the X-ray data acquired with Chandra were calibrated and analysed using CIAO 3.2.2 and CALDB 3.0. To confirm consistency between the different versions of CIAO and CALDB, we compared values of and in cases where and found that they agreed to within their errors. The various X-ray quantities used for this paper are listed in Table References.
| Category | # | (in %) | (in %) | (in %) | (in %) | ||
|---|---|---|---|---|---|---|---|
| (a) | Total luminosities | ||||||
| ALL | 64 | 2.640.20 | 2.940.16 | 45.4 | 11.8 | 15.5 | 4.0 |
| CRS | 49 | 3.040.23 | 3.170.15 | 46.5 | 12.7 | 14.6 | 4.0 |
| NCRS | 15 | 2.000.35 | 2.540.27 | 59.4 | 10.3 | 23.4 | 4.0 |
| SCC | 28 | 3.820.38 | 3.330.15 | 51.8 | 13.1 | 15.6 | 3.9 |
| ∗NSCC | 36 | 2.190.17 | 2.700.19 | 47.4 | 11.1 | 17.5 | 4.1 |
| WCC | 18 | 2.300.20 | 3.250.32 | 34.8 | 12.3 | 10.7 | 3.8 |
| NCC | 18 | 2.100.26 | 2.420.21 | 50.4 | 10.8 | 20.8 | 4.5 |
| (b) | Cool-core corrected luminosities (using the cooling radius, , see Section 4) | ||||||
| ALL | 64 | 1.880.11 | 3.050.14 | 39.1 | 12.5 | 12.8 | 4.1 |
| SCC | 28 | 2.000.16 | 3.270.15 | 34.2 | 13.6 | 10.4 | 4.2 |
| ∗NSCC | 36 | 2.010.15 | 2.700.18 | 47.9 | 11.2 | 17.7 | 4.1 |
| WCC | 18 | 1.950.15 | 3.200.29 | 36.3 | 12.4 | 11.4 | 3.9 |
| ∗CC | 46 | 1.970.11 | 3.250.13 | 33.2 | 13.0 | 10.2 | 4.0 |
| ∗ CC = SCC+WCC, NSCC = WCC+NCC | |||||||
3 scaling relation
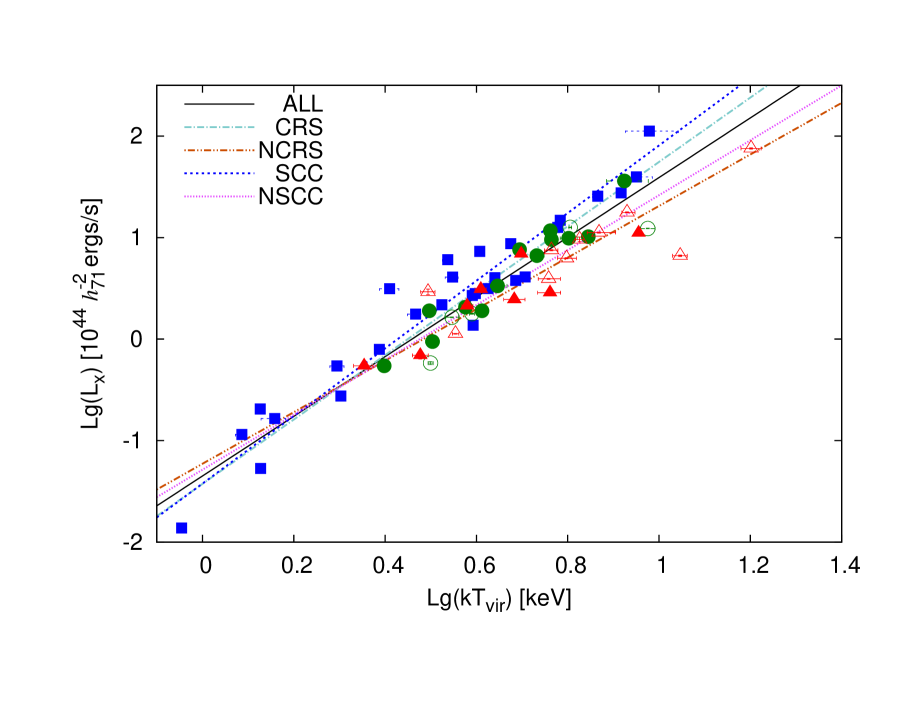
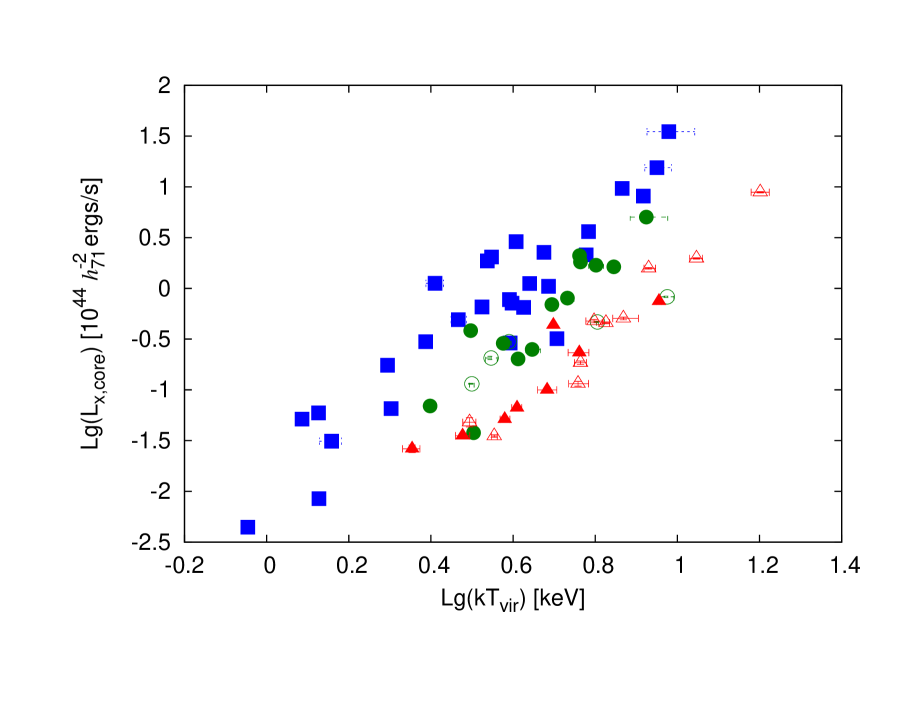
The main purpose of this investigation is to assess the effects of different physical mechanisms on the ICM properties. In particular, we wish to distinguish the roles of cooling activity and AGN heating on the relation. Shown in Figure 1 is versus . At first glance, it appears that clusters with a central radio source (filled symbols) have a systematically higher X-ray luminosity than those without (open symbols). This would be rather surprising since AGN heating is believed to heat the X-ray emitting gas resulting in an opposite effect, namely, an increase in entropy and suppression of the X-ray luminosity. A more thorough analysis presented below reveals that it is the cooling of the intracluster gas in the cores of clusters, many of which harbour an AGN at their centres, that results in an enhancement in the X-ray luminosity.
To examine the effects of AGN heating and ICM cooling on the relation and to what extent these mechanisms are responsible for the steepening of the relation, we divided our sample into seven categories: (1) all clusters (ALL), (2) clusters with a central radio source (CRS), (3) clusters without a central radio source (NCRS), (4) SCC clusters, (5) non-strong-cool-core (NSCC=WCC+NCC) clusters, (6) WCC clusters, and (7) NCC clusters. We used the BCES (bivariate correlated errors and intrinsic scatter) fitting routine by Akritas & Bershady (1996) to determine the best-fit relations for all the categories, individually. The BCES algorithm generates four different kinds of fits, amongst which we use the ‘bisector’ method throughout this paper. This produces a line that bisects the best-fit regression lines, BCES() and BCES(), where BCES() minimizes the residuals in and BCES() minimizes the residuals in . The bisector method ensures that both the quantities, and , are treated symmetrically, without having to specify independent (explanatory) and dependent (response) variables. The best-fit lines are shown in Figure 1. We use a power-law functional form to indicate the relation [] and perform the fittings in the -space. The best-fit model parameters are given in Table 1(a).
The raw scatter (statistical plus intrinsic) was determined from the weighted sample variance in the plane222 and (Arnaud et al. 2005)
| (1) | |||||
| (2) |
where , , , , and is the sample size. The statistical scatter, , caused by measurement errors, was estimated by taking the root-mean-square of . The intrinsic scatter was calculated as the difference between the raw and the statistical scatters in quadrature. In Table 1(a), we provide the intrinsic and statistical scatters in percentages () in both, as well as . Since the statistical and intrinsic scatters add in quadrature, the contribution of the statistical errors to the total dispersion is small.
3.1 Cooling against heating
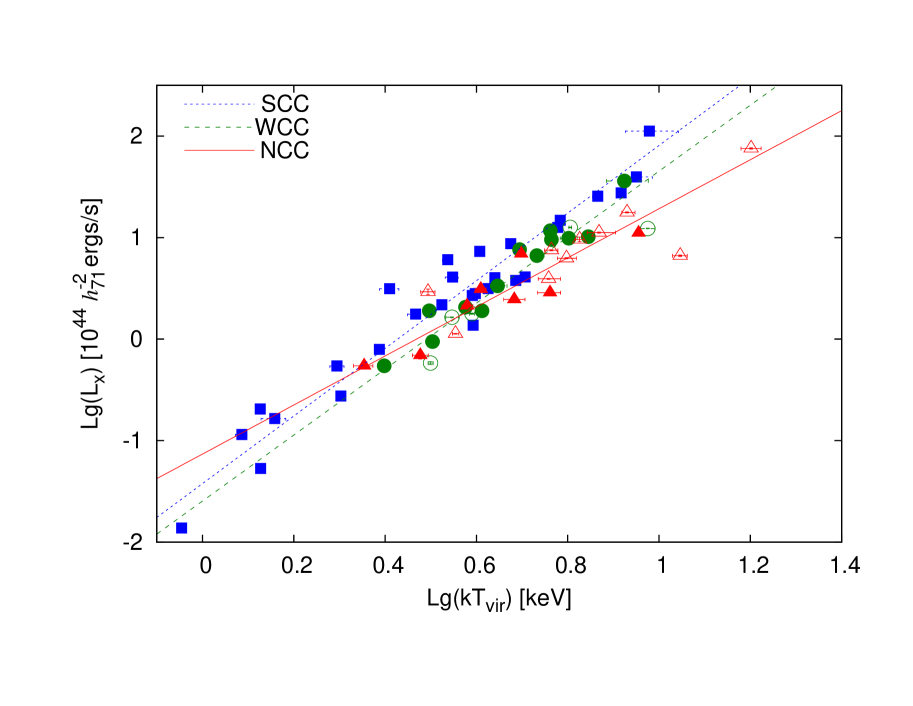
The best-fit slope of the luminosity-temperature relation for the complete HIFLUGCS sample (category ‘ALL’) is , which is much steeper than the self-similar value of 2.0. This result agrees with several previous works such as Arnaud & Evrard (1999), Allen & Fabian (1998), Novicki et al. (2002), and Zhang et al. (2007). After the subdivision into different classes, several interesting features are evident. A comparison of slopes shows that the SCC clusters have the steepest relation (), whereas the NCC clusters have the shallowest (). Note that the high power-law index for SCCs is not due to selection effects. Even though it is true that there is not even a single NCC with keV, the steep relation for SCCs is a generic feature of clusters with a short central cooling time. This can be easily verified by eliminating from the SCC subsample all clusters with keV (eight in number) and fitting the data again. After doing this, we find that , which is consistent with the power-law index obtained for the complete SCC sample, and still much higher than the fitted power-law index for the NCC subsample.
A similar contrast in slopes is true for the CRS and NCRS clusters. The fits for CRS and SCC clusters have consistent slopes within the errorbars, and, likewise, the fits for NCRS and NCC clusters have consistent slopes within the errorbars (although the CRS and SCC cluster subsamples have different normalizations, the SCC clusters being systematically higher in luminosity than the CRS clusters). This is not unsurprising since we know from M09 that the probability of finding a central radio source in a cluster is an increasing function of the cooling strength, with SCC clusters having the highest incidence (100%) and the NCC clusters having the lowest incidence (44%). Hence, the fit through the CRS cluster subsample is dominated by the SCC clusters and, similarly, the fit through the NCRS cluster subsample is dominated by the NCC clusters.
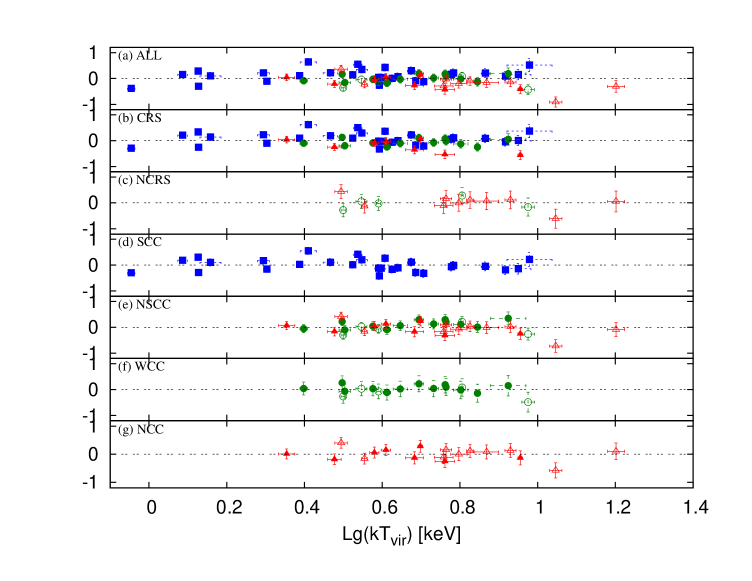
In Figure 2, we present the -space residuals in for each category based on its respective best-fit. Figure 2(b) indicates that the CRS subsample actually comprises clusters from two different populations rather than one. CRS clusters with a strong cool core (filled boxes) are clearly above the zero-deviation line (18 out of 28), whereas those without (circles and triangles) are on-average below (15 out of 21). Using the Kolmogorov-Smirnov (KS) test, we find that the probability of the null hypothesis, i.e. that the two samples (CRS clusters with and without a SCC) are drawn from the same underlying population, is only 1.2%. A similar, though less dramatic, segregation is seen between NSCC clusters with a CRS, represented by the filled symbols in Figure 2(e) and those without a CRS, represented by the open symbols in Figure 2(e). Fourteen of the 21 NSCC clusters with a CRS lie above the zero-deviation line and 6 out of 15 NSCC clusters without a CRS lie above the zero-deviation line. The KS probability of the null hypothesis is 7%. NSCC clusters with a CRS are still biased towards positive deviation. This is likely because a higher fraction of WCC clusters have a CRS than the NCC, once again implying that the cooling activity dictates the overall trend. The NCC category in Figure 2(g), even though low in sample size, most clearly illustrates this argument. Both the subsamples, the NCC clusters with (filled symbols) and without (open symbols) a CRS, can be seen equally distributed about the zero-deviation line. Four of the 8 NCC clusters with a CRS lie above the zero-deviation line and 7 out of 10 NCC clusters without a CRS lie above the zero-deviation line. The KS probability that the NCC clusters with and without a CRS originate from a single population is 54%. In other words, subsamples marked by the absence (or presence) of cooling may be visualized as originating from a single population. That the subsamples having identical cooling properties seem to follow the same relation, independent of the presence of a radio source, implies that it is the cooling of the intracluster gas that plays a more dominant role in influencing the relation rather than the AGN activity.
We conclude that on the high-mass scale ( keV) the steepening of the relation is primarily related to the cooling of the ICM. This is clearly manifested by the relation being the steepest for the SCC clusters. As the forthcoming analysis shows, the cooling effects in CCs leading to the steeper relation are likely distributed over a region larger than that described by the cooling radius. The cut at keV is motivated by the SCC and NCC fits crossing at (see Figure 1). As discussed in Section 6, it is most likely that both ICM cooling and AGN heating have to be considered in describing the relation. However, owing to the nature of the sample containing mostly high-mass clusters, we see direct evidence of only the former.
4 Cool-core contribution to the X-ray luminosity and scatter in the relation
It has often been noted that excluding cool-core clusters decreases the overall intrinsic dispersion in the relation (O’Hara et al. 2006; Pratt et al. 2009; Chen et al. 2007), with the direct implication that the cool-core related activities are the prime contributors to the observed scatter. Our observations do not completely support this conclusion. Qualitatively, this may be seen by noting that, firstly, if that were true, the intrinsic scatter for the subgroup ‘NSCC’ containing no strong cool-core clusters would have to be significantly lower than that corresponding to the ‘ALL’ category. From Table 1(a) it can be seen this is not the case. Secondly, the subgroup ‘NCRS’, which comprises predominantly NCC clusters and not a single SCC cluster has the largest intrinsic dispersion in both X-ray luminosity (59.4%) as well as virial temperature (23.4%). Also, the ‘NCC’ subgroup has a large a high intrinsic scatter (50.4 %), comparable to the ‘SCC’ subgroup (51.8%). That these two subsamples have comparable scatters implies that one cannot impute the scatter obtained for the ’ALL’ category to only the process of intracluster-medium cooling. In H10, it was found that most of the NCC clusters in the HIFLUGCS sample show signs of merger activity, a process that entails shock heating and adiabatic compression and may cause the system to deviate from a given relation.
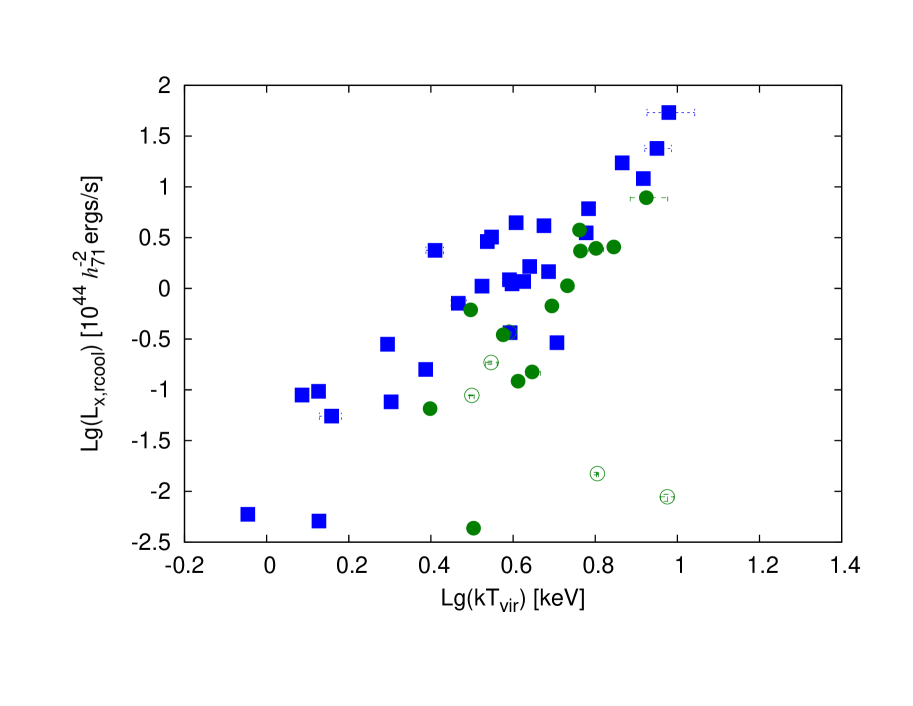
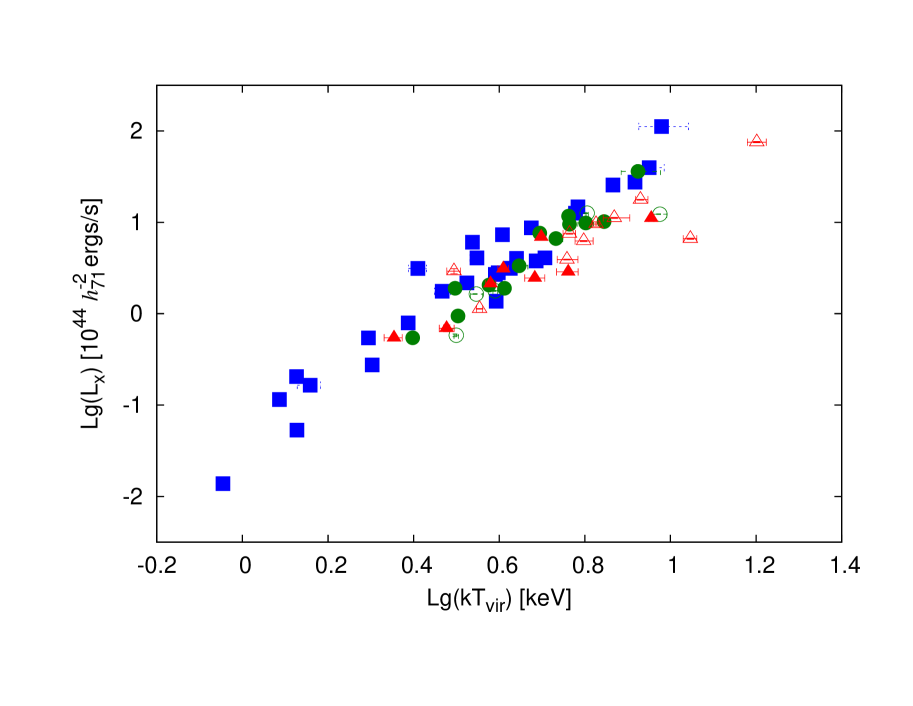
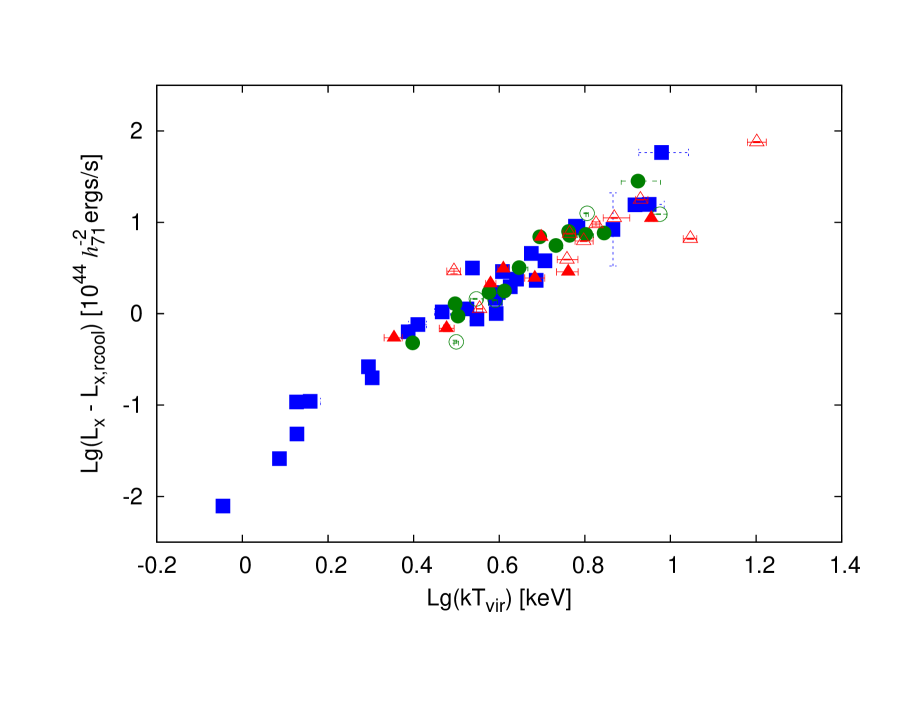
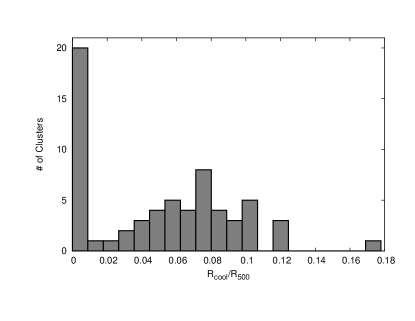
In the following, we quantify the degree to which the cooling activity contributes to the observed scatter about the relation. To calculate the X-ray luminosity originating from the cool cores of the clusters, the “cool-core luminosity”, we choose two defining regions. The first region is the “cooling radius”, , the radius at which the cooling time of the gas is Gyr. The NCCs by definition have . The average cooling radius of the remaining 46 cool-core (CC) clusters (SCCs+WCCs) is . The second region is the “core radius”, (H10, unpublished), a fixed fraction of the virial radius. The cool-core luminosities (0.01-40) keV from and versus temperature are shown in the upper left and right panels of Fig. 3, respectively. The left panel shows those SCCs and WCCs with a non-zero , whereas the right panel shows all the 64 clusters. Even though closely matches the average cooling radius () over all 64 clusters, is likely a better parameter to assess the scatter due to cooling in the relation. shows a relatively smaller scatter with temperature than . However, this is not surprising. The core radius corresponds to a fixed fraction of a characteristic overdensity scale, whereas the cooling radius varies from cluster to cluster and its scaling relative to the has a large dispersion (see Fig. 4). Since the cooling radius is closely tied to the cooling process, it is precisely this dispersion that may be adding to the scatter in the relation. For samples where detailed density and temperature profiles cannot be obtained (such as those containing high- clusters) for the precise determination of , we propose that a cut equal to the average cooling radius be used for the cool-core correction. A cut larger than this is likely to overestimate the fraction of the luminosity generated by cooling.
We calculate the fraction of the X-ray luminosity originating from the cooling radius as , and that originating from the core radius as , where and are the integrated luminosities over and , respectively. We find that the for the SCCs is equal to , for the WCC is equal to , for the SCCs and WCCs combined is equal to , and for all the 64 clusters is (the 1 error in is greater than the mean for some of the subsets and reflects non-gaussianity in ). Similarly, the for the whole sample is equal to . Hence, the variation in total due to the variation in for the whole sample () is much higher than that due to the variation in (). These variations may be directly compared to the percentage scatter in determined for the ‘ALL’ relation (). The contribution of the cooling activity to the scatter in the relation is if the cooling radius is considered and if the core radius is considered (note that the contributions to the scatter add in quadrature). However, as mentioned above, we deem that the region described by the cooling radius is a more appropriate region to use to assess the luminosity due to cooling and its contribution to the scatter. Hence, this implies that we can expect about 25% of the scatter in the relation to result from the cluster-to-cluster variation in the central luminosities of CC clusters. The scatter expected after excluding the cool-core luminosity is .
In the lower left panel of Fig. 3, we show the total X-ray luminosity versus temperature and in the lower right panel of Fig. 3 the cool-core excised total luminosity versus the virial temperature. We determine the relation after excluding the cooling luminosity and find . The exclusion of the core emission does not affect the slope of the relation and is consistent with that corresponding to the ‘ALL’ category including the core (). However, it does produce a smaller normalization and a shallower slope for the SCCs, such that the SCCs and WCCs are now indistinguishable and have the same parameters. The best-fit parameters for the subsets after the cool-core correction, i. e. after subtracting from the total luminosities, are given in Table 1(b). Since no correction was made for the NCCs, the parameters and the scatters in the luminosity and temperature for the NCC subset remain the same. The intrinsic dispersion about the relation for ‘ALL’ clusters obtained after the cool-core correction is 39.1%. This is in very good agreement with the scatter expected after excising the cooling luminosity based on the dispersion in , as proposed above. In other words, about 27% of the scatter in the relation may be attributed to the luminosity within . However, after the cool-core correction, the CC (SCC+WCC) subset shows the least scatter in luminosity (33.2%), followed by the SCC subset (34.2%). Hence, the remaining scatter in the relation after excising from the SCCs and WCCs is largely due to the NCCs (50.4%).
We expect the scatter to continually decrease with the size of the excised region since the effects of cooling and heating are expected to dampen with increasing clustercentric distance. This is consistent with the findings of Pratt et al. (2009), who excised the 15% region and found a reduction in scatter by more than . We do not conduct the above analysis with 15%; the reasons are twofold. Firstly, because of the limited field-of-view of Chandra, more and more emission falls out of the observed field with increasing radius (especially for the nearby clusters), forcing us to make assumptions about the missing emission. This defeats the purpose of obtaining precise luminosity measurements to minimize the scatter. Secondly, as seen with the 4.8% core region above, excising a fixed fraction of the virial radius is not always meaningful. The actual cooling region scaled by contributing to the scatter varies from cluster to cluster.
Note that in the AGN-regulated feedback paradigm, AGN heating must occur over the same scale as the cooling in order to balance it. While this analysis shows that excluding the cooling region in the cool-core clusters reduces the scatter in the relation, we cannot comment on how much of the scatter from the excised region is caused by cooling activity and how much by AGN heating. For a given temperature, not only might the SCC clusters have a higher luminosity than NCCs, but for a given luminosity either the SCC clusters might have lower virial temperatures and/or the NCC clusters higher virial temperatures. In their simulations, Burns et al. (2008) indeed find an abundance of cool gas in the region to , i. e. beyond the cores of CC clusters. This could result in an overall lower virial temperature in SCC clusters. As noted previously (Section 4), most NCC clusters in our sample are merger systems, which due to heating may have a higher virial temperature.
Lastly, we point out that the subgroup of WCC clusters displays the least scatter (34.8%). This is perhaps not so surprising because these are clusters that neither possess a strong cool-core nor exhibit any indication of an ongoing or past major merger (Hudson et al. 2010). We note that the SCCs and WCCs have statistically consistent slopes and so it may be that WCCs are actually progenitors of the SCC clusters, whose cool cores would eventually grow in time to match those of SCC clusters.
5 Systematics
| Case | Category | Input Fractions | Output Fractions | Input relations | Output relations |
|---|---|---|---|---|---|
| , | , | ||||
| No scatter, observed , fixed to 3.33 | SCC | 0.310 | 0.4320.040 | 3.82, 3.33 | 3.82, 3.33 |
| WCC | 0.335 | 0.2860.038 | 2.30, 3.33 | 2.30, 3.33 | |
| NCC | 0.355 | 0.2820.039 | 2.10, 3.33 | 2.10, 3.33 | |
| No scatter, observed and | SCC | 0.340 | 0.4370.040 | 3.82, 3.33 | 3.82, 3.33 |
| WCC | 0.350 | 0.2760.034 | 2.30, 3.25 | 2.30, 3.25 | |
| NCC | 0.310 | 0.2870.038 | 2.10, 2.42 | 2.12, 2.42 | |
| Scatter included, observed and | SCC | 0.340 | 0.4380.038 | 3.82, 3.33 | 4.31, 3.35 |
| WCC | 0.355 | 0.2810.037 | 2.30, 3.25 | 2.43, 3.27 | |
| NCC | 0.305 | 0.2810.038 | 2.10, 2.42 | 2.56, 2.51 | |
| Scatter included, observed | SCC | 0.340 | 0.4320.042 | 3.40, 3.33 | 3.85, 3.35 |
| WCC | 0.355 | 0.2910.038 | 2.15, 3.25 | 2.30, 3.27 | |
| NCC | 0.305 | 0.2770.042 | 1.75, 2.42 | 2.13, 2.51 |
5.1 Selection effects
Flux-limited samples suffer from the well-known Malmquist bias, namely that brighter objects have a higher detection rate than fainter objects. This bias may affect the observed fractions of SCC, WCC, and NCC clusters, and, in addition, the fitted relations.
Owing to their enhanced central X-ray-emission. strong cool-core clusters have a higher chance of detection and this may explain the observed higher fraction of SCC clusters in flux- and luminosity-limited samples. Since we have a complete flux-limited sample, we can estimate the magnitude of this bias. We simulated samples of clusters, which follow the X-ray temperature function (XTF) given by (Markevitch 1998), in the temperature range (0.5-20) keV and redshift range from 0.001 to 0.25 [the XTF used is an approximation; a more realistic functional form consists of a power-law and an exponential high temperature cut-off (e.g. Henry 2000; Ikebe et al. 2002)]. In H10, it is shown that SCC, WCC, and NCC clusters come from the same parent redshift distributions within a standard deviation. Hence, we assigned random redshifts to clusters conforming to the law, where is the proper distance. We assigned clusters to be SCC, WCC, and NCC clusters according to certain input fractions, which were varied in the overall process. The luminosities of the SCC, WCC, and NCC clusters were calculated using the relation corresponding to each category as determined in Section 3.1.
To estimate the effect of applying a flux-limit to a mixed sample of SCCs, WCCs, and NCCs, we applied the HIFLUGCS flux-limit, keV erg s-1 cm-2, to the simulated sample and reprojected the fluxes to the plane. We tried four different cases. In the first (simplest) case, we assumed that the SCCs, WCCs and NCCs have the same slope (3.33) and fixed the normalizations to those found from the fits to the data (Table 1)(a). In the second case, we fixed the slopes for SCCs, WCCs and NCCs to the fitted values. In the third case, we also inserted the intrinsic scatter [from Table 1(a)] about the fitted relations in X-ray luminosity. In all three cases, we varied the input fractions to determine the values that best matched the observed fractions. The addition of scatter about the relations has an effect, as expected, only on the normalizations. The data points scattered to higher values have a higher likelihood of falling above the flux-limit, thereby increasing the normalization in all three cases. In the fourth case, we fixed the fractions of SCC, WCC, and NCC to the best-fit values from the third case and varied the normalizations to determine the ‘true’ values, which yielded the observed normalizations. The results of these simulations are given in Table 2. The two main results are that (1) the SCC input fraction is on average about lower than the observed value and (2) the inclusion of scatter increases the normalization of all the three relations, the true normalizations being about , , and lower than the observed values for SCC, WCC, and NCC clusters, respectively.
5.2 Chandra calibration
The virial temperature acquired with Chandra that were used to determine the overall relation for the HIFLUGCS sample were calibrated and analysed using CIAO 3.2.2 and CALDB 3.0 (Hudson et al. 2010). In the meantime, a new version of the Chandra calibration package, CALDB 4.1.1, has been made available as of January 2009. In this section, we give a brief comparison between the results obtained using the old and the new CALDB packages.
The cross calibration project with the International Astronomical Consortium for High Energy Calibration (IACHEC333http://www.iachec.org/index.html) resolved a disagreement between the two instruments to a certain extent. Internal consistency checks showed that the ACIS derived temperatures for clusters hotter than keV were systematically higher than the EPIC derived ones. This may result in an erroneous slope estimate of the relation.
Minor adjustments to the effective area of the HRMA (High Resolution Mirror Assembly) have now been incorporated in CALDB 4.1.1, which are based on the predictions of the new model that corrects for a hydrocarbon contamination layer. We used the results of the comparison between cluster temperatures derived for the XMM-Newton and Chandra data, using the two measurements of HRMA effective area (David 2009, figure 21). We determined the best-fit lines to establish the relation between the ACIS temperatures, and , in the energy band 0.5 keV to 7.0 keV, corresponding to the two Chandra calibration schemes, CALDB 3.2.1 and CALDB 4.1.1. This relation is given by
| (3) |
where the temperatures are in units of keV. Using this relation, we calculated for each cluster with keV. The old and the new temperature estimates are shown in Figure 5. The slope of the best-fit through the new data points (‘ALL’) obtained from the BCES algorithm is , and is consistent within the errorbars with the previous one given in Table 1(a). Thus, we conclude that our best-fit estimates of the relation for the different categories obtained using CALDB 3.1.2 are not affected by the new Chandra calibration.

6 Discussion
The relation in clusters has been studied extensively by several other groups (e.g. O’Hara et al. 2006; Puchwein et al. 2008; Poole et al. 2007; Jetha et al. 2007) to examine the intricate processes operating in the ICM that need to be well-understood before using X-ray observations of clusters to constrain cosmological parameters. Most observational studies focus either on intracluster cooling or AGN heating as the cause of the deviation of the relation from self-similar form of the relation. Our multi-wavelength coverage of the topic allows us to unravel the effects of both mechanisms, simultaneously.
The general conclusion of previous studies of the AGN effects on the state of the intracluster gas is that AGN heating removes gas from the centres of halos (Sijacki & Springel 2006; Puchwein et al. 2008; Croston et al. 2005; Short & Thomas 2009). For example, in the model of Short & Thomas (2009), the mechanical heating associated with expanding jets and lobes produced by the central engine with radio-mode accretion pushes the gas away from the centre to the outer regions. This has the effect of reducing the density of the X-ray emitting gas in the halo cores. AGN-heating is especially effective in poor clusters and groups because of their shallow gravitational potential wells. In contrast, cooling increases the gas density at the centre and causes the X-ray luminosity of the cluster cores to increase. The two processes therefore have opposite effects on the X-ray luminosity.
These results can be reconciled quite well with our findings. Even though our observations lend support only to the impact of cooling, we propose that both the mechanisms have a significant influence on the relation but on different scales. While we have shown that ICM cooling dominates the deviation of the relation from its norm in high-mass systems, we speculate that AGN heating dominates the state of the intracluster gas in low-mass systems. Owing to the radiative cooling of the ICM, we observe that the high-mass SCC clusters in our sample ( keV) have a higher luminosity than the high-mass NCC clusters. The low-mass clusters ( keV) with AGN are predicted to display the reverse trend. AGN heating in these systems becomes more dominant and causes the X-ray luminosity to decrease relative to systems without any source of heating. This is yet to be checked with a statistically complete sample of low-mass clusters and groups. Our sample has only ten low-mass clusters with keV, out of which eight have strong cool-cores; low statistics of NSCC clusters makes it difficult to test this scenario. However, this is in line with the results obtained by Croston et al. (2005). They analysed a subsample of groups from the group sample (Group Evolution Multiwavelength Study, Osmond & Ponman 2004) and found that the radio-loud groups lie on a steeper relation. Their analysis, however, supports a model whereby AGN heating, instead of the displacement of gas and the consequential decrement in the X-ray luminosity, results in the deposition of the kinetic energy of the radio source in the form of thermal energy, causing the gas temperature to increase. Irrespective, we propose that it is the combination of both of the processes, AGN heating and ICM cooling, that causes the steepening of the relation.
Our results, however, seem to contradict the simulations of Sijacki & Springel (2006). Besides self-gravity, their recipe includes radiative cooling, photoionization, star-formation, supernovae heating, and AGN-heating in the form of hot, radio-plasma filled bubbles. According to their results, the effect of bubble heating is the same for both low- and high-mass clusters and a corresponding decrement in X-ray luminosity should be seen in CRS clusters. This is incompatible within the framework of AGN-regulated feedback in cool-core systems. Cool-core halos at a given temperature, because of the nature of cooling, have an enhanced luminosity and, at the same time as shown in Mittal et al. (2009), undebatably favour AGN at their centres; all SCCs have a centrally located AGN. However, this does not imply that every SCC has an enhanced luminosity in that low-mass SCC clusters may have a decrement because of AGN heating. Whether there is a net increment (ICM cooling) or decrement (AGN heating) in luminosity depends upon the scale of the system.
After applying the cool-core correction, the CC clusters show the least intrinsic dispersion of 33%. Pratt et al. (2009) obtained a scatter of 26% using luminosity and temperature in the range (0.15 to 1). It is certainly plausible that the scatter decreases with increasing radius of the region excluded for the cool-core correction. Even though 15% is too large a region relative to the average cooling radius of the CCs, it may be that for some of the clusters the cooling radius does not encapsulate the total volume affected by cooling. The slope of the CC clusters after the cool-core correction is indeed as steep as before (note that excluding low-mass systems with keV does not make a difference). In the context of the relation, this could imply that the cooling effects are distributed over a much larger region () than that suggested by the cooling radius. There are 11 SCCs with higher luminosities than the NCCs after the cool-core correction. A simple calculation shows that the further decrement in the luminosity required to match the SCC and the NCC slopes is in the range 2% to 100% of , with a mean of around 35%. Hence, it is plausible that if a larger core region is subtracted for these clusters, the slope of the SCCs would flatten. We propose that in future studies other diagnostic regions, similar to and , should be investigated in order to determine the optimal region over which to make the cool-core correction.
There could be several factors contributing to the remaining scatter in the relation after the cool-core correction. One such factor is the pre-heating process in which supernovae, AGN, stars etc heat the gas in some early epoch of cluster formation (e.g. Kaiser 1991; Evrard & Henry 1991; Navarro et al. 1995). The concept of pre-heating is still not very well-understood, especially the exact physical processes that govern it. The non-gravitational processes associated with pre-heating are usually collectively inserted into simulations in the form of entropy. McCarthy et al. (2004) investigated integrated models containing radiative cooling and entropy injection to study the global and structural properties of galaxy clusters. Their results indicate that such models can reproduce the observed intrinsic scatter in the scaling relations, including the relation, although it may be that different levels of injection entropy [(100 to 500) keV cm2] are required for different mass ranges. Lastly, self-similar clusters follow , where is the gas mass fraction and is the redshift of the cluster formation. Hence, different epochs of cluster formation and gas mass fraction may also contribute to the scatter at some level.
7 Conclusions
We have investigated the two competing physical processes that affect the relation in galaxy clusters using the 64 X-ray brightest halos in the sky. This is the largest statistically-complete sample with high-quality X-ray and radio data. The two competing processes in question are the cooling of the intracluster medium (ICM) and AGN heating. Our main results are as follows:
-
1.
On cluster scales, the cooling of the intracluster medium (ICM) is the dominant of the two mechanisms that shapes the relation in the strong cool-core clusters. Although they each contain a central radio source, the strong cool-core clusters (SCCs) have enhanced luminosities.
-
2.
SCC clusters with short cooling times ( Gyr) have the steepest power-law index (3.33) whereas the non-cool-core (NCC) clusters with long cooling times ( Gyr) have the shallowest power-law index (2.42).
-
3.
The intrinsic dispersion in ranges from a minimum of 34.8% for weak cool-core (WCC) clusters ( Gyr Gyr) to maximum of 59.4% for clusters with no central radio source (NCRS).
-
4.
Our results do not show that the SCCs only are responsible for the scatter in the relation. There is similar scatter for SCC (51.8%), NCC (50.4%), and NSCC (47.4%) clusters.
-
5.
After applying the cool-core correction, the intrinsic scatter about the relation in luminosity decreases from 45.4% to 39.1%. The SCCs+WCCs display the least scatter after the correction (33.2%) followed by the SCCs (34.2%) and then WCCs (36.3%). The NCC subset, for which the scatter is unchanged (50.4%), is the dominant source of scatter in the relation after the cool-core correction.
-
6.
The variation in the cool-core luminosity, , where is the cooling radius at which Gyr, contributes 27% to the total intrinsic scatter about the relation. The average cooling radius for SCCs+WCCs is .
-
7.
Owing to the nature of the sample (flux-limited), the actual fractions of SCC, WCC and NCC clusters may be similar. The observed fraction of SCCs is likely higher because of their relatively enhanced X-ray luminosities. The normalizations of the relations of SCC, WCC, and NCC clusters were individually corrected for Malmquist bias, caused by the scatter, using Monte Carlo simulations.
Our results suggest that on cluster scales, intracluster medium cooling (where relevant) is more predominant than AGN heating in the context of the scaling relation. Furthermore, we speculate that AGN heating becomes increasingly important as the size of the halos decreases and may be the dominant of the two processes on galaxy group scales.
Acknowledgements.
We thank the referee for the valuable comments on the manuscript and insightful suggestions. R. M. acknowledges support from the Deutsche Forschungsgemeinschaft (DFG) through the Schwerpunkt Program 1177 (RE 1462/4) and T. H. R acknowledges support from the DFG through the Emmy Noether and Heisenberg research grants RE 1462/2 and RE 1462/5.References
- Akritas & Bershady (1996) Akritas, M. G. & Bershady, M. A. 1996, ApJ, 470, 706
- Allen & Fabian (1998) Allen, S. W. & Fabian, A. C. 1998, MNRAS, 297, L57
- Arnaud & Evrard (1999) Arnaud, M. & Evrard, A. E. 1999, MNRAS, 305, 631
- Arnaud et al. (2005) Arnaud, M., Pointecouteau, E., & Pratt, G. W. 2005, A&A, 441, 893
- Borgani & Guzzo (2001) Borgani, S. & Guzzo, L. 2001, Nature, 409, 39
- Bower et al. (2008) Bower, R. G., McCarthy, I. G., & Benson, A. J. 2008, MNRAS, 390, 1399
- Burns et al. (2008) Burns, J. O., Hallman, E. J., Gantner, B., Motl, P. M., & Norman, M. L. 2008, ApJ, 675, 1125
- Chen et al. (2007) Chen, Y., Reiprich, T. H., Böhringer, H., Ikebe, Y., & Zhang, Y.-Y. 2007, A&A, 466, 805
- Croston et al. (2005) Croston, J. H., Hardcastle, M. J., & Birkinshaw, M. 2005, MNRAS, 357, 279
- David (2009) David, L. 2009, Chandra News, 16, 19
- Eke et al. (1998) Eke, V. R., Navarro, J. F., & Frenk, C. S. 1998, ApJ, 503, 569
- Evrard & Henry (1991) Evrard, A. E. & Henry, J. P. 1991, ApJ, 383, 95
- Fabian et al. (1994) Fabian, A. C., Crawford, C. S., Edge, A. C., & Mushotzky, R. F. 1994, MNRAS, 267, 779
- Govoni et al. (2009) Govoni, F., Murgia, M., Markevitch, M., et al. 2009, A&A, 499, 371
- Henry (2000) Henry, J. P. 2000, ApJ, 534, 565
- Hudson et al. (2010) Hudson, D. S., Mittal, R., Reiprich, T. H., et al. 2010, A&A, 513, A37+ (H10)
- Ikebe et al. (2002) Ikebe, Y., Reiprich, T. H., Böhringer, H., Tanaka, Y., & Kitayama, T. 2002, A&A, 383, 773
- Jetha et al. (2007) Jetha, N. N., Ponman, T. J., Hardcastle, M. J., & Croston, J. H. 2007, MNRAS, 376, 193
- Kaiser (1986) Kaiser, N. 1986, MNRAS, 222, 323
- Kaiser (1991) —. 1991, ApJ, 383, 104
- Kalberla et al. (2005) Kalberla, P. M. W., Burton, W. B., Hartmann, D., et al. 2005, A&A, 440, 775
- Leauthaud et al. (2010) Leauthaud, A., Finoguenov, A., Kneib, J., et al. 2010, ApJ, 709, 97
- Magliocchetti & Brüggen (2007) Magliocchetti, M. & Brüggen, M. 2007, MNRAS, 379, 260
- Mantz et al. (2008) Mantz, A., Allen, S. W., Ebeling, H., & Rapetti, D. 2008, MNRAS, 387, 1179
- Markevitch (1998) Markevitch, M. 1998, ApJ, 504, 27
- McCarthy et al. (2004) McCarthy, I. G., Balogh, M. L., Babul, A., Poole, G. B., & Horner, D. J. 2004, ApJ, 613, 811
- Mittal et al. (2009) Mittal, R., Hudson, D. S., Reiprich, T. H., & Clarke, T. 2009, A&A, 501, 835 (M09)
- Navarro et al. (1995) Navarro, J. F., Frenk, C. S., & White, S. D. M. 1995, MNRAS, 275, 720
- Novicki et al. (2002) Novicki, M. C., Sornig, M., & Henry, J. P. 2002, AJ, 124, 2413
- O’Hara et al. (2006) O’Hara, T. B. et al. 2006, ApJ, 639, 64
- Osmond & Ponman (2004) Osmond, J. P. F. & Ponman, T. J. 2004, MNRAS, 350, 1511
- Poole et al. (2007) Poole, G. B., Babul, A., McCarthy, I. G., et al. 2007, MNRAS, 380, 437
- Pratt et al. (2009) Pratt, G. W., Croston, J. H., Arnaud, M., & Böhringer, H. 2009, A&A, 498, 361
- Puchwein et al. (2008) Puchwein, E., Sijacki, D., & Springel, V. 2008, ApJ, 687, L53
- Reiprich (2006) Reiprich, T. H. 2006, A&A, 453, L39
- Reiprich & Böhringer (2002) Reiprich, T. H. & Böhringer, H. 2002, ApJ, 567, 716
- Rosati et al. (2002) Rosati, P., Borgani, S., & Norman, C. 2002, ARA&A, 40, 539
- Short & Thomas (2009) Short, C. J. & Thomas, P. A. 2009, ApJ, 704, 915
- Sijacki & Springel (2006) Sijacki, D. & Springel, V. 2006, MNRAS, 366, 397
- Stanek et al. (2006) Stanek, R., Evrard, A. E., Böhringer, H., Schuecker, P., & Nord, B. 2006, ApJ, 648, 956
- Vikhlinin et al. (2009) Vikhlinin, A., Burenin, R. A., Ebeling, H., et al. 2009, ApJ, 692, 1033
- Voit & Bryan (2001) Voit, G. M. & Bryan, G. L. 2001, Nature, 414, 425
- Zhang et al. (2007) Zhang, Y., Finoguenov, A., Böhringer, H., et al. 2007, A&A, 467, 437
[x]—l—l—l—l—l—l—l—l—
Observations: (1) Cluster name, (2) Virial temperature,
(3) Bolometric X-ray luminosity (0.01-40) keV, (4) Bolometric
X-ray luminosity (0.01-40) keV within , the radius at which
the gas cooling time is 7.7 Gyr, (5) in kpc, (6) in
arcminute, (7) as a fraction of the virial radius, ,
and (8) hydrogen column densities. The columns with dashes
“” indicate non-cool-core clusters with .
Cluster k
(keV) ( erg s-1) ( erg s-1) (kpc) (arcminute) cm-2
\endfirstheadcontinued.
Cluster k
(keV) ( erg s-1) ( erg s-1) (kpc) (arcminute) cm-2
\endhead\endfootA0085 6.00 12.6000.076 3.518 123.61 1.95 0.080 0.02705
A0119 5.73 3.9200.035 0.03280
A0133 3.96 2.8100.023 1.105 105.56 1.62 0.084 0.01580
NGC0507 1.44 0.1650.002 0.055 66.75 3.37 0.088 0.05560
A0262 2.44 0.7930.030 0.159 68.43 3.48 0.069 0.06380
A0400 2.26 0.5450.006 0.10929
A0399 6.70 9.5900.518 0.10700
A0401 8.51 17.7000.194 0.10282
A3112 4.73 8.7100.096 4.137 127.89 1.51 0.093 0.01270
NGC1399 1.34 0.0530.003 0.005 19.34 3.43 0.026 0.01523
2A0335 3.53 4.0800.033 3.204 141.40 3.44 0.119 0.24798
IIIZw54 2.50 0.5450.042 0.065 44.79 1.30 0.045 0.14700
A3158 4.99 6.9100.104 0.01210
A0478 7.34 25.6000.154 17.23 178.08 1.82 0.104 0.29276
NGC1550 1.34 0.2050.011 0.097 72.15 4.84 0.098 0.13778
EXO0422 2.93 1.7600.109 0.713 85.24 1.83 0.079 0.08080
A3266 9.45 12.3000.086 0.009 9.72 0.14 0.005 0.01840
A0496 4.86 3.7800.026 1.458 102.05 2.62 0.073 0.04279
A3376 3.80 2.1300.030 0.04420
A3391 5.77 2.8700.054 0.05620
A3395s 4.82 2.4600.093 0.07340
A0576 4.09 1.9000.129 0.122 45.16 0.99 0.035 0.05460
A0754 11.13 6.6200.106 0.05130
A0780 3.45 6.0600.036 2.889 116.26 1.87 0.099 0.05005
A1060 3.16 0.5810.019 0.088 43.41 2.84 0.039 0.05030
A1367 3.58 1.1300.009 0.01719
MKW4 2.01 0.2750.005 0.076 58.50 2.44 0.065 0.01710
ZwCl1215 6.27 6.2500.081 0.01760
NGC4636 0.90 0.0140.001 0.006 39.40 8.68 0.065 0.01850
A3526 3.92 1.3700.030 0.366 77.53 5.60 0.062 0.08540
A1644 5.09 4.0900.209 0.292 69.69 1.27 0.049 0.03990
A1650 5.81 9.5500.630 2.333 94.52 1.01 0.062 0.01300
A1651 6.34 9.8600.118 2.475 97.56 1.03 0.061 0.01460
A1656 9.15 11.1000.156 0.00767
NGC5044 1.22 0.1150.001 0.089 85.46 8.06 0.122 0.05060
A1736 3.12 2.9200.184 0.04315
A3558 4.95 7.6200.038 0.670 67.96 1.22 0.048 0.03997
A3562 4.43 3.3500.030 0.150 46.69 0.82 0.035 0.03999
A3571 7.00 10.2000.071 2.556 65.49 1.43 0.039 0.04382
A1795 6.08 14.8000.044 6.095 137.63 1.93 0.088 0.01015
A3581 1.97 0.5440.017 0.281 87.82 3.19 0.099 0.04310
MKW8 3.00 0.6920.058 0.02340
RXJ1504 9.53 112.0001.120 53.875 234.84 1.13 0.120 0.06080
A2029 8.26 27.6000.166 12.076 142.19 1.64 0.078 0.03214
A2052 3.35 2.1800.022 1.052 104.70 2.50 0.090 0.02680
MKW3S 3.90 2.6900.027 1.214 92.47 1.76 0.074 0.02860
A2065 5.40 6.6500.406 1.061 85.95 1.05 0.058 0.03285
A2063 3.77 2.0600.027 0.349 64.93 1.58 0.053 0.02730
A2142 8.40 36.1000.324 7.804 125.73 1.25 0.068 0.04151
A2147 4.07 3.1000.099 0.02823
A2163 15.91 75.5001.130 0.11765
A2199 4.37 4.0300.072 1.644 97.99 2.74 0.074 0.00857
A2204 8.92 39.6000.634 23.886 171.08 1.09 0.090 0.05921
A2244 5.78 11.7000.246 3.758 119.86 1.13 0.079 0.01908
A2256 7.61 11.2000.156 0.04566
A2255 5.81 7.5100.090 0.02493
A3667 6.39 12.6000.088 0.015 12.39 0.19 0.008 0.04590
S1101 2.57 3.1300.028 2.368 171.11 2.57 0.169 0.01050
A2589 3.89 1.7800.023 0.371 72.72 1.50 0.058 0.02880
A2597 4.05 7.3200.088 4.429 125.34 1.32 0.098 0.02200
A2634 3.19 0.9460.015 0.004 12.03 0.32 0.011 0.05140
A2657 3.52 1.6400.015 0.186 51.03 1.08 0.043 0.05915
A4038 3.14 1.9000.025 0.614 82.24 2.31 0.073 0.01540
A4059 4.22 3.1400.041 1.169 109.85 1.99 0.084 0.01058