The Globular Cluster Population of NGC 7457: Clues to the Evolution of Field S0 Galaxies
Abstract
In this paper we present the results of a wide-field imaging study of the globular cluster (GC) system of the field S0 galaxy NGC 7457. To derive the global properties of the GC system, we obtained deep images with the WIYN 3.5 m telescope and Minimosaic Imager and studied the GC population of NGC 7457 to a projected radius of kpc. Our ground-based data were combined with archival and published Hubble Space Telescope data to probe the properties of the GC system close to the galaxy center and reduce contamination in the GC candidate sample from foreground stars and background galaxies. We performed surface photometry of NGC 7457 and compared the galaxy’s surface brightness profile with the surface density profile of the GC system. The profiles have similar shapes in the inner (3.9 kpc), but the GC system profile appears to flatten relative to the galaxy light at larger radii. The GC system of NGC 7457 is noticeably elliptical in our images; we measure for the GC distribution, which is consistent with our measured ellipticity of the galaxy light. We integrated the radial surface density profile of the GC system to derive a total number of GCs . The GC specific frequency normalized by the galaxy luminosity and mass are and , respectively. Comparing the derived GC system properties and other empirical data for NGC 7457 to S0 formation scenarios suggests that this field S0 galaxy may have formed in an unequal-mass merger.
1 Introduction
As some of the longest-surviving stellar populations in galaxies, globular clusters (GCs) provide a unique historical record of the major star formation events and baryonic mass assembly processes in galaxies. For example, observations of ongoing galaxy mergers (Holtzman et al., 1992; Whitmore et al., 1993) have discovered populations of bright, blue, massive clusters; follow-up studies indicate that these are likely proto-GCs forming in merger and/or starburst events (Ho & Filippenko, 1996). Most galaxies contain two subpopulations of GCs as traced by their photometric colors; bluer GCs are metal-poor and redder GCs are metal-rich for stellar populations older than Gyr (Brodie & Strader, 2006). Studies of the two Milky Way GC populations – the metal-poor halo GCs and metal-rich thick disk/bulge GCs – have provided key insights into the formation of the Galaxy (Searle & Zinn, 1978; Zinn, 1993), allowing for the comparison of model predictions to the observational properties of the Galactic GC system (see Ashman & Zepf 1998 and references therein). As compact, luminous (average ; Ashman & Zepf 1998) objects, GCs can be easily detected in galaxies at distances of several tens of Mpcs. Because photometric and spectroscopic techniques yield estimates of GC ages, metallicities, and kinematics (Brodie & Strader, 2006), studies of extragalactic GC populations can deepen and refine our understanding of galaxy formation and evolution.
The GC systems of giant galaxies are typically more spatially extended than the host galaxy light, often extending to many galaxy effective radii (Harris, 1991; Ashman & Zepf, 1998; Brodie & Strader, 2006). As such, imaging studies using detectors with small spatial coverage can only directly measure local GC system properties. However, the global properties of GC systems can be accurately and directly measured from wide-field imaging data thereby minimizing extrapolations to global characteristics from data with less spatial coverage (see Rhode, Windschitl, & Young 2010 and references therein). The determination of the global properties of extragalactic GC systems – including total numbers of GCs, specific frequencies, spatial distributions, color distributions, and color gradients – has been the focus of our ongoing wide-field imaging study of galaxies across a range of environments and morphologies. These properties provide important constraints to galaxy formation models; such models must reproduce the observed ensemble properties of GC systems. The survey methods and previous results are presented in Rhode & Zepf (2001, 2003, 2004; hereafter RZ01, RZ03, RZ04) and Rhode et al. (2005, 2007, 2010; hereafter R05, R07, R10). This paper presents a study of the GC system of NGC 7457, a lenticular (S0) galaxy included in our survey sample (see Table 1 for basic properties). Since NGC 7457 is a field galaxy (; Tully 1988), this allowed us to examine the GC system properties of an S0 in an environment different from most lenticulars. This environmental difference is of primary importance when considering various S0 galaxy formation scenarios (Boselli & Gavazzi, 2006).
Although lenticulars make up a significant fraction of the galaxy population in nearby galaxy clusters (Dressler et al., 1997) and are important for understanding galaxy formation and evolution, the number of uniform and systematic studies of S0 GC systems as a class is quite small. Kundu & Whitmore (2001b) used archival HST/WFPC2 data to examine the GC systems of 29 lenticulars, providing a sample for comparison to their HST/WFPC2 archival data study of the GC systems of ellipticals (Kundu & Whitmore, 2001a). These studies found similar mean colors () for the GC populations in the two galaxy classes. Because the HST imaging was relatively shallow, Kundu & Whitmore (2001b) only detected color bimodality in one S0 and used statistical tests to estimate that of S0s are likely bimodal. The ACS Virgo Cluster Survey (ACSVCS; Peng et al. 2006) imaged the central (17 kpc 17 kpc) of 32 Virgo Cluster S0s. The deeper imaging of this survey discovered color bimodality in of lenticulars. The ACSVCS also confirmed the mean GC color-galaxy luminosity relation in early-type galaxies (Brodie & Huchra, 1991); the lenticulars and ellipticals form an overlapping sequence of redder mean GC colors for increasing galaxy luminosity. While these results hint at similarities between the GC systems of early-type galaxies, at present the global properties of the GC systems of S0 galaxies remain poorly understood relative to giant ellipticals.
We obtained wide-field imaging of the S0 galaxy NGC 7457 using the WIYN 3.5 m telescope111The WIYN Observatory is a joint facility of the University of Wisconsin, Indiana University, Yale University, and the National Optical Astronomy Observatory. and Minimosaic imager. Our ground-based imaging was complemented by the inclusion of published and archival HST data; the high spatial resolution data allowed us to study the GC population closer to the galaxy center. We also performed surface photometry of NGC 7457 in order to compare the spatial distributions of the GC system and the galaxy field star population. Previous studies of the GC system of NGC 7457 were done by Chapeleon et al. (1999; hereafter C99) and Chomiuk, Strader, and Brodie (2008; hereafter CSB08). C99 performed ground-based imaging of NGC 7457 with a similar areal coverage () to our WIYN study. CSB08 used archival HST/WFPC2 images and Keck spectroscopy to probe the ages and metallicities of GCs in NGC 7457.
Our study of the GC system of NGC 7457 is presented as follows. In we describe the observations and data reduction. The surface photometry results are presented in . The methods for the detection of the GC system are given in and the analysis of the GC system is given in . The global properties of the GC system are described in . A summary of this work and conclusions are given in .
2 Observations and Data Reduction
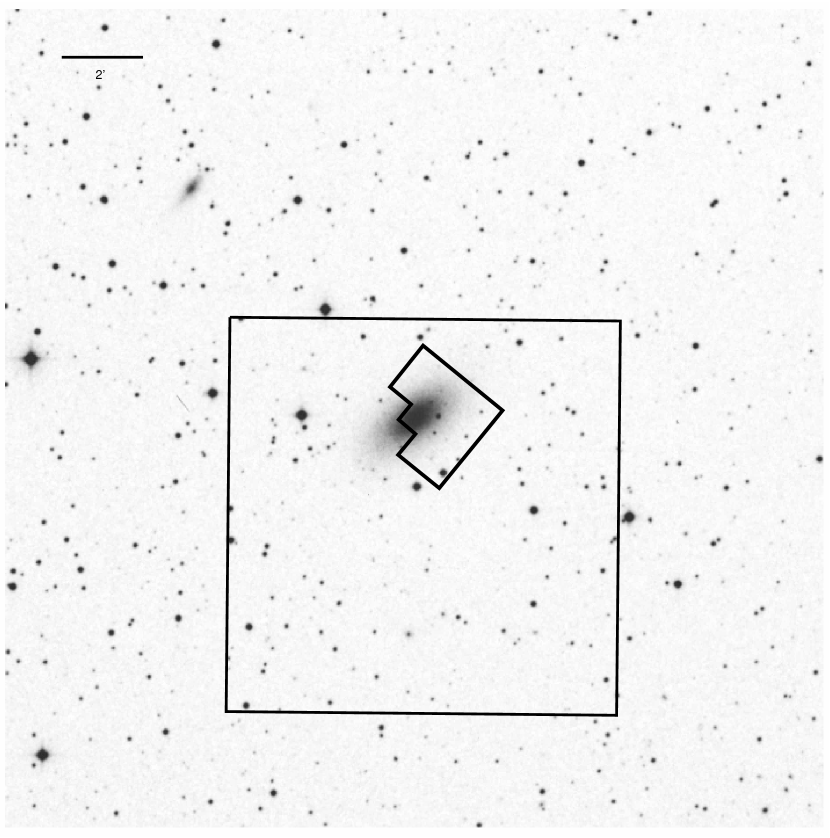
Images of NGC 7457 were obtained in broadband filters over three nights in October 2009 using the Minimosaic camera on the WIYN 3.5 m telescope at Kitt Peak National Observatory. The Minimosaic instrument consists of two CCD detectors; on WIYN, it has a plate scale of per pixel and a field of view of . For the imaging, the object was not centered on the Minimosaic frame but was offset to increase radial coverage around the galaxy. Figure 1 shows the location of the WIYN pointing overlaid on a Digitized Sky Survey 222The Digitized Sky Surveys were produced at the Space Telescope Science Institute under U.S. Government grant NAG W-2166. The images of these surveys are based on photographic data obtained using the Oschin Schmidt Telescope on Palomar Mountain and the UK Schmidt Telescope. The plates were processed into the present compressed digital form with the permission of these institutions. image of the surrounding area. Good-quality imaging data of NGC 7457 were obtained on nights 1 and 3 of the run; total exposure times were in , in , and in .
Because the sky conditions were photometric on night two, images of Landolt (1992) standard fields and single images of NGC 7457 were obtained in all filters. From these data we derived a photometric calibration solution consisting of color coefficients and zero points. The standard errors on the zero points ranged from to . While night two was photometric, the seeing was worse than on nights one and three and hence these data were only used for photometric calibration.
The images from nights one and three were used to construct one combined, deep exposure per filter of NGC 7457 and its GC system. First the data were overscan and bias level corrected as well as flat fielded using standard tasks in the MSCRED package of IRAF. Next, single-format FITS images were constructed from the multi-extension FITS files using the routines msczero, msccmatch, and mscimage. All images in all filters were then aligned to a chosen reference pointing. Next, for each image we measured and subtracted a constant sky background level. For each filter, the corresponding images were scaled to a common flux level using the flux measurements of 10-20 bright stars on each image. The scale factors were applied and images in the same filter were combined using the imcombine task with ccdclip pixel rejection. Lastly, the measured sky background of the image scaling reference frames were added back to the stacked images in each filter. The resultant mean full-width at half-maximum (FWHM) of the image point-spread functions (PSFs) for these final combined images are in , in , and in .
3 Surface Photometry of NGC 7457
In order to derive a total apparent magnitude for NGC 7457 and compare the surface brightness profile of the galaxy to its GC system, we performed surface photometry on the final, deep band image. First, a constant sky level was removed by measuring the modal value of the background in a region of the image away from the galaxy light. This value was in excellent agreement with the median sky value determined for the image stacking and scaling described in . Both unresolved and extended sources in the NGC 7457 field were masked to prevent them from contaminating the galaxy photometry. Surface photometry was performed using the ELLIPSE routine (Jedrzejewski, 1987) in IRAF. We allowed the routine to fit ellipses from to . At , the ellipse solutions became unstable, indicating that at this radius we have reached the image background level and have insufficient signal-to-noise for reliable photometry.
Figure 2 shows the results of the surface photometry; the surface brightness, ellipticity, and position angle are plotted as a function of the semi-major axis of the ellipses. The data are given in Table 2. The surface brightness profile shows a smooth decline in log-log space with an abrupt change in the profile at ; we describe the profile in more detail below and compare the profile to the surface density of GC candidates in . The ellipticity of the isophotes change quite rapidly in the inner but remains fairly constant at an average value of from to . We find evidence of twisty isophotes from the variation in position angles of the ellipses, although the range of overall variation from to is quite small. From interpolation within the surface brightness profile, we find the semi-major axis where the surface brightness reaches is ( kpc for our assumed distance; Table 1), in excellent agreement with the -band RC3 value of (de Vaucouleurs et al., 1991). From the interpolated ellipticity at this radius we find a minor-to-major axis ratio at of , in good agreement with the RC3 value of (de Vaucouleurs et al., 1991) and the Bright Galaxy Catalog (BGC) value of (Tully, 1988). Following the formulation of Tully (1988), we calculate an inclination of , in good agreement with BGC value of .
The shape of the surface brightness profile for NGC 7457 was investigated by fitting the data with a Sérsic profile of the form
| (1) |
where indicates the surface brightness in units of band luminosity per square parsec and the traditional Sérsic index is given by . Thus corresponds to a de Vaucouleurs profile and corresponds to an exponential profile. In magnitudes per square arcsecond, this profile has the form
| (2) |
A fit to the entire surface brightness profile yields a Sérsic index of () but with a large value. Restricting the fit to the inner region of the profile shows that the surface brightness follows closely to a de Vaucouleurs law with (), depending on the radial extent considered as the inner region. This profile generally describes fits ranging from to and from to . In the outer regions of the galaxy, the light profile is better described by an exponential decline; we find a range of Sérsic indices from , again depending on the choice of where the outer profile begins.
Our exploration of the Sérsic fits over various ranges indicate the that surface brightness profile is a combination of a de Vaucouleurs law in the inner regions with an exponential decline in the outermost regions. This is consistent with an expectation of a bulge and disk component for this S0 galaxy. Fisher & Drory (2008; 2010) used bulge/disk decomposition profile fitting to study the optical and infrared surface brightness profiles of NGC 7457. They found bulge Sérsic indices of ( band; Fisher & Drory 2008) and (; Fisher & Drory 2010). Although these values are close to the boundary between pseudobulges () and classical bulges (; Fisher & Drory 2008, 2010), this suggests the presence of a featureless, elliptically-shaped classical bulge rather than a flattened, disky-shaped pseudobulge. We discuss the implications of NGC 7457 having a possible classical bulge in .
The total apparent magnitude of NGC 7457 was computed according to the following procedure. First, the integrated magnitude of the galaxy to the outermost elliptical annulus was computed by the ELLIPSE routine as part of the surface photometry. To extrapolate to an infinite radius and obtain the total magnitude, we fit an exponential profile to the outer portion of the surface brightness profile. An integration of this profile from the outermost elliptical annulus to infinity gave an additional magnitudes in band. The derived total apparent magnitude is , in good agreement with the RC3 value of (de Vaucouleurs et al., 1991). Assuming no internal galaxy extinction and a negligible k-correction, applying a Galactic extinction correction of (Table 1) gives a total, extinction-corrected magnitude of . The derived value is between the recent measurement by Fisher & Drory (2008) of and the RC3 value of . For the remainder of this study, we adopt an absolute magnitude of from the derived total apparent magnitude and assumed distance modulus of (Tonry et al., 2001).
4 Detection of the Globular Cluster System
4.1 Point Source Detection and Aperture Photometry
The detection of the GC system of NGC 7457 was performed following the procedure developed from our previous wide-field survey studies (RZ01; RZ03; RZ04; R07; R10). We begin by smoothing each final combined image with a circular median filter with diameter . The smoothed image is then subtracted from the original and the sky background level is added back to the frame. All remaining steps in the analysis were performed on the galaxy-subtracted images. All sources on the image were detected using the DAOFIND routine in IRAF with a detection threshold for the images and a threshold for the image. Regions with high noise levels and/or saturated pixels, such as along the frame edges, near bright stars, and in the saturated center of the galaxy, were masked out. A total of 1050 objects were detected in all three filters.
At the distance of NGC 7457 and given the resolution of the images (), we expect the GC population to appear as point sources in the frames. We used a graphical software routine to refine our list of detected objects by removing extended sources. Point sources were isolated by plotting the FWHM of the objects versus instrumental magnitude, selecting objects around the well-defined sequence delineated by the points sources. The scatter in the point source sequence increases at fainter magnitudes; in this regime we allowed for a larger range of selected objects. After requiring that objects appear as point sources in all three filters we are left with 540 objects.
For the point source detections we performed aperture photometry in order to obtain calibrated magnitudes. Aperture corrections were calculated by measuring the mean difference between the total magnitude and the magnitude within an aperture of radius . The aperture corrections ranged from -0.196 to -0.294 with errors of 0.001-0.003. Because the photometric solution was derived from data taken on night two and the final science images were constructed using data from nights one and three (see ), bootstrap offsets to the instrumental magnitudes of night two were determined using the final, stacked science images and the single images of NGC 7457 taken on night two. These offsets range from -0.061 to -0.063 with errors of 0.003 to 0.007. The final, calibrated total magnitudes for image point sources were calculated by applying the aperture corrections, atmospheric extinction correction, bootstrap offsets, and photometric calibration coefficients to instrumental magnitudes derived from a radius photometric aperture. Lastly, Galactic extinction corrections of , , and magnitudes were applied to the calibrated data; the corrections were obtained from the reddening maps of Schlegel et al. (1998). The effect of an uncertainty on the extinction corrections on the GC candidate selection is considered in .
4.2 Color Selection
The final step in deriving a list of GC candidates is to choose objects with colors and magnitudes that are consistent with those of nearby, confirmed GCs at the distance of NGC 7457. This method of selecting GC candidates has been used in our previous survey studies (RZ01; RZ03; RZ04; R07; R10). Here we outline the methodology that is described in detail in RZ01. Assuming a range of GC absolute magnitudes from to based on the globular cluster luminosity function (GCLF) of the Milky Way and other well-studied nearby galaxies (Ashman & Zepf, 1998), we eliminate point sources that are brighter than the brightest GC we would expect at the distance of NGC 7457. We select GC candidates with and colors consistent with those of the Milky Way GCs, but allow for a larger range of metallicities ([Fe/H] = -2.5 to 0.0). Because low luminosity galaxies have smaller total numbers of GCs, we carefully consider those objects which may just barely fail the selection criteria to make sure we have included all likely GC candidates. Additional data by which we can judge the probability of a point source being considered a GC are the radial proximity to the galaxy center and the appearance of the object in archival images (see ).
Figure 3 shows the color selection process for the point sources that passed the extended source cut (see ). Also shown are the colors expected for galaxies of various morphological types from redshifts (RZ01), illustrating where contaminating background galaxies are likely to lie in the color-color plane. We accepted any sources with and and colors (including associated photometric errors) within of the Galactic GC versus relation. We evaluated each object that passed the magnitude and color selection step to make sure it should remain in the final sample. Two objects that were barely outside the color selection but are close to the galaxy center were added back to the GC candidate sample. Three objects which appeared in HST images to be background galaxies (see ) were removed from the GC candidate list. The final sample consists of 136 GC candidates in the WIYN images of NGC 7457; the color-magnitude diagram (CMD) of the GC candidates is shown in Figure 4. Because the Galactic extinction correction is applied systematically to every object, the impact of an uncertainty in the extinction on the GC candidate selection corresponds to a systematic shift of all the point sources in the color-color plane along the reddening vector shown in Figure 3. The GC selection box (as defined by the Milky Way GC system) remains unchanged. We find that significant systematic increases or decreases in the Schlegel et al. (1998) reddening estimate (such as doubling or halving the reddening) make a negligible impact on our selection of GC candidates. At most only 1-2 objects would be added or removed from our GC candidate list based on these changes.
5 Analysis of the Globular Cluster System
5.1 Completeness Testing and Detection Limits
To quantify the point-source detection limits we performed a series of completeness tests using the images employed to detect the GC system. For each test, 200 artificial stars were added to the image; the magnitude of the artificial stars were chosen around 0.2 of a specified value and the adopted PSF was taken as the best-fit average PSF of the image. The identical steps used to detect the point sources in the original images were then performed, recording the fraction of recovered artificial stars. We repeated this process in 0.2 mag intervals over a range of 4-5 magnitudes per filter. Taking the fraction of recovered stars in each magnitude interval then gave a measure of completeness as a function of magnitude which we show in Figure 5. The WIYN images of NGC 7457 have 50% completeness limits of , and .
5.2 Contamination Corrections
In ground-based imaging studies of extragalactic GC populations, sample contamination from foreground Galactic stars and background galaxies is a serious concern. Following the steps from our previous imaging studies, in and we performed a series of analyses to help quantify the degree of contamination from these two sources. We ultimately adopted the contamination estimate from the asymptotic behavior of the GC radial profile as discussed in .
5.2.1 Models of Foreground Galactic Contamination
To estimate the degree of contamination from Galactic foreground stars, we used a Galactic structure model (Mendez & van Altena, 1996; Méndez et al., 2000) to predict the surface density of stars within a given magnitude range and color. We adopted the same Galaxy structure parameters used in our previous studies (position of the Sun; fraction of stars in the disk, thick disk, and halo). Given the magnitude and color ranges from the GC candidate sample, the model predicted a surface density of stars of . NGC 7457 does not have an appreciably high Galactic latitude (, NED); hence this modest degree of contamination does appear to be consistent with the large number of point sources covering a wide range of colors in Figure 3. Because the Galactic structure models do not constrain the range of colors, the model prediction is an upper limit to the degree of Galactic foreground star contamination.
5.2.2 HST imaging of WIYN GC Candidates
An estimate of the contamination in the GC sample due to unresolved background galaxies was obtained by examining the GC candidates in archival HST images. Since many background galaxies will be unresolved in our ground-based images, HST imaging of point sources in our field can show if any GC candidates are actually background galaxies.
For NGC 7457, we downloaded HST WFPC2 data from the Multimission Archive at the Space Telescope Science Institute (MAST)333Based on observations made with the NASA/ESA Hubble Space Telescope, obtained from the data archive at the Space Telescope Science Institute. STScI is operated by AURA, under NASA contract NAS 5-26555.. The retrieved images were six pipeline-reduced, multi-extension FITS files (total exposure time 1380 s) of a central pointing of NGC 7457 in the F555 filter (program GO.5512; PI Faber). These images were also used by CSB08 in their analysis of the NGC 7457 GC system (see ). The images were stacked using the STSDAS task combine. Thirty-three of the WIYN GC candidates were found on the HST image. Following Kundu et al. (1999), we performed aperture photometry of these objects in 0.5 and 3 pixel apertures. The ratio of counts in the larger aperture to the counts in the smaller aperture provides a measure of the central concentration of these objects. Slightly extended background galaxies would show a higher count ratio than the compact GCs, thereby providing an estimate of the fraction of the WIYN GC candidates which might be background galaxies. Three objects in the WIYN GC sample were faint and had high count ratios (ratio ), indicating that they are likely background galaxies. In addition, these objects did not pass the GC candidate selection criteria employed by CSB08 ( color cut and estimated absolute sizes). As noted in , these objects were removed from the final sample of WIYN GC candidates. Considering these three high count ratio objects as background galaxies and the areal coverage of the HST/WFPC2 field, we found (assuming Poisson statistics) as our estimate of the background galaxy surface density.
Given the small areal coverage of the HST images and the correspondingly small numbers of GC candidates considered, our final estimate of the surface density of contaminating objects was determined from the asymptotic behavior of the radial profile of the GC system. We discuss this method and the results in .
5.2.3 Contamination Estimates based on the Asymptotic Behavior of the Radial Profile
Typical wide-field extragalactic GC studies show a central peak in a plot of the azimuthally-averaged surface density of GC candidates as a function of projected radial distance from the host galaxy center. Assuming the observations have covered a sufficient area around the galaxy, this profile will decrease to a constant level when the full radial extent of the GC system has been measured. Thus the outer regions of this profile can yield a measure of the surface density of foreground stars background galaxies (Harris 1986; R10). A measurement of this surface density can then be subtracted from the radial profile to correct for contamination.
We constructed the initial radial profile of NGC 7457’s GC system by counting the number of WIYN GC candidates in concentric circular annuli and computing the effective area in each annulus. We explored the shape of the radial profile in detail, examining the effects of using wider radial bins and different locations for the bin centers. Ultimately we adopted radial bins from from the galaxy center (inner edge of innermost annulus) to (outer edge of outermost annulus) with a width of . Inward of from the galaxy center we have no GC candidates and very little observed area due to the masking of the image. The effective area of each annulus is computed by taking the total area of the annulus and subtracting the area of any masked regions in that annulus. The profile shows a decreasing surface density which falls to a nearly constant level of in the outer three radial bins (), indicating that we have observed the full outer radial extent of the GC system.
The constant level in the three outer bins of the uncorrected radial profile is a good estimate of the surface density of contaminants in the GC candidate sample. The surface density of foreground stars from the Galactic model was ; this is smaller than the asymptotic contaminant level but makes sense if one assumes that background galaxies will also contribute. The background galaxy contamination level as estimated from the HST data was , which is higher than the level from the asymptotic behavior of the profile. It is quite possible that the former is an overestimate and it also has a large uncertainty. Thus we adopted the observed asymptotic correction as the final estimate of the surface density of contaminants. We computed the contamination fraction for each annulus of the radial profile by multiplying the surface density of contaminating objects by the effective area of the annulus and then dividing this number by the number of GC candidates in that bin.
5.3 Coverage of the GCLF
In order to determine the fractional coverage of the GCLF, we assigned our WIYN GC candidates to magnitude bins with a width of magnitudes. We corrected the observed GCLF for both contamination and magnitude incompleteness following the method outlined in RZ01. We accounted for contamination by considering the radial location of each GC candidate, applying the radially dependent contamination fraction determined in as a correction factor. Magnitude incompleteness was determined from the results of the artificial star tests (see and Figure 5) and the range of and colors of the GC candidates. The completeness corrections we applied (the total completeness) accounted for the individual incompleteness in all three filters as described in RZ01. These calculated total completeness corrections were then divided by the number of GC candidates in each magnitude bin to obtain a corrected GCLF. Figure 6 shows the observed GCLF (contamination corrected; shaded histogram) and the completeness-corrected histogram (solid line histogram).
The corrected GCLF was then fit with a Gaussian function to determine the observed coverage of this theoretical GCLF. We assumed a peak absolute magnitude of based on observations of the Milky Way GC system (Ashman & Zepf, 1998). At the assumed distance of NGC 7457 (Table 1), the apparent magnitude peak of the GCLF corresponds to . We eliminated from the fitting the faintest three magnitude bins which had completeness values. We varied the dispersion of the Gaussian fits between and and found the mean fractional coverage of the theoretical GCLF by the observed GCLF was . The Gaussian fits are shown in Figure 6. Varying the magnitude bin sizes between and mag yielded a change in the fractional coverage of to . We account for this variation in our error estimates on the total number of GCs in .
5.4 Combining HST Observations with the WIYN Results
CSB08 used HST/WFPC2 archival images of NGC 7457 in the F555W and F814W filters to select a sample of GC candidates. These observations (proposal GO.5512; PI Faber) were taken during a single pointing, with the PC chip centered on the galaxy center (see Figure 1). The spatial coverage of WFPC2 chip gives radial coverage of the inner of NGC 7457, complementing our WIYN observations which only provide reliable data for . CSB08 select GC candidates based on two criteria: a color cut and an absolute size cut; their final GC candidate list consisted of 77 objects. As noted previously, CSB08 performed follow-up spectroscopy for some of the objects, providing confirmation as GCs for 13 of their GC candidates.
We compared the WIYN and HST GC candidate lists and found 29 of the 77 objects are common to both samples. Of the 48 HST GC candidates which were not detected as GC candidates by our WIYN study, 37 were not detected during the daofind step (see ) due to their spatial proximity to saturation bleed trails and/or their location near the galaxy center. Only six of these 37 objects were missed to due their magnitude being fainter than the detection threshold in the images. Of the remaining 11 of 48 objects that appeared in the HST list but not the WIYN list, seven were rejected because they appeared extended in one or more of the WIYN images (see ). Only two of these seven rejected objects were “borderline” cases. Relaxing our extended source cut criteria would also increase contamination, so we decided not revise our extended source cut based on these results. Lastly, we found that four HST GC candidates were rejected as WIYN GC candidates at the color cut stage (see ). These objects had and colors in the WIYN data that were significantly outside our color-color selection criteria; no reasonable modification to our color cut would have included these objects in our WIYN sample. An additional check on our GC selection criteria comes from considering the thirteen spectroscopically-confirmed GCs. Of these thirteen objects, eight were detected in our WIYN data; the remaining five objects fell in masked regions of our image. For these eight detections, we note that none of the spectroscopically-confirmed GCs were rejected during our GC selection process.
We constructed the radial surface density profile for the HST GC candidates in the following manner. We accounted for magnitude incompleteness by only considering the brightest HST GC candidates, imposing a magnitude cut at the GCLF turnover magnitude of . Since contamination from background galaxies with magnitudes should be relatively small (Kundu et al., 1999), we assumed no contamination. To maintain a uniform comparison with the WIYN GC candidates, we imposed our color cut criteria on the HST GC candidate list. We removed four objects in the HST GC sample which had and colors as measured in the WIYN data which were inconsistent with our color selection. After applying these restrictions, 46 HST GC candidates were used to construct the GCLF and radial profile. The HST GCLF was fit according to the same procedure as the WIYN data; the mean fractional coverage is . Varying the bin sizes changed the fractional coverage by and we include this uncertainty in the final error analysis.
6 Global Properties of the Globular Cluster System
6.1 Radial Distribution of the GC System
We constructed the final radial distribution of NGC 7457’s GC system by binning the WIYN and HST GC candidates into concentric circular annuli spaced apart. The superior resolution of HST yielded GC candidates closer to the galaxy center, so the HST annuli begin at a projected radius of whereas the first WIYN annulus starts at . The radial profile was corrected for missing area, contamination (as appropriate), and magnitude incompleteness in the following manner. The missing area was considered by finding the effective area for each annulus; the area covered by the masked regions in each annulus was computed and accounted for in the surface density calculation. Contamination corrections were applied to the WIYN data using the radially-dependent contamination fractions (see ); for the HST data we assumed no contamination (see ). Lastly we corrected for magnitude incompleteness by dividing each bin by the fractional coverage of the observed WIYN or HST GCLF, respectively. The surface density was computed using the effective area and corrected total numbers for each radial bin; uncertainties in the surface density are from Poisson errors in the number of GCs and number of contaminating objects. Figure 7 shows the radial surface density as a function of projected average radius, where the average radius is the mean radius of the unmasked pixels in that annulus. Table 3 lists the corresponding data: average radius, surface density, errors, fractional areal coverage of each annulus (area of unmasked pixels/total area), and data source (either WIYN or HST). Because the GC system of NGC 7457 is found to have a large ellipticity (see ), we experimented with the use of concentric elliptical bins to construct the radial surface density profile. We found no significant dependence of the radial profile or profile fits (see discussion below) on the choice of bin shape.
The radial profile of the NGC 7457 GC system follows the typical trend seen in our other wide field imaging studies (RZ01; RZ03; RZ04; R07; R10): there is a sharp rise in the surface density approaching the galaxy center and smooth decrease with projected radius. Although the WIYN data does measure the surface density of GCs quite close to the galaxy center (), the addition of the HST data allows us to probe nearly three times further, to . However, the HST/WFPC field-of-view is insufficient to cover the full radial extent of the GC profile as evidenced by the WIYN data in the continued decline of the radial profile outside of . This underscores the importance of combining by wide-field imaging to observe the full radial extent of the surface density profile with high-resolution HST data which can measure the regions of the profile closer to the galaxy center (R10). We found that the surface density of GCs falls to zero within the errors in the radial bin centered at and remains consistent with zero outward of this radius. R07 present an empirical relation between the radial extent of the GC system and the galaxy mass for other galaxies observed for our wide-field GC system survey. The radial extent of the GC system was defined as the radius at which the surface density goes to zero within the errors and remains zero. This definition is therefore sensitive to the details of our analysis, including the magnitude completeness and the contamination correction to the radial profile. In addition, GCs are often found at very large radii ( kpc for the Milky Way), so there are very likely GCs in NGC 7457 beyond our measure of the radial extent. We compared our findings on the radial extent for NGC 7457 to the updated results presented in R10. For our assumed distance (Table 1), we found a radial extent of kpc, where the uncertainty in the radial extent includes the uncertainty in the distance modulus and a one bin-width uncertainty in the determination of the radial extent from the surface density profile. For the galaxy mass, we used a mass-to-light ratio of for S0 galaxies from Zepf & Ashman (1993) in combination with our derived (Table 1) and find . Refitting the radial extent-mass relation with a second-order polynomial using the result for NGC 7457 with the data in R10 yields coefficients consistent with those of R10 within the errors.
The radial distribution of GCs was investigated further by fitting the corrected radial profile with various functional forms: a power law profile (), de Vaucouleurs profile (), and Sérsic profile (). The Sérsic profile fitting yielded highly uncertain results; a wide range of possible parameters give very similar values. Test data sets with comparable numbers of data points and scatter to our observed profile were constructed to better understand this behavior. We found that the small numbers of data points in inner regions of the radial profile and a strong sensitivity to the initial guesses for the fit parameters yield a model that is not well constrained by the data. The de Vaucouleurs law and power law both provided good fits to the data, intersecting nearly all the points in the profile; the reduced chi-squared value for the power law (0.70) was slightly smaller than that for the de Vaucouleurs law (0.92). The fit parameters are given in Table 4 and Figure 7 shows the de Vaucouleurs and power law fits to the data. We discuss the calculation of the total number of GCs from the integration of the radial profile in .
Figure 8 compares the radial surface density of NGC 7457’s GC system to the radial distribution of the galaxy light. In the figure, the surface brightness profile derived in has been converted to linear (intensity) units and scaled to the GC surface density at an arbitrary point, . The profiles have similar shapes in the inner , but the GC profile remains relatively flat at larger radii even as the galaxy light decreases exponentially. This is consistent with the general picture of GC systems as being more spatially extended than the parent galaxy light Harris (1991); Ashman & Zepf (1998); Brodie & Strader (2006). We caution, however, that the errors in the GC surface density become large in the outer portions of the profile and hence the difference between the profiles – although suggestive – is not statistically significant.
6.2 Azimuthal Distribution of the GC System
Figure 9 shows the positions of the WIYN GC candidates on the WIYN frame. It is readily apparent that the GC candidates do not show a uniform azimuthal distribution about the galaxy center. Instead the GC system appears to be preferentially aligned along the major axis of the galaxy in an elliptical distribution. In order to study the azimuthal distribution of the GC system of NGC 7457, we implemented the method of moments algorithm (Trumpler & Weaver, 1953) to estimate the ellipticity and position angle of the GC system.
For our analysis we followed the methodology outlined by McLaughlin et al. (1994) and Carter & Metcalfe (1980), using an iterative method to determine and . First, the GCs within a circular aperture were used to derive an initial unbiased estimate of and . This initial estimate is next used to define an elliptical aperture and GCs within this ellipse are used to recompute and . For the elliptical aperture, we scaled the semi-major axis to the radius of the initial circular annuli to include as much of the GC population as possible in the calculation (Carter & Metcalfe, 1980). The final ellipse parameters were determined after performing these calculations to some predefined tolerance. The method of moments also requires that the measurement annuli lie entirely on the frame. Because of the position of NGC 7457 on one side of the images, this requirement means we are restricted to examining the ellipticity and position angle within the central of the galaxy (projected radius of kpc). Lastly, we hold the center of the GC distribution constant at the same position of the center of the galaxy light we used to derive the GC surface density profile.
For the inner of the GC system, we find an ellipticity and position angle (measured east of north) determined from 46 GC candidates. Our uncertainties were estimated via Monte Carlo bootstrapping; comparable but slightly larger uncertainties of in ellipticity and in position angle are found from the simulation-derived formulae of Carter & Metcalfe (1980). In general we find good agreement between the ellipticity and position angle of the GC system and the galaxy isophotes, respectively. Our derived value of for the GC system is slightly lower than the average galaxy position angle of , although it is consistent within the errors with the entire range of galaxy isophote position angles. Similarly, we measure a larger ellipticity for the GC system () than for the galaxy light ( from to ), but this difference is only significant at the level, depending on the adopted error in the GC system ellipticity.
Because we have several masked (unmeasurable) regions on our images – particularly the central region of the galaxy where the galaxy-subtraction process is imperfect – we investigated whether these regions impart a bias into the determination of the ellipticity and position angle. We compared the results from two Monte Carlo experiments of simulated GC spatial distributions: one which ignored masked regions and one, like our observations, where the masks were present. For both the masked and unmasked cases we created 10,000 GC systems and used the method of moments algorithm to derive ellipticities and position angles. A single GC system was simulated by randomly placing GCs in elliptical bins which matched the ellipticity, position angle, and radial surface density profile derived for the NGC 7457 GC system; GC positions were further restricted if the the masked regions were being considered. The total number of GCs in each simulated system was set to match the NGC 7457 observations. Comparing the results from these two experiments, we found only a slight bias towards higher ellipticities of introduced by the masked regions. Similarly for the position angle we find only a slight bias of towards a larger position angle. Although these biases are systematic and not random uncertainties, they are well below our measurement error.
Lastly we examined the likelihood that one would measure the derived ellipticity and position angle of the NGC 7457 GC system by chance from a circular (i.e. azimuthally random) GC distribution. In general, an intrinsically circular spatial distribution analyzed via the method of moments will systematically return a non-zero ellipticity. This is especially problematic when using small numbers of objects (Carter & Metcalfe, 1980). So, given the total number of objects matching our observed sample, we wished to know how often one would measure a large ellipticity because of small number effects even if the spatial distribution is intrinsically circular. To investigate this, we examined the probability of obtaining our observed and from a random distribution that accounted for the masked regions. We simulated 10,000 GC spatial distributions with no ellipticity by placing GCs randomly in azimuth around the galaxy center, matching the NGC 7457 observations of the radial surface density profile and total number of GCs. Examining the resulting distributions of and , we find the probability of obtaining simultaneously the measured ellipticity () and position angle () within of their measured values is only . Hence we can reject the hypothesis that the observed ellipticity and position angle were observed by-chance from a azimuthally-random distribution at the confidence level.
6.3 Color Distribution
In order to investigate the relative populations of blue (lower-metallicity) and red (higher-metallicity) GCs in NGC 7457, we first created a subsample from our total GC candidate list that has a magnitude completeness of in all three filters (see RZ01 for details and methodology). We found 65 out of the 136 WIYN GC candidates met this criteria and we refer to this group as the “90% sample”. We can further minimize the fraction of contaminants in this sample by imposing a radial cut on the 90% sample at (see ), giving a total of 40 GC candidates. The color distribution for the 90% sample and the radially-constrained 90% sample are shown in the bottom panel of Figure 10. For comparison, the subset of the Milky Way GCs with integrated colors (82 GCs; Harris 1996) are shown in the top panel of Figure 10. A Kolmogorov-Smirnov test rejects the hypothesis that the Milky Way GC subset and the NGC 7457 90% sample have the same distribution at only the 89% significance level; the K-S test does not show strong statistical evidence to reject a common population distribution.
We examined the GC colors as a function of projected radius, both for the 90% and 90% radially-constrained samples, to test for a color gradient in the NGC 7457 GC system. Linear fits to the data showed best-fit slopes consistent with zero within the errors. Thus we find no evidence of a statistically significant color gradient, although the numbers of GCs in the 90% samples are small.
We ran the Gaussian mixture modelling (GMM) code from Muratov & Gnedin (2010) on our 90% sample. The GMM code uses several statistics to test whether the color distribution is better described by one or two Gaussian functions. In addition to reproducing the results of the KMM algorithm from Ashman et al. (1994), the GMM code also uses the kurtosis of the distribution and the separation of the means (relative to their widths) as complementary tests of bimodality. Like KMM, GMM allows one to test both the homoscedastic (two Gaussians with the same dispersion) and heteroscedastic (different dispersions) cases. For our 90% sample of 65 objects, the mixture modelling results show that the unimodal hypothesis could only be rejected at the 72% confidence level (heteroscedastic case). That is, we do not detect color bimodality at a statistically significant level. If we also consider the value peak separation statistic as a complementary test of bimodality, the unimodal hypothesis could only be ruled out at the 28% confidence level and hence this statistic also strongly argues against bimodality. We should stress that mixture modelling with small numbers of objects inherently lowers the reliability of detecting bimodality (Ashman et al., 1994). As the number of objects decreases, an increasingly large separation between the distribution means is required to strongly detect bimodality. Our results are consistent with previous studies where bimodality was also not detected (C99, CSB08) in NGC 7457’s GC system. Both studies performed mixture modelling on their respective data and find the distribution consistent with a single Gaussian peaking at (CSB08) and (C99; their maximum likelihood estimate). C99 also examine the colors and find the data consistent with a unimodal distribution with a mean (their maximum likelihood estimate). Despite the lack of an observed bimodality, both blue and red GCs candidates are detected. C99 claimed that NGC 7457 lacks a population of metal-poor GCs similar to the halo GCs in the Milky Way (Zinn, 1993). In contrast, we have GC candidates (at small projected radii, where the fraction of contaminants is lowest) with colors as blue as the most metal-poor Galactic GCs ( or [Fe/H] to ). Additionally, CSB08 have spectroscopically-confirmed GCs in NGC 7457 with metallicities as low as .
The broad color distribution of GCs in NGC 7457 also argues for the presence of both metal-rich and metal-poor populations. For our 90% sample, we found a mean color of and a distribution width of ; for comparison, the Milky Way GC system has a mean color of and distribution width of (Harris 1996; see top panel of Figure 10). Even after imposing a radial cut to minimize contamination, the WIYN sample still includes blue and red GC candidates consistent with those observed in the Galaxy. C99 explain the observed broad distribution and lack of bimodality as arising from the presence of the usual old metal-rich and metal-poor populations, but with a difference in their mean metallicities (e.g. peak separation) that is smaller than could be detected. CSB08 offer a different picture; they explain the broad distribution by the presence of an intermediate-age population, which in combination with the typical metal-rich and metal-poor populations causes the large peak in the distribution at (). Spectroscopic data for a large sample of GCs in NGC 7457 would thus be invaluable in helping to discriminate between alternative explanations of the broad color distribution.
6.4 Total Numbers of GCs and Global Specific Frequency
We integrated the best-fit de Vaucouleurs profile to obtain an estimate of the total number of GCs in NGC 7457. Although the power law provided a slightly better fit to the surface density data (see Table 4), it predicts a steeply-rising surface density at small radius (and infinite surface density at ) so is not a physical useful model for the purposes of integration. Integrating the de Vaucouleurs law from (the inside edge of the innermost radial bin) to (the outer edge of the bin where the GC surface density drops to zero within the errors) yields 200 GCs. We have no information about the surface density of GCs inside (308 pc for our assumed distance) so we consider two scenarios. The assumption that the de Vaucouleurs law extends to would add another 10 GCs to the total. Assuming instead that the radial distribution inside is flat (with the same surface density as in the innermost bin) yields 1.5 GCs. Averaging these results yields a final value of GCs in NGC 7457. The error in was calculated as described in our previous GC system studies; it includes uncertainties in: (1) fractional coverage of the GCLF, given choices in bin sizes and dispersion; (2) the number of GCs and contaminating objects, assuming Poisson statistics; (3) the number of GCs in the central, unobserved regions of the galaxy. The uncertainties were added in quadrature to give the total uncertainty in .
For comparison, a manual integration of the GC surface density profile was done as follows. We assumed that the measured surface density in each radial bin was constant across that bin, and using the calculated area of each bin obtained a number of GCs in that bin. Because the overlapping WIYN and HST bins complicate the area calculation, we used the HST data for and the WIYN data for . The manual summation was performed over the same range as the best-fit model integration ( to ) yielding a total of GCs. If we again assume a flat inner profile for we estimate a total number of GCs , in excellent agreement with the profile integration.
With an estimate of the total number of GCs, we can calculate the luminosity- and mass-normalized specific frequencies of the NGC 7457 GC system. The luminosity-normalized specific frequency is defined as total number of GCs normalized by the band luminosity of the galaxy (Harris & van den Bergh, 1981), or
| (3) |
The mass-normalized specific frequency is defined as the total number of GCs normalized by the stellar mass of the galaxy (Zepf & Ashman, 1993), or
| (4) |
Using the total absolute magnitude and galaxy (stellar) mass from Table 1 with a total number of GCs , we find specific frequencies of and . The errors in and include the error in as well as the uncertainty in the galaxy magnitude; the uncertainties in these four quantities were added in quadrature to give the total uncertainty in and . We assume that the uncertainty in the galaxy magnitude is mag, the value of the difference between our derived apparent magnitude and that of Fisher & Drory (2008). We give our final values of , , and in Table 5.
C99 derived a specific frequency of from an estimated and assumed absolute magnitude of . Thus our value of is consistent with C99 within the errors. The approximately 30 () fewer GCs estimated by C99 compared to this study accounts for the difference in our derived values given our nearly identical assumed values of . The differences in are likely due to variations in analysis techniques; C99 impose a stricter band object detection threshold as well as perform two color-color cuts (versus our single color-color cut) with a tighter ( versus our ) selection criteria.
6.4.1 Mass-Normalized Specific Frequency of Metal-Poor GCs
In order to better understand the formation of the first generation of GCs in giant galaxies, we are interested in comparing the number of blue, metal-poor GCs in this galaxy to the number for other galaxies (Rhode et al., 2005). Because the mixture modelling results argue against color bimodality, we do not adopt the resulting red and blue fractions of GCs from these tests. Instead, we take a very simple approach and estimate the number of blue and red clusters using the empirically-determined color separation between the blue and red populations for elliptical galaxies of (RZ01, RZ04, Kundu & Whitmore 2001a). For the 90% sample, we find that 55% of the GC candidates have a color bluer than 1.23. If we impose a radial cut on the 90% sample (; see ) in order to minimize contamination, we find that 60% of GC candidates have a color bluer than 1.23. If we take the fraction of blue GCs in our total sample as the average of these two estimates, we find the mass-normalized number of blue GCs of . Compared to the other galaxies in our wide-field survey (see R10), this value of is higher than other galaxies of similar mass. By morphological type, the weighted mean values of for the spirals and ellipticals in our wide-field survey are (9 spirals, including the Milky Way and M31; R10)and (7 ellipticals; R10), respectively. Although NGC 7457 appears to have quite a high value of compared to our survey results, NGC 7457 is currently the lowest mass galaxy in our sample and therefore few galaxies are available for direct, systematic comparision. The addition to our survey of galaxies in the low mass regime () will be critical to understanding the value of for NGC 7457 and other low mass galaxies.
7 Summary and Conclusions
This study investigated the global properties of the GC system of the field S0 galaxy NGC 7457, combining wide-field WIYN Minimosaic imaging data with archival and published HST/WFPC2 data. Here we summarize our main results:
-
1.
We performed surface photometry on the WIYN image of NGC 7457 and measure a total magnitude of 11.07. The light profile for the galaxy follows a de Vaucouleurs law in the inner and declines exponentially from to , the limit of our photometry.
-
2.
We constructed a radial surface density profile for the GC system using both the WIYN and HST data. The surface density of the system goes from at (1.4 kpc) to zero (within the errors) at (12.5 kpc). The GC surface density and galaxy surface brightness profiles are similar in the inner (3.9 kpc). Although the GC profile appears to flatten at larger radii relative to the galaxy light profile, the uncertainties in the surface density in the outer portions of the profile are significant.
-
3.
The GC radial surface density profile was fit with both de Vaucouleurs and power laws. From the integration of the best-fit de Vaucouleurs profile, we derive a total number of GCs of . Using our galaxy photometry, we found a -band normalized specific frequency of , a mass-normalized specific frequency of , and a mass-normalized number of blue (metal-poor) GCs of
-
4.
The GCs in NGC 7457 are distributed in an elliptical configuration, with the major axis of the GC system aligned with the galaxy’s major axis. We measure a GC system ellipticity , which is consistent with the average ellipticity of the galaxy.
-
5.
We find that the B-R color distribution of NGC 7457’s GC system is not significantly bimodal. However, the color distribution appears similar to that of the Milky Way GC system, with both very blue and very red GC candidates close to the galaxy center, where contamination from non-GCs should be minimized in our sample. Lastly, we find no evidence for a color gradient in NGC 7457’s GC system.
We can explore these results in light of various formation and evolution models for S0 galaxies. The typical formation scenario for lenticular galaxies involves the transformation of S0s from spiral galaxies as star formation is either suppressed or altogether halted due to the removal of gas from the galaxy. Observational support for such a transformation scenario comes from tracing the decreasing ratio of spiral to S0 galaxies in galaxy clusters with decreasing cluster redshift (Dressler et al., 1997). Naturally then, mechanisms for this spiral-lenticular evolution have generally focused on processes for disk gas removal in a cluster environment. Boselli & Gavazzi (2006) give an overview of such mechanisms, including tidal interactions, ram-pressure stripping, galaxy harassment, viscous stripping, thermal evaporation, and galaxy starvation/strangulation. However, because NGC 7457 is located in the field, we are particularly interested in S0 galaxy formation scenarios that do not rely on a cluster environment for gas removal or star-formation suppression.
The luminosity-normalized specific frequency of GCs has recently been proposed as a means of tracing “galaxy fading” in lenticulars (Aragón-Salamanca et al., 2006; Barr et al., 2007). If S0 galaxies form from gas removal in spirals then, as star formation declines and the stellar populations age, the total -band luminosity of the galaxy will decrease and the global color of the galaxy should become more red. If in addition the total number of GCs in the galaxy remains constant (a key assumption which ignores GC destruction mechanisms), the decreasing -band magnitude should lead to an increasing as the system ages. Such a correlation between and galaxy color was found by Aragón-Salamanca et al. (2006) using the global galaxy colors from the photometry of Poulain & Nieto (1994) and Prugniel & Heraudeau (1998) with the “local” values from the HST/WFPC2 sample of lenticulars from Kundu & Whitmore (2001b). Here the local specific frequency is defined as the specific frequency within the HST/WFPC2 field-of-view, in contrast to a global value derived from observations like ours, where the full radial extent of the GC system and galaxy light have been observed.
To compare our results for NGC 7457 to this trend, we estimated a local specific frequency of by only considering the GC radial profile and integrated galaxy light in the central . From Prugniel & Heraudeau (1998), the global galaxy colors for NGC 7457 are , , and . We find that NGC 7457 is not consistent with the observed color- trend of Aragón-Salamanca et al. (2006), particularly in the plane where the correlation has the least amount of scatter (see their Figure 2). NGC 7457 appears to be either too blue for its or has a much larger for its observed color. Although NGC 7457 shows better agreement in the and planes, the overall scatter in the trends are significant. While an inconsistency with the global color- trend may suggest that fading has been largely unimportant in the evolution of NGC 7457, it should be noted that this relation was derived from a sample comprised almost entirely of cluster or group S0 galaxies. Thus the galaxy color- trend likely includes an environmental bias and should be explored with a sample of lenticulars which cover a wider range of environments.
As an alternative model of S0 galaxy formation, Bekki (1998) and Bournaud et al. (2005) have shown that mergers of unequal-mass, gas-rich spirals (mass ratio ) can produce remnants with the observed properties of S0s. In the Bekki (1998) simulations, vertical dynamical heating in the disk of the more massive galaxy creates the thickened disk component often observed in S0 galaxies. The tidal interations and subsequent merging of the galaxies remove the majority of the gas in two moderate bursts of star formation, resulting in a central concentration of new stars. Similarly, major mergers have been proposed as a formation mechanism for new populations of GCs (Schweizer, 1987; Ashman & Zepf, 1992). The larger GC systems of ellipticals relative to spirals (as traced by specific frequencies) may be due at least in part to additional GCs formed during the mergers. Therefore a merger, if it were gas-rich and created GCs, might help explain the relatively large specific frequencies of NGC 7457 (, ) for its mass. For comparison, we find average specific frequencies for ellipticals of , (6 galaxies; R10) versus , for spirals (9 galaxies including M31 and the Galaxy; R10). By total numbers of GCs, however, NGC 7457 is more consistent () with the average value for spirals (; 9 galaxies, including M31 and the Galaxy). Determining the global properties of GC systems for a larger sample of S0s will be critical in refining the comparison across morphological types.
Additional evidence for a merger origin for NGC 7457 comes from the discovery of a counter-rotating galaxy core (Sil’chenko et al., 2002). Such kinematically distinct cores are thought to be signatures of merger events (see Forbes et al. 1996 and references therein) and can arise in simulations of unequal mass spiral-spiral mergers (Balcells & González, 1998). Sil’chenko et al. (2002) studied NGC 7457 using integral field unit spectroscopy and derived a two dimensional line-of-sight velocity map of the galaxy’s central region. These data also provided absorption line equivalent widths; using Lick indices (Worthey, 1994), ages and metallicities of the stellar populations were explored. In addition to observing a counter-rotating core, Sil’chenko et al. (2002) found that the core was significantly younger (age Gyr) and more metal-rich (approximately solar) than the surrounding bulge region (age Gyr; approximately one-half solar metallicity). CSB08 provided circumstantial evidence for a GC population with an age comparable to that of the core ( Gyr), noting that this GC population could have been formed in the same star formation event that resulted in the young, chemically-distinct core. If such an intermediate age GC population is confirmed, this could be additional evidence for an increased number of GCs resulting from star formation in a merger event.
The evidence from surface photometry of a classical bulge in NGC 7457 (Fisher & Drory 2008, 2010; see ) is also suggestive of a merger history in this galaxy. Classical bulges are thought to arise as a result of merger events, while pseudobulge formation is associated with internal dynamic processes such as bars, ovals, and spiral structure (Kormendy & Kennicutt, 2004; Combes, 2009). As noted by CSB08, the large number of metal-rich GCs in NGC 7457 would also be consistent with a merger-built bulge, assuming such mergers were sufficiently gas-rich and included GC formation. However, it is not clear why the central velocity dispersion of this galaxy (; Sil’chenko et al. 2002, Cherepashchuk et al. 2010) is low like a pseudobulge if the bulge was formed from mergers; merger events should give rise to a dynamically-hot bulge (see Fisher & Drory 2010 and references therein). Furthermore, both the estimated total number of GCs in NGC 7457 and the GC color distribution are similar to the Milky Way, which has a pseudobulge (Kormendy & Kennicutt, 2004) and may only have a small merger-built classical bulge component (Shen et al., 2010). Additional studies of the core and bulge regions in NGC 7457 will be necessary to further explore the role of merger or secular processes.
Further insights into formation scenarios could be gained from a large-sample spectroscopic study of GCs in NGC 7457. Although we have detected a very elliptical GC spatial distribution, without kinematic data it is difficult to interpret this observation. An inclined, disky population of GCs could possibly reproduce the observed elliptical distribution. The dynamics of GC systems in E/S0s formed in spiral-spiral mergers has been explored by Bekki et al. (2005); kinematic data on GCs in NGC 7457 would give an additional means of investigating a possible merger history in this galaxy. Thus future spectroscopic studies of GCs in NGC 7457 could provide key data for understanding the formation and evolution of this galaxy, both in determining GC ages and exploring the kinematics of the GC system.
References
- Aragón-Salamanca et al. (2006) Aragón-Salamanca, A., Bedregal, A. G., & Merrifield, M. R. 2006, A&A, 458, 101
- Ashman & Zepf (1992) Ashman, K. M., & Zepf, S. E. 1992, ApJ, 384, 50
- Ashman & Zepf (1998) Ashman, K. M., & Zepf, S. E. 1998, Globular cluster systems (Cambridge: Cambridge Univ. Press)
- Ashman et al. (1994) Ashman, K. M., Bird, C. M., & Zepf, S. E. 1994, AJ, 108, 2348
- Balcells & González (1998) Balcells, M., & González, A. C. 1998, ApJ, 505, L109
- Balcells & Peletier (1994) Balcells, M., & Peletier, R. F. 1994, AJ, 107, 135
- Barr et al. (2007) Barr, J. M., Bedregal, A. G., Aragón-Salamanca, A., Merrifield, M. R., & Bamford, S. P. 2007, A&A, 470, 173
- Bekki (1998) Bekki, K. 1998, ApJ, 502, L133
- Bekki et al. (2005) Bekki, K., Beasley, M. A., Brodie, J. P., & Forbes, D. A. 2005, MNRAS, 363, 1211
- Boselli & Gavazzi (2006) Boselli, A., & Gavazzi, G. 2006, PASP, 118, 517
- Bournaud et al. (2005) Bournaud, F., Jog, C. J., & Combes, F. 2005, A&A, 437, 69
- Brodie & Huchra (1991) Brodie, J. P., & Huchra, J. P. 1991, ApJ, 379, 157
- Brodie & Strader (2006) Brodie, J. P., & Strader, J. 2006, ARA&A, 44, 193
- Carter & Metcalfe (1980) Carter, D., & Metcalfe, N. 1980, MNRAS, 191, 325
- Chapelon et al. (1999) Chapelon, S., Buat, V., Burgarella, D., & Kissler-Patig, M. 1999, A&A, 346, 721 (C99)
- Chomiuk et al. (2008) Chomiuk, L., Strader, J., & Brodie, J. P. 2008, AJ, 136, 234 (CSB08)
- Combes (2009) Combes, F. 2009, in ASP Conf. Ser. 419, Galaxy Evolution: Emerging Insights and Future Challenges, ed. S. Jogee et al. (San Francisco, CA: ASP), 31
- de Vaucouleurs et al. (1991) de Vaucouleurs, G., de Vaucouleurs, A., Corwin, H. G., Jr., Buta, R. J., Paturel, G., & Fouque, P. 1991, Third Reference Catalog of Bright Galaxies (New York: Springer)
- Dressler et al. (1997) Dressler, A., et al. 1997, ApJ, 490, 577
- Fisher & Drory (2008) Fisher, D. B., & Drory, N. 2008, AJ, 136, 773
- Fisher & Drory (2010) Fisher, D. B., & Drory, N. 2010, ApJ, 716, 942
- Forbes et al. (1996) Forbes, D. A., Franx, M., Illingworth, G. D., & Carollo, C. M. 1996, ApJ, 467, 126
- Harris (1986) Harris, W. E. 1986, AJ, 91, 822
- Harris (1991) Harris, W. E. 1991, ARA&A, 29, 543
- Harris (1996) Harris, W. E. 1996, AJ, 112, 1487
- Harris & van den Bergh (1981) Harris, W. E., & van den Bergh, S. 1981, AJ, 86, 1627
- Ho & Filippenko (1996) Ho, L. C., & Filippenko, A. V. 1996, ApJ, 472, 600
- Holtzman et al. (1992) Holtzman, J. A., et al. 1992, AJ, 103, 691
- Jedrzejewski (1987) Jedrzejewski, R. I. 1987, MNRAS, 226, 747
- Kormendy & Kennicutt (2004) Kormendy, J., & Kennicutt, R. C., Jr. 2004, ARA&A, 42, 603
- Kundu et al. (1999) Kundu, A., Whitmore, B. C., Sparks, W. B., Macchetto, F. D., Zepf, S. E., & Ashman, K. M. 1999, ApJ, 513, 733
- Kundu & Whitmore (2001a) Kundu, A., & Whitmore, B. C. 2001, AJ, 121, 2950
- Kundu & Whitmore (2001b) Kundu, A., & Whitmore, B. C. 2001, AJ, 122, 1251
- Landolt (1992) Landolt, A. U. 1992, AJ, 104, 340
- Méndez et al. (2000) Méndez, R. A., Platais, I., Girard, T. M., Kozhurina-Platais, V., & van Altena, W. F. 2000, AJ, 119, 813
- Mendez & van Altena (1996) Mendez, R. A., & van Altena, W. F. 1996, AJ, 112, 655
- McLaughlin et al. (1994) McLaughlin, D. E., Harris, W. E., & Hanes, D. A. 1994, ApJ, 422, 486
- Muratov & Gnedin (2010) Muratov, A. L., & Gnedin, O. Y. 2010, ApJ, 718, 1266
- Peng et al. (2006) Peng, E. W., et al. 2006, ApJ, 639, 95
- Peng et al. (2008) Peng, E. W., et al. 2008, ApJ, 681, 197
- Poulain & Nieto (1994) Poulain, P., & Nieto, J.-L. 1994, A&AS, 103, 573
- Prugniel & Heraudeau (1998) Prugniel, P., & Heraudeau, P. 1998, A&AS, 128, 299
- Rhode & Zepf (2001) Rhode, K. L., & Zepf, S. E. 2001, AJ, 121, 210 (RZ01)
- Rhode & Zepf (2003) Rhode, K. L., & Zepf, S. E. 2003, AJ, 126, 2307 (RZ03)
- Rhode & Zepf (2004) Rhode, K. L., & Zepf, S. E. 2004, AJ, 127, 302 (RZ04)
- Rhode et al. (2007) Rhode, K. L., Zepf, S. E., Kundu, A., & Larner, A. N. 2007, AJ, 134, 1403 (R07)
- Rhode et al. (2005) Rhode, K. L., Zepf, S. E., & Santos, M. R. 2005, ApJ, 630, L21 (R05)
- Rhode et al. (2010) Rhode, K. L., Windschitl, J. L., & Young, M. D. 2010, AJ, 140, 430 (R10)
- Sandage (1961) Sandage, A. 1961, The Hubble Atlas of Galaxies (Washington: Carnegie Inst. Washington)
- Schlegel et al. (1998) Schlegel, D. J., Finkbeiner, D. P., & Davis, M. 1998, ApJ, 500, 525
- Schweizer (1987) Schweizer, F. 1987, in Nearly Normal Galaxies: From the Planck Time to the Present, ed. S. M. Faber (New York: Springer-Verlag), 18
- Shen et al. (2010) Shen, J., Rich, R. M., Kormendy, J., Howard, C. D., De Propris, R., & Kunder, A. 2010, ApJ, 720, L72
- Searle & Zinn (1978) Searle, L., & Zinn, R. 1978, ApJ, 225, 357
- Sil’chenko et al. (2002) Sil’chenko, O. K., Afanasiev, V. L., Chavushyan, V. H., & Valdes, J. R. 2002, ApJ, 577, 668
- Simien & Prugniel (1997) Simien, F., & Prugniel, P. 1997, A&AS, 126, 519
- Spitler et al. (2008) Spitler, L. R., Forbes, D. A., Strader, J., Brodie, J. P., & Gallagher, J. S. 2008, MNRAS, 385, 361
- Tonry et al. (2001) Tonry, J. L., Dressler, A., Blakeslee, J. P., Ajhar, E. A., Fletcher, A. B., Luppino, G. A., Metzger, M. R., & Moore, C. B. 2001, ApJ, 546, 681
- Trumpler & Weaver (1953) Trumpler, R. J., & Weaver, H. F. 1953, Statistical Astronomy, (New York: Dover)
- Tully (1988) Tully, R. B. 1988, Nearby Galaxies Catalog (New York: Cambridge Univ. Press)
- Whitmore et al. (1993) Whitmore, B. C., Schweizer, F., Leitherer, C., Borne, K., & Robert, C. 1993, AJ, 106, 1354
- Worthey (1994) Worthey, G. 1994, ApJS, 95, 107
- Zepf & Ashman (1993) Zepf, S. E., & Ashman, K. M. 1993, MNRAS, 264, 611
- Zinn (1993) Zinn, R. 1993, in ASP Conf. Ser. 48, The Globular Cluster-Galaxy Connection, ed. G. H. Smith & J. P. Brodie (San Francisco, CA: ASP), 38


| Parameter | Value | Reference |
| Type | S01 | Sandage (1961) |
| 11.07 | This study | |
| Tonry et al. (2001) | ||
| -19.54 | and | |
| 0.168 | Schlegel et al. (1998) | |
| Distance | 13.2 Mpc | Tonry et al. (2001) |
| 812 | Simien & Prugniel (1997) | |
| Inclination | This study | |
| 10.6 | and |
| SMA (arcsec) | (degrees) | |||
|---|---|---|---|---|
| 2.10 | 18.103 | |||
| 2.31 | 18.204 | |||
| 2.54 | 18.305 | |||
| 2.79 | 18.408 | |||
| 3.07 | 18.509 | |||
| 3.38 | 18.608 | |||
| 3.72 | 18.716 | |||
| 4.09 | 18.810 | |||
| 4.50 | 18.928 | |||
| 4.94 | 19.034 | |||
| 5.44 | 19.145 | |||
| 5.98 | 19.254 | |||
| 6.58 | 19.363 | |||
| 7.24 | 19.469 | |||
| 7.96 | 19.571 | |||
| 8.76 | 19.669 | |||
| 9.64 | 19.759 | |||
| 10.60 | 19.853 | |||
| 11.66 | 19.927 | |||
| 12.83 | 20.006 | |||
| 14.11 | 20.105 | |||
| 15.52 | 20.224 | |||
| 17.07 | 20.334 | |||
| 18.78 | 20.452 | |||
| 20.66 | 20.577 | |||
| 22.72 | 20.701 | |||
| 24.99 | 20.828 | |||
| 27.49 | 20.952 | |||
| 30.24 | 21.079 | |||
| 33.27 | 21.200 | |||
| 36.59 | 21.355 | |||
| 40.25 | 21.530 | |||
| 44.28 | 21.693 | |||
| 48.70 | 21.921 | |||
| 53.57 | 22.098 | |||
| 58.93 | 22.235 | |||
| 64.83 | 22.412 | |||
| 71.31 | 22.644 | |||
| 78.44 | 22.925 | |||
| 86.28 | 23.224 | |||
| 94.91 | 23.557 | |||
| 104.40 | 23.960 | |||
| 114.84 | 24.496 | |||
| 126.33 | 25.007 | |||
| 138.96 | 25.498 |
Note. — SMA is the semi-major axes of the elliptical isophotes. The values of are the total magnitude of the galaxy interior to SMA. The values of PA are the position angle of the ellipse isophotes measured in degrees east of north.
| Radius | Surface Density | Fractional Coverage | Source |
|---|---|---|---|
| 0.4 | 0.66 | ||
| 0.6 | 0.78 | WIYN | |
| 0.9 | 0.63 | ||
| 1.0 | 0.93 | WIYN | |
| 1.3 | 0.50 | ||
| 1.5 | 0.86 | WIYN | |
| 1.7 | 0.09 | ||
| 2.0 | 0.89 | WIYN | |
| 2.5 | 0.88 | WIYN | |
| 3.0 | 0.74 | WIYN | |
| 3.5 | 0.70 | WIYN | |
| 4.0 | 0.68 | WIYN | |
| 4.5 | 0.62 | WIYN | |
| 5.0 | 0.48 | WIYN | |
| 5.5 | 0.34 | WIYN | |
| 6.0 | 0.29 | WIYN | |
| 6.5 | 0.25 | WIYN | |
| 7.0 | 0.23 | WIYN | |
| 7.5 | 0.14 | WIYN |
Note. — Negative surface densities can occur due to the application of the contamination correction.
| Profile Fit | |||
|---|---|---|---|
| Power Law | 0.70 | ||
| de Vaucouleurs Law | 0.92 |
| Parameter | Value |
|---|---|