![[Uncaptioned image]](/html/1106.4780/assets/x1.png)
Dynamical evolution of stellar clusters
Mark Gieles
Institute of Astronomy, University of Cambridge, Madingley Road, Cambridge, CB3 0HA, UK
Abstract
The evolution of star clusters is determined by several internal and external processes. Here we focus on two dominant internal effects, namely energy exchange between stars through close encounters (two-body relaxation) and mass-loss of the member stars through stellar winds and supernovae explosions. Despite the fact that the former operates on the relaxation timescale of the cluster and the latter on a stellar evolution timescale, these processes work together in driving a nearly self-similar expansion, without forming (hard) binaries. Low-mass clusters expand more, such that after some time the radii of clusters depend very little on their masses, even if all clusters have the same (surface) density initially. Throughout it is assumed that star clusters are in virial equilibrium and well within their tidal boundary shortly after formation, motivated by observations of young (few Myrs) clusters. We start with a discussion on how star clusters can be distinguished from (unbound) associations at these young ages.
1 Introduction
Ambartsumian (1947) introduced the term association in reference to loose agglomerates and he pointed out in subsequent studies that it is unlikely that they are bound by their own gravity (see also Blaauw, 1964). It is often stated that the majority of stars form in star clusters and that there is a high rate of early cluster disruption (e.g. Lada & Lada, 2003). In this view associations are clusters that have expanded. But if the star formation process is hierarchical then only a small fraction of the newborn stars reside in agglomerates that satisfy the conditions necessary to be bound by self-gravity at formation (e.g. Kravtsov & Gnedin, 2005; Elmegreen, 2008; Bressert et al., 2010). When observational samples of star clusters are used to support either one of the above scenarios it is vital to know how star clusters are separated from associations (Bastian et al., 2011). Here we provide a definition of the distinction between these two classes of stellar agglomerates (§ 2). In § 3 we present results of -body simulations of star clusters including the effect of stellar evolution.
2 The distinction between star clusters and associations
To illustrate our case we use the recent literature compilation of young massive clusters and associations of Portegies Zwart et al. (2010, hereafter PZMG10). This sample consists of stellar agglomerates for which a value of the half-light radius , mass , and age are available in literature. The sample contains 105 agglomerates with and in nearby (Mpc) galaxies, including the Milky Way. The ratio of the age over the crossing time, , can be used to separate star clusters from associations (PZMG10; Gieles & Portegies Zwart, 2011). Objects that are older than their crossing time () are most likely bound star clusters, whereas objects with are expected to be unbound associations. The crossing time is defined in terms of empirical cluster parameters
| (1) |
where is the gravitational constant. Equation (1) is valid for systems in virial equilibrium, because the formal definition includes the root-mean square velocity dispersion: and in virial equilibrium . However, values are available for fewer agglomerates and at young ages the empirically determined can be higher because of orbital motions of multiples (Gieles et al., 2010b). Surprisingly, the more convenient equation (1) fascilites in making the distinction between bound and unbound objects. Because super-virial associations expand with a (roughly) constant velocity, their crossing evolves as . Using equation (1) for super-virial objects, therefore, overestimates and underestimates , thereby pushing them more into the unbound regime.
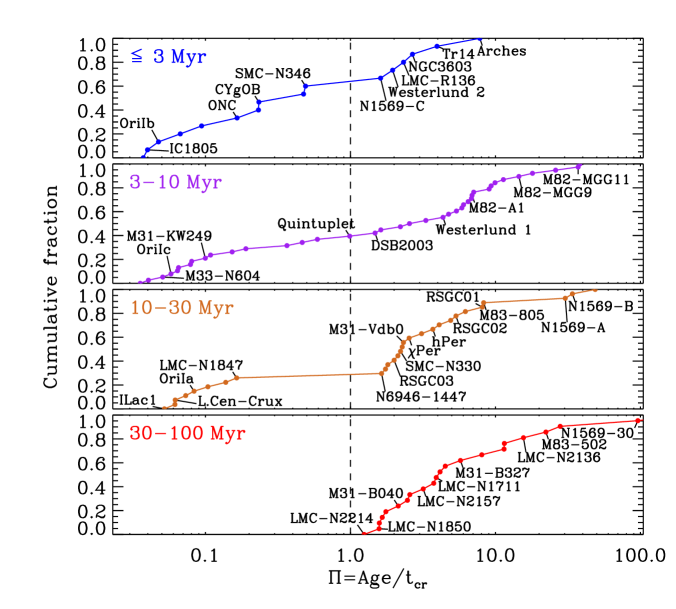
In Fig. 1 we show the cumulative distribution of values of all objects in different age bins. The top panel shows that the youngest age bin is a continuous distribution from associations with to star clusters with . There seems not to be a distinct mode of star cluster formation, but rather a smooth transition from star clusters to associations. Bressert et al. (2010) come to a similar conclusion based on the surface density distribution of young stellar objects in the solar neighbourhood
The bottom panel shows that the oldest agglomerates all have and these are, therefore, star clusters. The intermediate age curves contain both associations and star clusters. If we interpret the curves for the different age bins as an evolutionary sequence then a distinct gap develops between star clusters and associations around Myr at a value of . At older ages an observer should be able to make an unambiguous distinction between an (unbound) association and a (bound) star cluster using this straight-forward method.
For the youngest (continuous) distribution a useful first order separation can still be made at a value of , as can be noted from the labels of several well known star clusters and associations. Independent confirmation comes from recent determinations of velocity dispersions of (resolved) young () star clusters. For NGC 3603 (Rochau et al., 2010), Westerlund 1 (Mengel & Tacconi-Garman, 2007, and M. Cottaar in this volume) and R136 in 30 Doradus (Bosch et al., 2009, Hénault-Brunet in prep.) it was found that the dynamical mass estimates agree very well with the photometric masses, suggesting that these clusters are in virial equilibrium and stable (i.e. bound). This is also what their values suggest (see Fig. 1). In the next section we consider the dynamical evolution of such star clusters.
3 -body simulations of star clusters
We want to understand the evolution of a stellar cluster with a realistic stellar mass function in which the stars evolve and lose mass in time (Gieles et al., 2010a, hereafter G10). Because most young star clusters are very deeply embedded in their tidal limit (see e.g. Harayama et al. 2008 and Gennaro et al. 2011 for the cases of NGC 3603 and Westerlund 1, respectively) we ignore the effect of a tidal cut-off. The transition from expansion-dominated evolution to tidally limited evolution is considered in more detail elsewhere (Gieles et al., 2011).
We model clusters with initial half-mass relaxation timescales ranging from to by considering different combinations of at the start of the simulation. The stars follow a Kroupa (2001) initial mass function between and . We use the kira integrator and the stellar evolution package SeBa for solar metallicity (Portegies Zwart et al., 2001). The retention fraction of black holes and neutron stars was set to zero.
In Fig. 2 we show how increases with time as a function of . The asymptotic behaviour of these results can easily be understood by considering the extremes. Clusters that are dynamically young (low ) expand adiabatically in order to retain virial equilibrium after stellar mass loss. This adiabatic expansion is slow in time and gives a maximum increase of after a Hubble time. At the other extreme we have clusters that are dynamically old (high ) and they expand in a way that is comparable to what is found for equal-mass clusters in the sense that all clusters evolve towards the same .
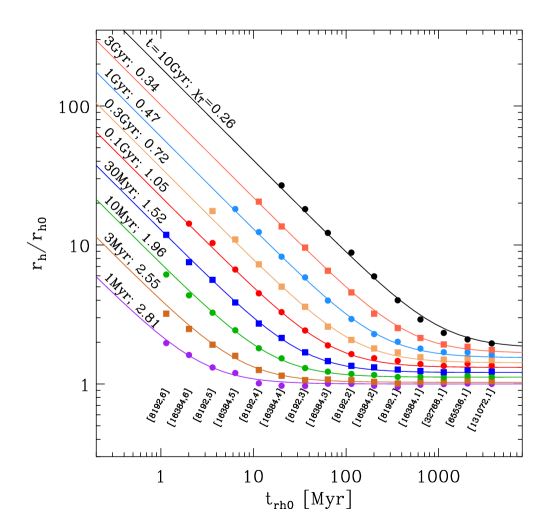
We conclude that the energy that is released to the core of the cluster as a result of stellar mass-loss acts as a central energy source that is in ‘balance’ with the energy that is driven outwards by 2-body relaxation, without the need of forming binaries in the core. One of the consequences of this interplay between stellar evolution and dynamical relaxation is that there is no sharp transition between a stellar evolution dominated phase and a relaxation dominated phase.
4 Comparing the theory to observations
With the expression for the evolution of the radius as a function of at hand (equation 6 in G10) we can easily calculate the evolution of any initial mass-radius relation. We first apply the results to the sample of young objects discussed in the previous section.
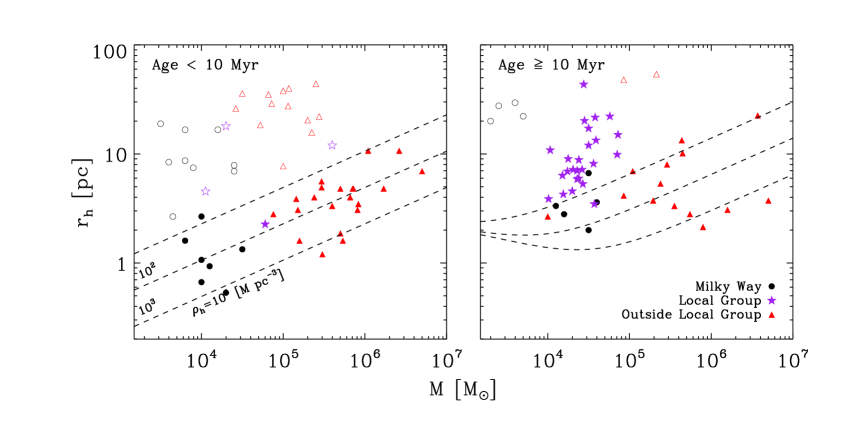
In Fig. 3 we show mass-radius diagrams for all objects for two age ranges: (left panel) and (right panel). The dashed lines in the left panel are lines of constant (arbitrary) . In the right panel we have evolved these lines to an age of 100 Myr. These lines are lower limits to the radius at the left-side of this diagram. There are indeed no compact () low-mass () clusters in this age bin.
Next we apply our result to the mass-radius relation of old stellar systems in the mass range . In Fig. 4 we show how a Faber-Jackson type initial mass-radius relation (Haşegan et al., 2005) evolves in time together with data points of (old) globular clusters and ultra-compact dwarfs (UCDs) in different galaxies that cover the mass regime we are interested in. For high the radius is set by , independent of , while for low we are seeing roughly the initial mass-radius relation. At an age of the break between the two regimes occurs at and at that age systems with this mass have . Mieske et al. (2008) noticed already that the break occurs at systems with roughly equal to a Hubble time. Here we give a quantitative explanation for it.
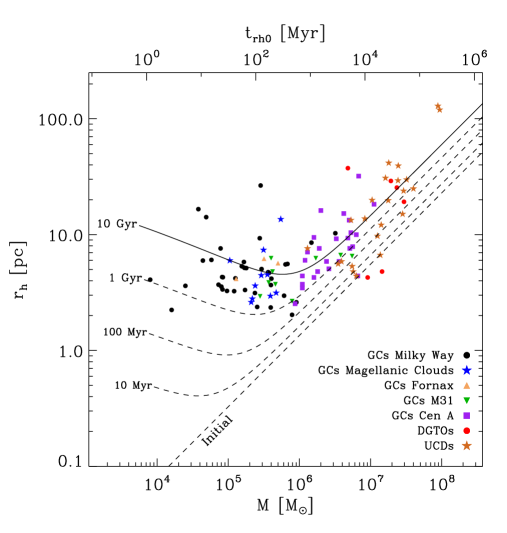
We conclude that the evolution of almost all (old) globular clusters is ‘balanced’, in the sense that the rate of central energy production equals the flow of energy due to 2-body relaxation111We deliberately avoid the term ‘post-collapse’ evolution because core-collapse is not required for the evolution to be ‘balanced’, see the discussion in Gieles et al. (2011). An important property of this ‘balanced’ evolution is that the half-mass radius is independent of its initial value and is a function of the number of stars and the age only. It is therefore not possible to infer the initial mass-radius relation of globular clusters, and we can only conclude that the present day properties are consistent with the hypothesis that all hot stellar systems formed with the same mass-radius relation and that globular clusters have moved away from this relation because of a Hubble time of stellar and dynamical evolution.
References
- Ambartsumian (1947) Ambartsumian, V. A. 1947, Stellar Evolution and Astrophysics (Armenian Acad. of Sci.); German translation, Abhandl. Sowjetischen Astron. Ser. 1, 33, (1951)
- Bastian et al. (2011) Bastian, N., Adamo, A., Gieles, M., et al. 2011, MNRAS, in press (ArXiv:1106.2427)
- Blaauw (1964) Blaauw, A. 1964, ARA&A, 2, 213
- Bosch et al. (2009) Bosch, G., Terlevich, E., & Terlevich, R. 2009, AJ, 137, 3437
- Bressert et al. (2010) Bressert, E., Bastian, N., Gutermuth, R., et al. 2010, MNRAS, 409, L54
- Elmegreen (2008) Elmegreen, B. G. 2008, ApJ, 672, 1006
- Gennaro et al. (2011) Gennaro, M., Brandner, W., Stolte, A., & Henning, T. 2011, MNRAS, 412, 2469
- Gieles et al. (2010a) Gieles, M., Baumgardt, H., Heggie, D. C., & Lamers, H. J. G. L. M. 2010a, MNRAS, 408, L16 (G10)
- Gieles et al. (2011) Gieles, M., Heggie, D. C., & Zhao, H. 2011, MNRAS, 413, 2509
- Gieles & Portegies Zwart (2011) Gieles, M. & Portegies Zwart, S. F. 2011, MNRAS, 410, L6
- Gieles et al. (2010b) Gieles, M., Sana, H., & Portegies Zwart, S. F. 2010b, MNRAS, 402, 1750
- Haşegan et al. (2005) Haşegan, M., Jordán, A., Côté, P., et al. 2005, ApJ, 627, 203
- Harayama et al. (2008) Harayama, Y., Eisenhauer, F., & Martins, F. 2008, ApJ, 675, 1319
- Kravtsov & Gnedin (2005) Kravtsov, A. V. & Gnedin, O. Y. 2005, ApJ, 623, 650
- Lada & Lada (2003) Lada, C. J. & Lada, E. A. 2003, ARA&A, 41, 57
- Mengel & Tacconi-Garman (2007) Mengel, S. & Tacconi-Garman, L. E. 2007, A&A, 466, 151
- Mieske et al. (2008) Mieske, S., Hilker, M., Jordán, A., et al. 2008, A&A, 487, 921
- Portegies Zwart et al. (2001) Portegies Zwart, S., McMillan, S. L. W., Hut, P., & Makino, J. 2001, MNRAS, 321, 199
- Portegies Zwart et al. (2010) Portegies Zwart, S. F., McMillan, S. L. W., & Gieles, M. 2010, ARA&A, 48, 431 (PZGM10)
- Rochau et al. (2010) Rochau, B., Brandner, W., Stolte, A., et al. 2010, ApJ, 716, L90