The deep XMM-Newton Survey of M 31 ††thanks: Based on observations obtained with XMM-Newton, an ESA science mission with instruments and contributions directly funded by ESA Member States and NASA.,††thanks: Tables 5 and 8 are only available in electronic form at the CDS via anonymous ftp to cdsarc.u-strasbg.fr (130.79.128.5) or via http://cdsweb.u-strasbg.fr/cgi-bin/qcat?J/A+A/
?abstractname?
Aims. The largest Local Group spiral galaxy, M~31, has been completely imaged for the first time obtaining a luminosity lower limit erg s-1 in the 0.2–4.5 keV band. Our XMM-Newton EPIC survey combines archival observations along the major axis, from June 2000 to July 2004, with observations taken between June 2006 and February 2008 that cover the remainder of the ellipse. The main goal of the paper is a study of the X-ray source population of M~31.
Methods. An X-ray catalogue of 1 897 sources was created; 914 were detected for the first time. Source classification and identification were based on X-ray hardness ratios, spatial extent of the sources, and by cross correlating with catalogues in the X-ray, optical, infrared and radio wavelengths. We also analysed the long-term variability of the X-ray sources; this variability allows us to distinguish between X-ray binaries and active galactic nuclei (AGN). Furthermore, supernova remnant classifications of previous studies that did not use long-term variability as a classification criterion, could be validated. Inclusion of previous Chandra and ROSAT observations in the long-term variability study allowed us to detect additional transient or at least highly variable sources, which are good candidate X-ray binaries.
Results. Fourteen of the 30 supersoft source (SSS) candidates represent supersoft emission of optical novae. Many of the 25 supernova remnants (SNRs) and 31 SNR candidates lie within the 10 kpc dust ring and other star forming regions in M~31; this connection between SNRs and star forming regions implies that most of the remnants originate in type II supernovae. The brightest sources in X-rays in M~31 belong to the class of X-ray binaries (XRBs). Ten low mass XRBs (LMXBs) and 26 LMXB candidates were identified based on their temporal variability. In addition 36 LMXBs and 17 LMXB candidates were identified due to correlations with globular clusters and globular cluster candidates. From optical and X-ray colour-colour diagrams, possible high mass XRB (HMXB) candidates were selected. Two of these candidates have an X-ray spectrum as is expected for an HMXB containing a neutron star primary.
Conclusions. While our survey has greatly improved our understanding of the X-ray source populations in M~31, at this point 65% of the sources can still only be classified as “hard” sources, i. e. it is not possible to decide whether these sources are X-ray binaries or Crab-like supernova remnants in M~31, or X-ray sources in the background. Deeper observations in X-ray and at other wavelengths would help classify these sources.
Key Words.:
Galaxies: individual: M~31 – X-rays: galaxies1 Introduction
Our nearest neighbouring large spiral galaxy, the Andromeda galaxy, also known as M~31 or NGC~224, is an ideal target for an X-ray source population study of a galaxy similar to the Milky Way. Its proximity (distance 780 kpc, Holland 1998; Stanek & Garnavich 1998) and the moderate Galactic foreground absorption (= 7 cm-2, Stark et al. 1992) allow a detailed study of source populations and individual sources.
After early detections of M~31 with X-ray detectors mounted on rockets (e. g. Bowyer et al. 1974) and the Uhuru satellite (Giacconi et al. 1974), the imaging X-ray optics flown on the Einstein X-ray observatory permitted the resolution of individual X-ray sources in M~31 for the first time. In the entire set of Einstein imaging observations of M~31, Trinchieri & Fabbiano (1991, hereafter TF91) found 108 individual X-ray sources brighter than erg s-1, of which 16 sources showed variability (van Speybroeck et al. 1979; Collura et al. 1990).
In July 1990, the bulge region of M~31 was observed with the ROSAT High Resolution Imager (HRI) for ks. Primini et al. (1993, hereafter PFJ93) reported 86 sources brighter than erg s-1 in this observation. Of the ROSAT HRI sources located within 75 of the nucleus, 18 sources were found to vary when compared to previous Einstein observations and about three of the sources may be “transients”. Two deep PSPC (Position Sensitive Proportional Counter) surveys of M~31 were performed with ROSAT, the first in July 1991 (Supper et al. 1997, hereafter SHP97), the second in July/August 1992 (Supper et al. 2001, hereafter SHL2001). In total 560 X-ray sources were detected in the field of M~31; of these, 491 sources were not detected in previous Einstein observations. In addition, a comparison with the results of the Einstein survey revealed long term variability in 18 sources, including 7 possible transients. Comparing the two ROSAT surveys, 34 long term variable sources and 8 transient candidates were detected. The derived luminosities of the detected M~31 sources ranged from 5 erg s-1 to 5 erg s-1. Another important result obtained with ROSAT was the establishment of supersoft sources (SSSs) as a new class of M~31 X-ray sources (cf. Kahabka 1999) and the identification of the first SSS with an optical nova in M~31 (Nedialkov et al. 2002).
Garcia et al. (2000) reported on first observations of the nuclear region of M~31 with Chandra. They found that the nuclear source has an unusual X-ray spectrum compared to the other point sources in M~31. Kong et al. (2002b) report on eight Chandra ACIS-I observations taken between 1999 and 2001, which cover the central region of M~31. They detected 204 sources, of which 50% are variable on timescales of months and 13 sources were classified as transients. Kaaret (2002) detected 142 point sources ( to 2 erg s-1 in the 0.1–10 keV band) in a 47 ks Chandra/HRC observation of the central region of M~31. A comparison with a ROSAT observation taken 11 yr earlier, showed that 4626% of the sources with erg s-1 are variable. Three different M~31 disc fields, consisting of different stellar population mixtures, were observed by Chandra. Di Stefano et al. (2002) investigated bright X-ray binaries (XRBs) in these fields, while Di Stefano et al. (2004) examined the populations of supersoft sources (SSSs) and quasisoft sources (QSSs), including observations of the central field. Using Chandra HRC observations, Williams et al. (2004) measured the mean fluxes and long-term time variability of 166 sources detected in these data. Voss & Gilfanov (2007) used Chandra data to examine the low mass X-ray binaries (LMXBs) in the bulge of M~31. Good candidates for LMXBs are the so-called transient sources. Studies of transient sources in M~31 are presented in numerous papers, e. g. Williams et al. (2006b), Trudolyubov et al. (2006, hereafter TPC06), Williams et al. (2005b), Williams et al. (2006a, hereafter WGM06), and Voss et al. (2008).
Using XMM-Newton and Chandra data, Trudolyubov & Priedhorsky (2004) detected 43 X-ray sources coincident with globular cluster candidates from various optical surveys. They studied their spectral properties, time variability and log N-log S relations.
Osborne et al. (2001) used XMM-Newton Performance Verification observations to study the variability of X-ray sources in the central region of M~31. They found 116 sources brighter than a limiting luminosity of 6 erg s-1 and examined the brightest sources for periodic and non-periodic variability. At least 15% of these sources appear to be variable on a time scale of several months. Barnard et al. (2003) used XMM-Newton to study the X-ray binary RX J0042.6+4115 and suggested it as a Z-source. Orio (2006) studied the population of SSSs and QSSs with XMM-Newton. Recently, Trudolyubov & Priedhorsky (2008) reported the discovery of 217s pulsations in the bright persistent SSS XMMU J004252.5+411540. Shaw Greening et al. (2009, hereafter SBK2009) presented the results of a complete spectral survey of the 335 X-ray point sources they detected in five XMM-Newton observations located along the major axis of M~31. They obtained background subtracted spectra and lightcurves for each of the 335 X-ray sources. Sources with more than 50 source counts were individually spectrally fitted. In addition, they selected 18 HMXB candidates, based on a power law photon index of .
Pietsch et al. (2005b, hereafter PFH2005) prepared a catalogue of M~31 point-like X-ray sources analysing all observations available at that time in the XMM-Newton archive which overlap at least in part with the optical extent of the galaxy. In total, they detected 856 sources. The central part of the galaxy was covered four times with a separation of the observations of about half a year starting in June 2000. PFH2005 only gave source properties derived from an analysis of the combined observations of the central region. Source identification and classification were based on hardness ratios, and correlations with sources in other wavelength regimes. In follow-up work, (i) Pietsch & Haberl (2005) searched for X-ray burst sources in globular cluster (GlC) sources and candidates and identified two X-ray bursters and a few more candidates, while (ii) Pietsch et al. (2005a, hereafter PFF2005) searched for correlations with optical novae. They identified 7 SSSs and 1 symbiotic star from the catalogue of PFH2005 with optical novae, and identified anadditional XMM-Newton source with an optical nova. This work was continued and extended on archival Chandra HRC-I and ACIS-I observations by Pietsch et al. (2007, hereafter PHS2007).
Stiele et al. (2008, hereafter SPH2008) presented a time variability analysis of all of the M~31 central sources. They detected 39 sources not reported at all in PFH2005. 21 sources were detected in the July 2004 monitoring observations of the low mass X-ray binary RX J0042.6+4115 (PI Barnard), which became available in the meantime. Six sources, which were classified as “hard” sources by PFH2005, show distinct time variability and hence are classified as XRB candidates in SPH2008. The SNR classifications of three other sources from PFH2005 had to be rejected due to the distinct time variability found by SPH2008. Henze et al. (2009a) reported on the first two SSSs ever discovered in the M~31 globular cluster system, and Henze et al. (2009b) discussed the very short supersoft X-ray state of the classical nova M31N 2007-11a. A comparative study of supersoft sources detected with ROSAT, Chandra and XMM-Newton, examining their long-term variability, was presented by Stiele et al. (2010).
An investigation of the log N-log S relation of sources detected in the 2.0–10.0 keV range will be presented in a forthcoming paper (Stiele et al. 2011 in prep.). In this work the contribution of background objects and the spatial dependence of the log N-log S relations for sources of M~31 is studied.
In this paper we report on the large XMM-Newton survey of M~31, which covers the entire ellipse of M~31, for the first time, down to a limiting luminosity of erg s-1 in the 0.2–4.5 keV band. In Sect. 2 information about the observations used is provided. The analysis of the data is presented in Sect. 3. Section 4 presents the combined colour image of all observations used. The source catalogue of the deep XMM-Newton survey of M~31 is described in Sect. 5. The results of the temporal variability analysis are discussed in Sect. 6. Cross-correlations with other M~31 X-ray catalogues are discussed in Sect. 7, while Sect. 8 discusses cross-correlations with catalogues at other wavelengths. Our results related to foreground stars and background sources in the field of M~31 are presented in Sect. 9. Individual source classes belonging to M31 are discussed in Sect. 10. We draw our conclusions in Sect. 11.
| Paper | S+ | #ofSrc∗ | L | field | comments |
|---|---|---|---|---|---|
| erg cm-2 s-1 | |||||
| Trinchieri & Fabbiano (1991, TF91) | E | 108 | – | entire set of Einstein | 16 sources showed variability |
| (0.2–4 keV) | imaging observations | ||||
| Primini et al. (1993, PFJ93) | R (HRI) | 86 | bulge region | 18 sources variable; 3 transients | |
| (0.2–4 keV) | |||||
| Supper et al. (1997, 2001) | R (PSPC) | 560 | – | whole galaxy | two deep surveys |
| (SPH97, SHL2001) | (0.1–2.4 keV) | 491 sources not detected with Einstein | |||
| 11 sources variable, 7 transients compared to Einstein | |||||
| 34 sources variable, 8 transients between ROSAT surveys | |||||
| Osborne et al. (2001) | X | 116 | centre | examined the brightest sources for variability | |
| (0.3–12 keV) | |||||
| Kong et al. (2002b) | C (ACIS-I) | 204 | central | observations between 1999 and 2001 | |
| (0.3–7 keV) | 50% of the sources are variable, 13 transients | ||||
| Kaaret (2002) | C (HRC) | 142 | – | centre | one 47 ks observation; 4626% of the sources |
| (0.1–10 keV) | with erg s-1 are variable | ||||
| Di Stefano et al. (2002) | C (ACIS-I/S) | 28 | – | 3 disc fields | bright X-ray binaries |
| (0.3–7 keV) | |||||
| Di Stefano et al. (2004) | C (ACIS-S S3) | 33 | 3 disc fields + centre | supersoft sources and quasisoft sources | |
| Williams et al. (2004) | C (HRC) | 166 | – | major axis + centre | 25% showed significant variability |
| (0.1–10 keV) | |||||
| Trudolyubov & Priedhorsky (2004) | C, X | 43 | – | major axis + centre | globular cluster study |
| (0.3–10 keV) | |||||
| Pietsch et al. (2005b, PFH2005) | X | 856 | – | major axis + centre | source catalogue |
| (0.2–4.5 keV) | |||||
| Pietsch et al. (2005a, PFF2005) | C, R, X | 21 | – | centre | correlations with optical novae |
| (0.2–1 keV) | |||||
| Orio (2006) | C, X | 42 | – | major axis + centre | supersoft sources and quasisoft sources |
| (0.2–2 keV) | |||||
| (0.3–10 keV) | |||||
| Pietsch et al. (2007, PHS2007) | C, X | 46 | – | centre | correlations with optical novae |
| (0.2–1 keV) | |||||
| Voss & Gilfanov (2007) | C | 263 | – | bulge region | low mass X-ray binary study |
| (0.5–8 keV) | |||||
| Stiele et al. (2008, SPH2008) | X | 39 | – | centre | re-analysis of archival and new 2004 observations |
| 300 | – | time variability analysis; 149 sources with a significance | |||
| (0.2–4.5 keV) | for variability 3; 6 new X-ray binary candidates, | ||||
| 3 supernova remnant classifications were rejected | |||||
| Shaw Greening et al. (2009, SBK2009) | X | 335 | – | 5 fields along | background subtracted spectra and lightcurves for |
| (0.3–10 keV) | major axis | each source; 18 HMXB candidates, selected from their | |||
| power law photon index | |||||
| Stiele et al. (2010) | X | 40 | whole galaxy | supersoft sources; comparing ROSAT, Chandra and | |
| XMM-Newton catalogues |
Notes:
: X-ray satellite(s) on which the study is based: E for Einstein, R for ROSAT, C for Chandra, and X for XMM-Newton (EPIC)
: Number of sources
: observed luminosity range in the indicated energy band, assuming a distance of 780 kpc to M~31
2 Observations
Figure 1 shows the layout of the individual XMM-Newton observations over the field of M~31. The observations of the “Deep XMM-Newton Survey of M~31” (PI Pietsch) mainly point at the outer parts of M~31, while the area along the major axis is covered by archival XMM-Newton observations (PIs Watson, Mason, Di Stefano). To treat all data in the same way, we re-analysed all archival XMM-Newton observations of M~31, which were used in Pietsch et al. (2005b). In addition we included an XMM-Newton target of opportunity (ToO) observation of source CXOM31 J004059.2+411551 and the four observations of source RX J0042.6+4115 (PI Barnard).
All observations of the “Deep XMM-Newton Survey of M~31” and the ToO observation were taken between June 2006 and February 2008. All other observations were available via the XMM-Newton Data Archive111http://xmm.esac.esa.int/xsa/ and were taken between June 2000 and July 2004.
The journal of observations is given in Table 2. It includes the M~31 field name (Column 1), the identification number (2) and date (3) of the observation and the pointing direction (4, 5), while col. 6 contains the systematic offset (see Sect. 3.4). For each EPIC camera the filter used and the exposure time after screening for high background is given (see Sect. 3.1).

| M 31 field | Obs. id. | Obs. dates | Pointing direction | Offset ∗ | EPIC PN | EPIC MOS1 | EPIC MOS2 | |||||
|---|---|---|---|---|---|---|---|---|---|---|---|---|
| RA/Dec (J2000) | Filter+ | Filter+ | Filter+ | |||||||||
| (1) | (2) | (3) | (4) | (5) | (6) | (7) | (8) | (9) | (10) | (11) | (12) | |
| Centre 1 | (c1) | 0112570401 | 2000-06-25 | 0:42:36.2 | 41:16:58 | medium | 23.48(23.48) | medium | 29.64(29.64) | medium | 29.64(29.64) | |
| Centre 2 | (c2) | 0112570601 | 2000-12-28 | 0:42:49.8 | 41:14:37 | medium | 5.82( 5.82) | medium | 6.42( 6.42) | medium | 6.42( 6.42) | |
| Centre 3 | (c3) | 0109270101 | 2001-06-29 | 0:42:36.3 | 41:16:54 | medium | 21.71(21.71) | medium | 23.85(23.85) | medium | 23.86(23.86) | |
| N1 | (n1) | 0109270701 | 2002-01-05 | 0:44:08.2 | 41:34:56 | medium | 48.31(48.31) | medium | 55.68(55.68) | medium | 55.67(55.67) | |
| Centre 4 | (c4) | 0112570101 | 2002-01-06/07 | 0:42:50.4 | 41:14:46 | thin | 47.85(47.85) | thin | 52.87(52.87) | thin | 52.86(52.86) | |
| S1 | (s1) | 0112570201 | 2002-01-12/13 | 0:41:32.7 | 40:54:38 | thin | 46.75(46.75) | thin | 51.83(51.83) | thin | 51.84(51.84) | |
| S2 | (s2) | 0112570301 | 2002-01-24/25 | 0:40:06.0 | 40:35:24 | thin | 22.23(22.23) | thin | 24.23(24.23) | thin | 24.24(24.24) | |
| N2 | (n2) | 0109270301 | 2002-01-26/27 | 0:45:20.0 | 41:56:09 | medium | 22.73(22.73) | medium | 25.22(25.22) | medium | 25.28(25.28) | |
| N3 | (n3) | 0109270401 | 2002-06-29/30 | 0:46:38.0 | 42:16:20 | medium | 39.34(39.34) | medium | 43.50(43.50) | medium | 43.63(43.63) | |
| H4 | (h4) | 0151580401 | 2003-02-06 | 0:46:07.0 | 41:20:58 | medium | 10.14(10.14) | medium | 12.76(12.76) | medium | 12.76(12.76) | |
| RX 1 | (b1)‡ | 0202230201 | 2004-07-16 | 0:42:38.6 | 41:16:04 | medium | 16.32(16.32) | medium | 19.21(19.21) | medium | 19.21(19.21) | |
| RX 2 | (b2) | 0202230301 | 2004-07-17 | 0:42:38.6 | 41:16:04 | medium | 0.0(0.0) | medium | 0.0(0.0) | medium | 0.0(0.0) | |
| RX 3 | (b3)‡ | 0202230401 | 2004-07-18 | 0:42:38.6 | 41:16:04 | medium | 12.30(12.30) | medium | 17.64(17.64) | medium | 17.68(17.68) | |
| RX 4 | (b4)‡ | 0202230501 | 2004-07-19 | 0:42:38.6 | 41:16:04 | medium | 7.94(7.94) | medium | 10.12(10.12) | medium | 10.13(10.13) | |
| S3 | (s3) | 0402560101 | 2006-06-28 | 0:38:52.8 | 40:15:00 | thin | 4.99(4.99) | medium | 6.96(6.96) | medium | 6.97(6.97) | |
| SS1 | (ss1) | 0402560201 | 2006-06-30 | 0:43:28.8 | 40:55:12 | thin | 14.07(9.57) | medium | 24.56(10.65) | medium | 24.58(10.66) | |
| SN1 | (sn1) | 0402560301 | 2006-07-01 | 0:40:43.2 | 41:17:60 | thin | 41.23(35.42) | medium | 47.60(39.40) | medium | 47.64(39.44) | |
| SS2 | (ss2) | 0402560401 | 2006-07-08 | 0:42:16.8 | 40:37:12 | thin | 21.64(9.92) | medium | 25.59(11.04) | medium | 25.64(11.05) | |
| SN2 | (sn2) | 0402560501 | 2006-07-20 | 0:39:40.8 | 40:58:48 | thin | 48.79(21.45) | medium | 56.13(23.85) | medium | 56.17(23.86) | |
| SN3 | (sn3) | 0402560701 | 2006-07-23 | 0:39:02.4 | 40:37:48 | thin | 23.80(15.43) | medium | 28.02(17.16) | medium | 28.04(17.17) | |
| SS3 | (ss3) | 0402560601 | 2006-07-28 | 0:40:45.6 | 40:21:00 | thin | 27.77(20.22) | medium | 31.92(22.49) | medium | 31.94(22.5) | |
| S2 | (s21) | 0402560801 | 2006-12-25 | 0:40:06.0 | 40:35:24 | thin | 39.12(39.12) | medium | 45.19(45.19) | medium | 45.21(45.21) | |
| NN1 | (nn1) | 0402560901 | 2006-12-26 | 0:41:52.8 | 41:36:36 | thin | 37.9(37.9) | medium | 43.08(43.08) | medium | 43.1(43.1) | |
| NS1 | (ns1) | 0402561001 | 2006-12-30 | 0:44:38.4 | 41:12:00 | thin | 45.11(45.11) | medium | 50.9(50.9) | medium | 50.93(50.93) | |
| NN2 | (nn2) | 0402561101 | 2007-01-01 | 0:43:09.6 | 41:55:12 | thin | 41.73(41.73) | medium | 46.45(46.45) | medium | 46.47(46.47) | |
| NS2 | (ns2) | 0402561201 | 2007-01-02 | 0:45:43.2 | 41:31:48 | thin | 34.96(34.96) | medium | 40.55(40.55) | medium | 40.58(40.58) | |
| NN3 | (nn3) | 0402561301 | 2007-01-03 | 0:44:45.6 | 42:09:36 | thin | 31.04(31.04) | medium | 34.81(34.81) | medium | 34.81(34.81) | |
| NS3 | (ns3) | 0402561401 | 2007-01-04 | 0:46:38.4 | 41:53:60 | thin | 39.41(39.41) | medium | 45.50(45.50) | medium | 45.52(45.52) | |
| N2 | (n21) | 0402561501 | 2007-01-05 | 0:45:20.0 | 41:56:09 | thin | 37.18(37.18) | medium | 41.98(41.98) | medium | 42.03(42.03) | |
| SS1 | (ss11) | 0505760201 | 2007-07-22 | 0:43:28.8 | 40:55:12 | thin | 30.07(23.90) | medium | 34.01(26.70) | medium | 34.02(26.72) | |
| S3 | (s31) | 0505760101 | 2007-07-24 | 0:38:52.8 | 40:15:00 | thin | 21.86(15.74) | medium | 24.74(17.65) | medium | 24.74(17.65) | |
| CXOM31 | (sn11)⋄ | 0410582001 | 2007-07-25 | 0:40:59.2 | 41:15:51 | thin | 11.27(11.27) | medium | 14.01(14.01) | medium | 14.02(14.02) | |
| SS3 | (ss31) | 0505760401 | 2007-12-25 | 0:40:45.6 | 40:21:00 | thin | 23.56(22.82) | medium | 28.18(25.8) | medium | 28.2(25.82) | |
| SS2 | (ss21) | 0505760301 | 2007-12-28 | 0:42:16.8 | 40:37:12 | thin | 35.28(35.28) | medium | 40.00(40.00) | medium | 40.01(40.01) | |
| SN3 | (sn31) | 0505760501 | 2007-12-31 | 0:39:02.4 | 40:37:48 | thin | 24.26(24.26) | medium | 28.77(28.77) | medium | 28.78(28.78) | |
| S3 | (s32) | 0511380101 | 2008-01-02 | 0:38:52.8 | 40:15:00 | thin | 38.31(38.31) | medium | 44.92(44.92) | medium | 44.95(44.95) | |
| SS1 | (ss12) | 0511380201 | 2008-01-05 | 0:43:28.8 | 40:55:12 | thin | 8.85( 8.85) | medium | 11.28(11.28) | medium | 11.29(11.29) | |
| SN2 | (sn21) | 0511380301 | 2008-01-06 | 0:39:40.8 | 40:58:48 | thin | 24.79(24.79) | medium | 29.28(29.28) | medium | 29.29(29.29) | |
| SS1 | (ss13) | 0511380601 | 2008-02-09 | 0:43:28.8 | 40:55:12 | thin | 13.35(13.35) | medium | 15.07(15.07) | medium | 15.08(15.08) | |
Notes:
: Systematic offset in RA and Dec in arcsec determined from correlations with 2MASS, USNO-B1, LGGS and Chandra catalogues
: All observations in full frame imaging mode
: Exposure time in units of ks after screening for high
background used for detection, for colour image in brackets
: Combination of the three observations is called b (see text), RX denotes RX J0042.6+4115
: CXOM31 denotes CXOM31 J004059.2+411
3 Data analysis
In this section, the basic concepts of the X-ray data reduction and source detection processes are described.
3.1 Screening for high background
The first step was to exclude times of increased background, due to soft proton flares. Most of these times are located at the start or end of an orbit window. We selected good time intervals (GTIs) – intervals where the intensity was lower than a certain threshold – using 7–15 keV light curves constructed from source-free regions of each observation. The GTIs with PN and MOS data were determined from the higher statistic PN light curves. Outside the PN time coverage, GTIs were determined from the combined MOS light curves. For each observation, the limiting thresholds for the count rate were adjusted individually; this way we avoided cutting out short periods (up to a few hundred seconds) of marginally increased background. Short periods of low background, which were embedded within longer periods of high background, were omitted. For most observations, the PN count rate thresholds were 2–8 cts ks-1 arcmin-2.
As many of the observations were affected by strong background flares, the net exposure which can be used for our analysis was strongly reduced. The GTIs of the various observations ranged over 6–56 ks, apart from observation b2 (ObsID 0202230301) which had to be rejected, because it showed high background throughout the observation. The exposures for all three EPIC instruments are given in Cols. 8, 10 and 12 of Table 2. The observations obtained during the summer visibility window of M~31 were affected more strongly by background radiation than those taken during the winter window. The most affected observations of the deep survey were reobserved.
After screening for times of enhanced particle background, the second step was to examine the influence of solar wind charge exchange. This was done by producing soft energy ( keV) background light curves. These lightcurves varied only for 10 observations, for which additional screening was necessary. The screening of enhanced background due to solar wind charge exchange was applied to the observations only for the creation of colour images, in order to avoid that these observations will appear in the mosaic image with a tinge of red. The screening was not used for source detection.
The third and last step includes the study of the background due to detector noise. The processing chains take into account all known bad or hot pixels and columns and flag the affected pixels in the event lists. We selected data with (FLAG & 0xfa0000)=0, excluded rows and columns near edges, and searched by eye for additional warm or hot pixels and columns in each observation. To avoid background variability over the PN images, we omitted the energy range from 7.2–9.2 keV where strong fluorescence lines cause higher background in the outer detector area (Freyberg et al. 2004).
An additional background component can occur during the EPIC PN offset map calculation. If this period is affected by high particle background, the offset calculation will lead to a slight underestimate of the offset in some pixels which can then result in blocks of pixels () with enhanced low energy signal.222See also http://xmm2.esac.esa.int/docs/documents/CAL-TN-0050-1-0.ps.gz These blocks will be found by the SAS detection tools and appear as sources with extremely soft spectrum (so called supersoft sources). To reduce the number of false detections in this source class, we decided to include the task epreject in epchain, which locates the pixels with a slight underestimate of the offset and corrects this underestimate. To ensure that epreject produces reliable results, difference images of the event lists obtained with and without epreject, were created. Only events with energies above 200 eV were used. We checked whether epreject removed all pixels with an enhanced low energy signal. Only in observation ns1 the difference image still shows a block of pixels with enhanced signal. As this block is also visible at higher energies (PHA) it cannot be corrected with epreject. Additionally, we ascertained that almost all pixels not affected during the offset map calculation have a value consistent with zero in the difference images, with two exceptions discussed in Sect. 5.
3.2 Images
For each observation, the data were split into five energy bands: (0.2–0.5) keV, (0.5–1.0) keV, (1.0–2.0) keV, (2.0–4.5) keV, and (4.5–12) keV. For the PN data, we used only single-pixel events (PATTERN 0) in the first energy band, while for the other bands, single-pixel and double-pixel events were selected (PATTERN 4). In the MOS cameras, single-pixel to quadruple-pixel events (PATTERN 12) were used. We created images, background images and exposure maps (with and without vignetting correction) for PN, MOS 1 and MOS 2 in each of the five energy bands and masked them for the acceptable detector area. The image bin size is 2′′. The same procedure was applied in our previous M~31 and M 33 studies (PFH2005 and Pietsch et al. 2004).
To create background images, the SAS task eboxdetect was run in local mode, in which it determines the background from the surrounding pixels of a sliding box, with box sizes of , and pixels (10′′10′′, 20′′20′′and 40′′40′′). The detection threshold is set to likemin = 15, which is a good compromise between cutting out most of the sources and leaving sufficient area to derive the appropriate background. For the background calculation, a two dimensional spline is fitted to a rebinned and exposure corrected image (task esplinemap). The number of bins used for rebinning is controlled by the parameter nsplinenodes, which is set to 16 for all but the observations of the central region, where it was set to 20 (maximum value). For PN, the background maps contain the contribution from the “out of time (OoT)” events.
3.3 Source detection
For each observation, source detection was performed simultaneously on 5 energy bands for each EPIC camera, using the XMM-SAS detection tasks eboxdetect and emldetect, as such fitting provides the most statistically robust measurements of the source positions by including all of the data. This method was also used to generate the 2XMM catalog (cf Watson et al. 2009). In the following we describe the detection procedure used.
The source detection procedure consists of two consecutive detection steps. An initial source list is created with the task eboxdetect (cf. Sect. 3.2). To select source candidates down to a low statistical significance level, a low likelihood threshold of four was used at this stage. The background was estimated from the previously created background images (see Sect. 3.2).
This list is the starting point for the XMM-SAS task emldetect (v. 4.60.1). The emldetect task performs a Maximum Likelihood fit of the distribution of source counts (based on Cash C-statistics approach; Cash 1979), using a point spread function model obtained from ray tracing calculations. If is the probability that a Poissonian fluctuation in the background is detected as a spurious source, the likelihood of the detection is then defined as .333This is a simplified description as emldetect transforms the derived likelihoods to equivalent likelihoods, corresponding to the case of two free parameters. This allows comparison between detection runs with different numbers of free parameters. The fit is performed simultaneously in all energy bands for all three cameras by summing the likelihood contribution of each band and each camera. Sources exceeding the detection likelihood threshold in the full band (combination of the 15 bands) are regarded as detections; the catalogue is thus full band selected.
The detection threshold used is 7, as in PFH2005. Some other parameters differ from the values used in PFH2005, as in this work a parameter setting optimised for the detection of extended sources was used (G. Lamer; private communication). The parameters in question are the event cut-out (ecut = 30.0) and the source selection radius (scut = 0.9) for multi-source fitting, the maximum number of sources into which one input source can be split (nmulsou = 2), and the maximum number of sources that can be fitted simultaneously (nmaxfit = 2). Multi-PSF fitting was performed in a two stage process for objects with a detection likelihood larger than ten. All of the sources were also fitted with a convolution of a -model cluster brightness profile (Cavaliere & Fusco-Femiano 1976) with the XMM-Newton point spread function, in order to detect any possible extension in the detected signal. Sources which have a core radius significantly larger than the PSF are flagged as extended. The free parameters of the fit were the source location, the source extent and the source counts in each energy band of each telescope.
To derive the X-ray flux of a source from its measured count rate, one uses the so-called energy conversion factors (ECF):
| (1) |
These factors were calculated using the detector response, and depended on the used filter, the energy band in question, and the spectrum of the source. As we wanted to apply the conversion factors to all sources found in the survey, we assumed a power law model with photon index and the Galactic foreground absorption of cm-2 (Stark et al. 1992, see also PFH2005) to be the universal source spectrum for the ECF calculation.
The ECFs (see Table 3) were derived with XSPEC444http://heasarc.gsfc.gov/docs/xanadu/xspec(v 11.3.2) using response matrices (V.7.1) available from the XMM-Newton calibration homepage555http://xmm2.esac.esa.int/external/xmm_sw_cal/calib/epic_files.shtml. As all necessary corrections of the source parameters (e. g. vignetting corrections) were included in the image creation and source detection procedure666especially in the emldetect task, the on axis ECF values were derived (cf. Watson et al. 2009). The fluxes determined with the ECFs given in Table 3 are absorbed (i. e. observed) fluxes and hence correspond to the observed count rates, which are derived in the emldetect task.
During the mission lifetime, the MOS energy distribution behaviour has changed. Near the nominal boresight positions, where most of the detected photons hit the detectors, there has been a decrease in the low energy response of the MOS cameras (Read et al. 2006). To take this effect into account, different response matrices for observations obtained before and after the year 2005 were used (see Table 3).
| Detector | Filter | B1 | B2 | B3 | B4 | B5 |
|---|---|---|---|---|---|---|
| EPIC PN | thin | |||||
| medium | ||||||
| EPIC MOS 1 | thin | |||||
| medium | ||||||
| EPIC MOS 2 | thin | |||||
| medium | ||||||
| EPIC MOS 1 | thin | |||||
| OLD | medium | |||||
| EPIC MOS 2 | thin | |||||
| OLD | medium | |||||
For most sources, band 5 just adds noise to the total count rate. If converted to flux, this noise often dominates the total flux due to the small ECF. To avoid this problem we calculated count rates and fluxes for detected sources in the “XID” (0.2–4.5) keV band (bands 1 to 4 combined). While for most sources this is a good solution, for extremely hard or soft sources there may still be bands just adding noise. This, then, may lead to rate and flux errors that seem to falsely indicate a lower source significance. A similar effect occurs in the combined rates and fluxes, if a source is detected primarily by one instrument (e. g. soft sources in PN).
Sources are entered in the XMM LP-total catalogue from the observation in which the highest source detection likelihood is obtained (either combined or single observations). For variable sources this means that the source properties given in the XMM LP-total catalogue (see Sect. 5 and Table 5) are those observed during their brightest state.
We rejected spurious detections in the vicinity of bright sources. In regions with a highly structured background, the SAS detection task emldetect registered some extended sources. We also rejected these “sources” as spurious detections. In an additional step we checked whether an object had visible contours in at least one image out of the five energy bands. The point-like or extended nature, which was determined with emldetect, was taken into account. In this way, “sources” that are fluctuations in the background, but which were not fully modelled in the background images, were detected. In addition, objects located on hot pixels, or bright pixels at the rim or in the corners of the individual CCD chips (which were missed during the background screening) were recognised and excluded from the source catalogue, especially if they were detected with a likelihood larger than six in one detector only.
To allow for a statistical analysis, the source catalogue only contains sources detected by the SAS tasks eboxdetect and emldetect as described above, i. e. the few sources that were not detected by the analysis program, despite being visible on the X-ray images, have not been added by hand as it was done in previous studies (SPH2008; PFH2005).
To classify the source spectra, we computed four hardness ratios. The hardness ratios and errors are defined as:
| (2) |
for i = 1 to 4, where and denote count rates and corresponding errors in energy band i.
3.4 Astrometrical corrections
To obtain astrometrically-corrected positions for the sources of the five central fields we used the SAS-task eposcorr with Chandra source lists (Kong et al. 2002b; Kaaret 2002; Williams et al. 2004). For the other fields we selected sources from the USNO-B1 (Monet et al. 2003), 2MASS (Skrutskie et al. 2006) and Local Group Galaxy Survey (LGGS; Massey et al. 2006) catalogues777For the remainder of the subsection we will call all three catalogues “optical catalogues” for easier readability, although the 2MASS catalogue is an infrared catalogue..
3.4.1 Astrometry of optical/infrared catalogues
In a first step, we examined the agreement between the positions given by the various optical catalogues.888From the LGGS catalogue only sources brighter than 21 mag were used in order to be comparable to the brightness limit of the USNO-B1 catalogue. A close examination of the shifts obtained, showed significant differences between the positions given in the individual catalogues. In summary, between the USNO-B1 and LGGS catalogues we found an offset of: 0197 in R.A. and 0067 in Dec999the offset in declination is negligible; and between the USNO-B1 and 2MASS catalogues we found an offset of: 0108 in R.A. and 0204 in Dec. We chose the USNO-B1 catalogue as a reference, since it covers the entire field observed in the Deep XMM-Newton survey, and in addition it provides values for the proper motion of the optical sources.
Since the optical catalogues, as well as the Deep XMM-Newton catalogue, are composed of individual observations of sub-fields of M~31, we searched for systematic drifts in the positional zero points from region to region. However no systematic offsets were found.
Finally, we applied the corrections found to the sources in the LGGS and 2MASS catalogues, to bring all catalogues to the USNO-B1 reference frame.
The offsets found between the USNO-B1 and 2MASS catalogues can be explained by the independent determination of the astrometric solutions for these catalogues. Given that the positions provided in the LGGS catalogue are corrected with respect to the USNO-B1 catalogue (see Massey et al. 2006), the offset found in right ascension was totally unexpected and cannot be explained.
3.4.2 Corrections of the X-ray observations
From the positionally corrected catalogues, we selected sources which either correlate with globular clusters from the Revised Bologna Catalogue (V.3.4, January 2008; Galleti et al. 2004, 2005, 2006, 2007) or with foreground stars, characterised by their optical to X-ray flux ratio (Maccacaro et al. 1988) and their hardness ratio (see source selection criteria given in Table 6 and Stiele et al. 2008). For sources selected from the USNO-B1 catalogue, we used the proper motion corrected positions. We then used the SAS-task eposcorr to derive the offset of the X-ray aspect solution. Four observations did not have enough optical counterparts to apply this method. The lack of counterparts is due to the very short exposure times resulting after the screening for high background (obs. s3, ss12, ss13) and the location of the observation (obs. sn11). In these cases, we used bright persistent X-ray sources, which we correlated with another observation of the same field. We checked for any residual systematic uncertainty in the source positions and found it to be well characterised by a conservative value of 0 5. This uncertainty is due to positional errors of the optical sources as well as inaccuracy in the process of the determination of the offset between optical and X-ray sources, and is called systematic positional error. The appropriate offset, given in Col. 6 of Table 2, was applied to the event file of each pointing, and images and exposure maps were then reproduced with the corrected astrometry.
Fields that were observed at least twice are treated in a special way, which is described in the following section.
3.5 Multiple observations of selected fields
The fields that were observed more than once were the central field, the fields pointing on RX J0042.6+4115101010The combination of observations b1, b3 and b4 is called b., two fields located on the major axis of M~31 (S2, N2) and all fields of the “Large Survey” located in the southern part of the galaxy (SS1, SS2, SS3, S3, SN3, SN2, SN1). To reach higher detection sensitivity we merged the images, background images and exposure maps of observations which have the same pointing direction and were obtained with the same filter setting. Subsequently, source detection, as described in Sect. 3.3, was repeated on the merged data. For the S2 field, there are two observations with different filter settings. In this case, source detection was performed simultaneously on all 15 bands of both observations, i. e. on 30 bands simultaneously. The N2 field was treated in the same way. For the central field images, background images and exposure maps of observations c1, c2 and c3 were merged. These merged data were used together with the data of observation c4 to search for sources simultaneously; in this way it was possible to take into account the different ECFs for the different filters. One field was observed twice with slightly different pointing direction in observations sn1 and sn11; simultaneous source detection was used for these observations also.
3.6 Variability calculation
To examine the time variability of each source listed in the total source catalogue, we determined the XID flux at the source position in each observation or at least an upper limit for the XID flux. We used the task emldetect with fixed source positions when calculating the total flux. To get fluxes and upper limits for all sources in the input list we set the detection likelihood threshold to 0.
A starting list was created from the full source catalogue, which only contains the identification number and position of each source located in the field examined. To give correct results, the task emldetect has to process the sources from the brightest one to the faintest one. We, therefore, had to first order the sources in each observation by the detection likelihood. For sources not visible in the observation in question we set the detection likelihood to 0. This list was used as input for a first emldetect run. In this way we achieved an output list in which a detection likelihood was allocated to every source. For a final examination of the sources in order of detection likelihood, a second emldetect run was necessary.
We only accepted XID fluxes for detections 3 ; otherwise we used a 3 upper limit. To compare the XID fluxes between the different observations, we calculated the significance of the difference
| (3) |
and the ratio of the XID fluxes , where and are the maximum and minimum (or upper limit) source XID flux, and and are the errors of the maximum and minimum flux, respectively. This calculation was not performed whenever was an upper limit. Finally, the largest XID flux of each source was derived, excluding upper limits.
3.7 Spectral analysis
To extract the X-ray spectrum of individual sources, we selected an extraction region and a corresponding background region which was at least as large as the source region, was located on the same CCD at a similar off axis angle as the source, and did not contain any point sources or extended emission. For EPIC PN, we only accepted single-pixel events for the spectra of supersoft sources, while for all other spectra single and double-pixel events were used. For the EPIC-MOS detectors, single-pixel through to quadruple-pixel events were always used. Additionally, we only kept events with FLAG 0 for all three detectors. For each extraction region, we produced the corresponding response matrix files and ancillary response files.
For each source, the spectral fit was obtained by fitting all three EPIC spectra simultaneously, using the tool XSPEC. For the absorption, we used the TBabs model, with abundances from Wilms et al. (2000) and photoelectric absorption cross-sections from Bałucińska-Church & McCammon (1992) with a new He cross-section based on Yan et al. (1998).
3.8 Cross correlations
Sources were regarded as correlating if their positions overlapped within their 3 (99.73%) positional errors, defined as (Watson et al. 2009):
| (4) |
where is the statistical and the systematic error of the X-ray sources detected in the present study. The statistical error was derived by emldetect. The determination of the systematic error is described in Sect. 3.4. We use a value of 0 5, for all sources. The positional error of the sources in the catalogue used for cross-correlation is given by . The values of (68% error) used for the different X-ray catalogues can be found in Table 4. Exceptions to Eq. 4 are sources that are listed in more than one catalogue or that are resolved into multiple sources with Chandra. The first case is restricted to catalogues with comparable spatial resolution and hence positional uncertainty.
To identify the X-ray sources in the field of M~31 we searched for correlations with catalogues in other wavelength regimes. The XMM-Newton source catalogue was correlated with the following catalogues and public data bases:
- Globular Clusters:
- Novae:
-
Nova list of the M~31 Nova Monitoring Project111111http://www.mpe.mpg.de/~m31novae/opt/m31/M31_table.html ( is given for each individual source), PHS2007, Pietsch (2010)
- Supernova Remnants:
- Radio Catalogues:
-
Gelfand et al. (2005, is given for each individual source), Gelfand et al. (2004, is given for each individual source), Kimball & Ivezić (2008, ), Braun (1990, is given for each individual source), NVSS (NRAO/VLA Sky Survey121212http://www.cv.nrao.edu/nvss/NVSSlist.shtml; Condon et al. 1998, is given for each individual source)
- H II Regions, H Catalogue:
- Optical Catalogues:
- Infrared catalogues:
- Data bases:
-
the SIMBAD catalogue131313http://simbad.u-strasbg.fr/simbad (Centre de Données astronomiques de Strasbourg; hereafter SIMBAD) , the NASA Extragalactic Database141414http://nedwww.ipac.caltech.edu (hereafter NED)
| X-ray catalogue‡ | X-ray catalogue‡ | ||
|---|---|---|---|
| PFH2005 | DKG2004 | 0 3 | |
| SPH2008 | WNG2006 | 0 3 | |
| SHP97 | VG2007 | 0 4 | |
| SHL2001 | OBT2001 | 3′′ | |
| PFJ93 | O2006 | 1′′ | |
| TF91 | SBK2009 | 3′′+ | |
| Ka2002 | 0 3 | D2002 | 0 5 |
| KGP2002 | TP2004 | 1′′ | |
| WGK2004 | 1′′+ | ONB2010 | 1′′ |
Notes:
: indicates that the catalogue provides values for each source individually
: value taken from indicated paper
: TF91: Trinchieri & Fabbiano (1991), PFJ93: Primini et al. (1993), SHP97: Supper et al. (1997), SHL2001: Supper et al. (2001), OBT2001: Osborne et al. (2001), D2002: Di Stefano et al. (2002), KGP2002: Kong et al. (2002b), Ka2002: Kaaret (2002), WGK2004: Williams et al. (2004), DKG2004: Di Stefano et al. (2004), TP2004: Trudolyubov & Priedhorsky (2004), PFH2005: Pietsch et al. (2005b), O2006: Orio (2006), WNG2006: Williams et al. (2006b), VG2007: Voss & Gilfanov (2007), SPH2008: Stiele et al. (2008), SBK2009: Shaw Greening et al. (2009), ONB2010: Orio et al. (2010)
4 Colour image
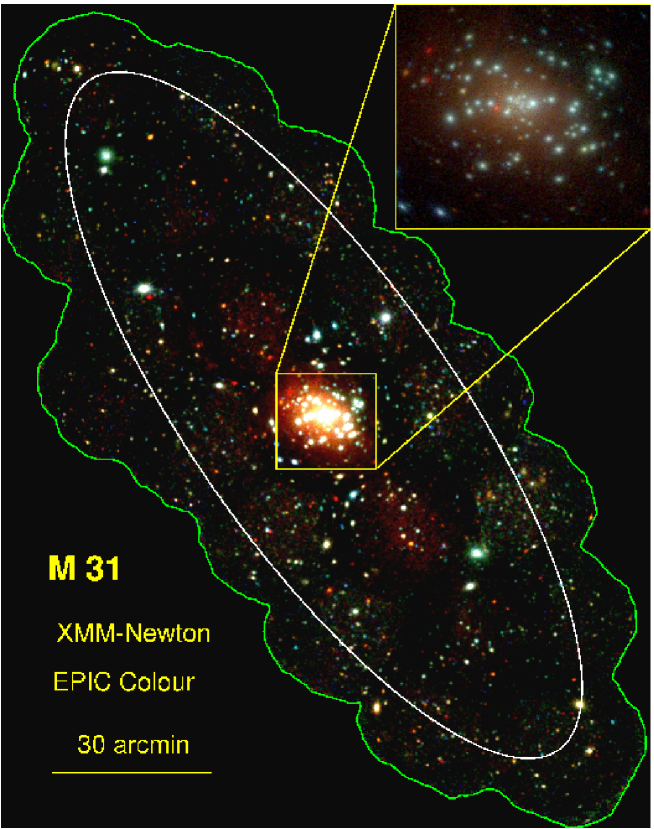
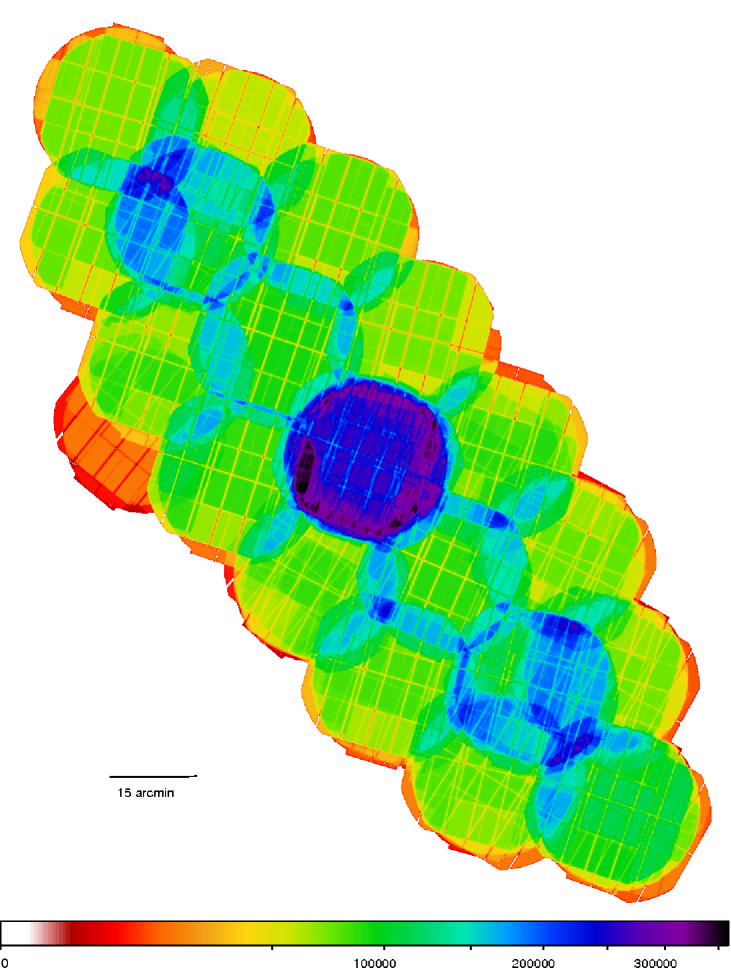
Figure 2 shows the combined, exposure corrected EPIC PN, MOS 1 and MOS 2 RGB (red-green-blue) mosaic image of the Deep Survey and archival data. The colours represent the X-ray energies as follows: red: 0.2–1.0 keV, green: 1.0–2.0 keV and blue: 2.0–12 keV. The optical extent of M~31 is indicated by the ellipse and the boundary of the observed field is given by the green contour. The image is smoothed with a 2D-Gaussian of 20′′ FWHM. In some observations, individual noisy MOS 1 and MOS 2 CCDs are omitted.
The images have not been corrected for the background of the detector or for vignetting.
The colour of the sources reflects their class. Supersoft sources appear in red. Thermal SNRs and foreground stars are orange to yellow. “Hard” sources (background objects, mainly AGN, and X-ray binaries or Crab-like SNRs) are blue to white.
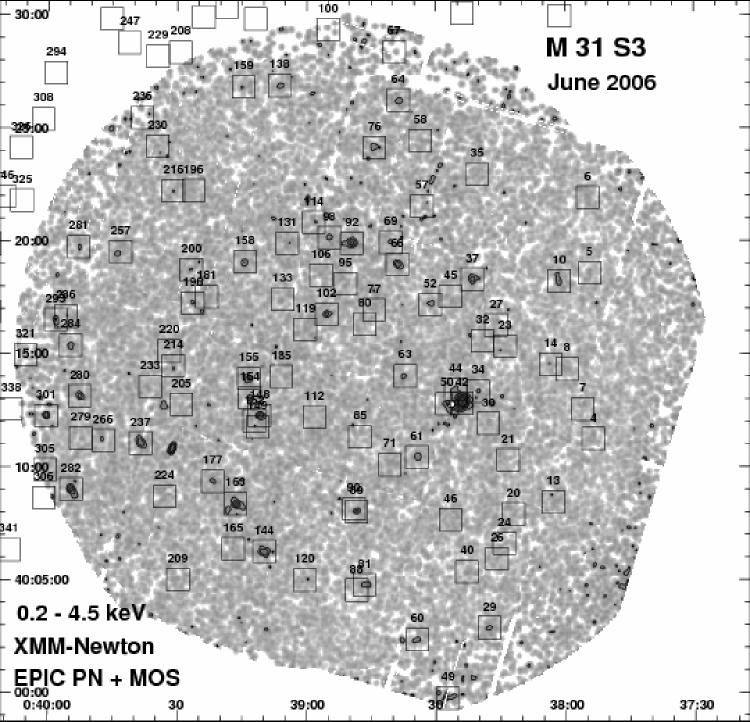
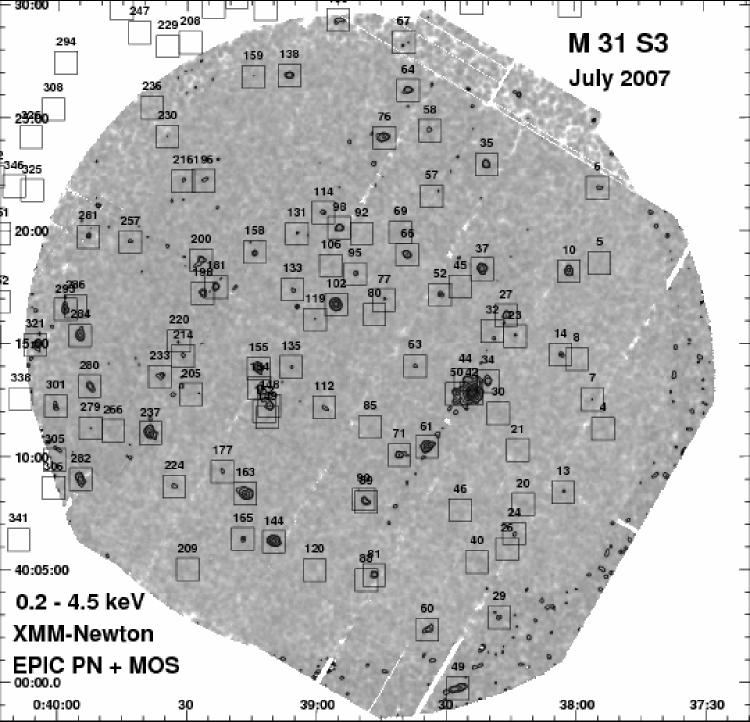
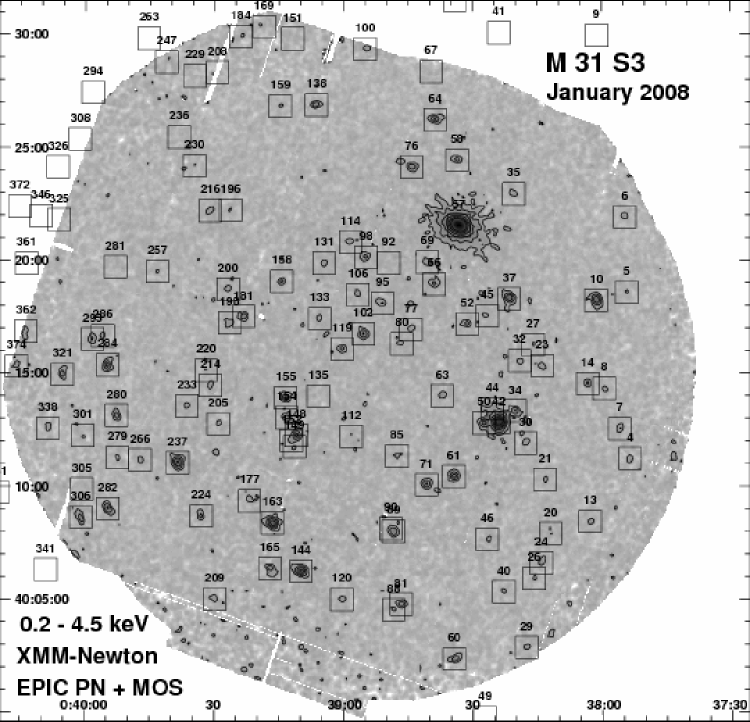
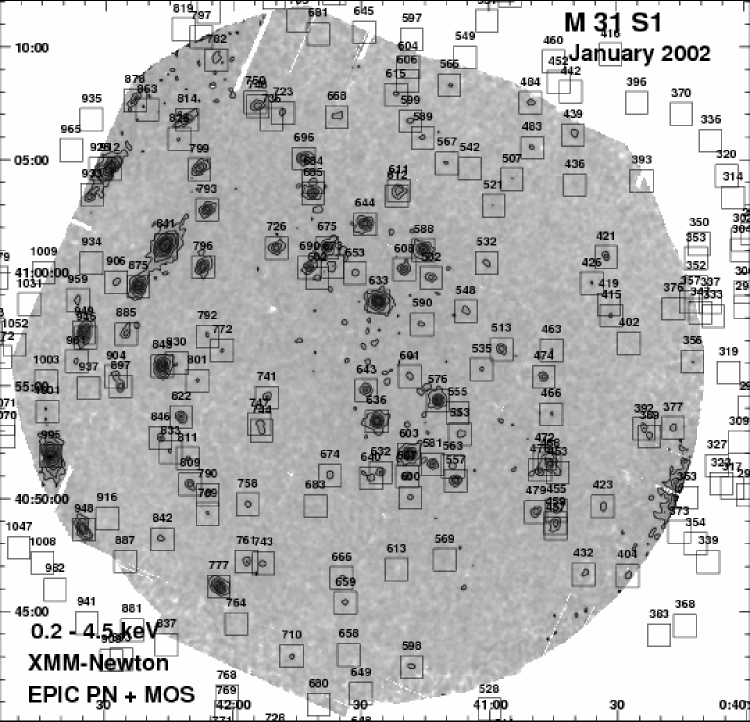
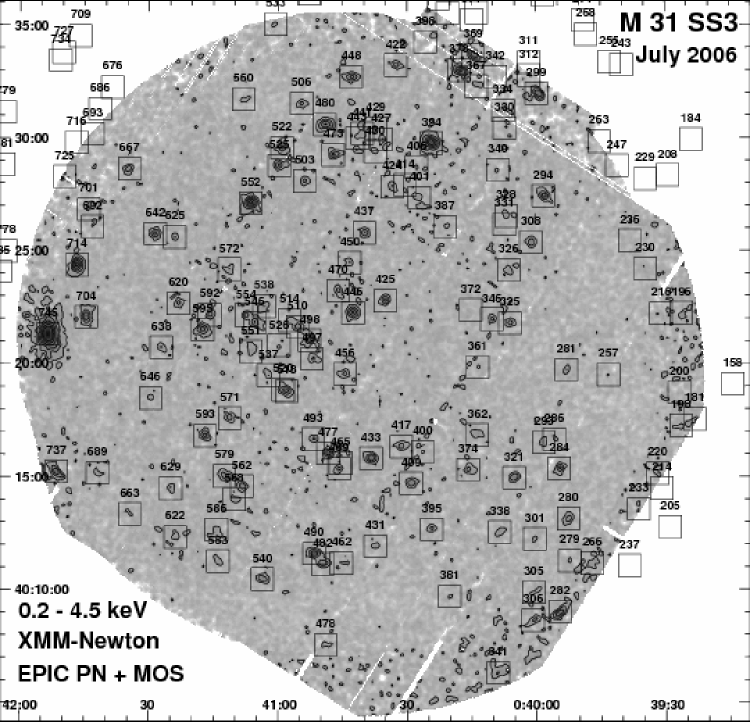
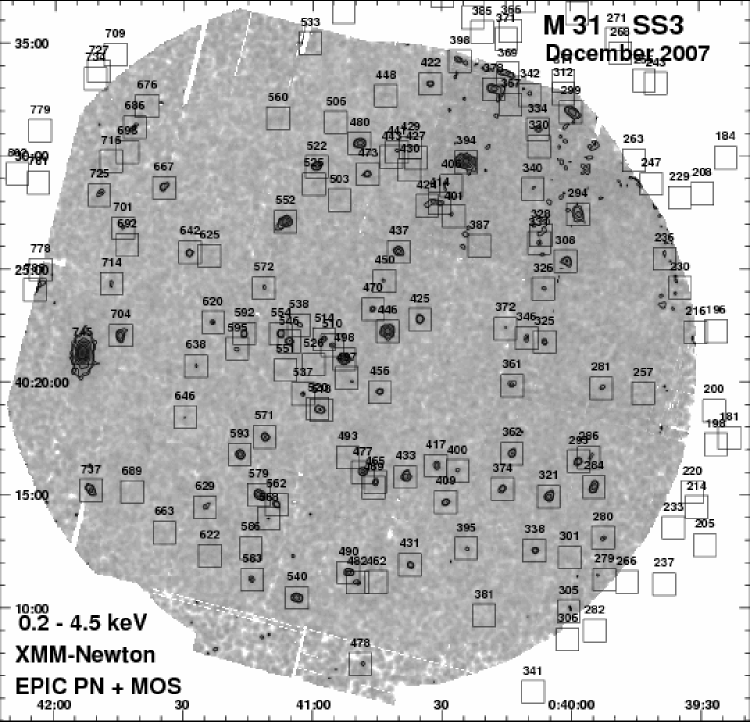
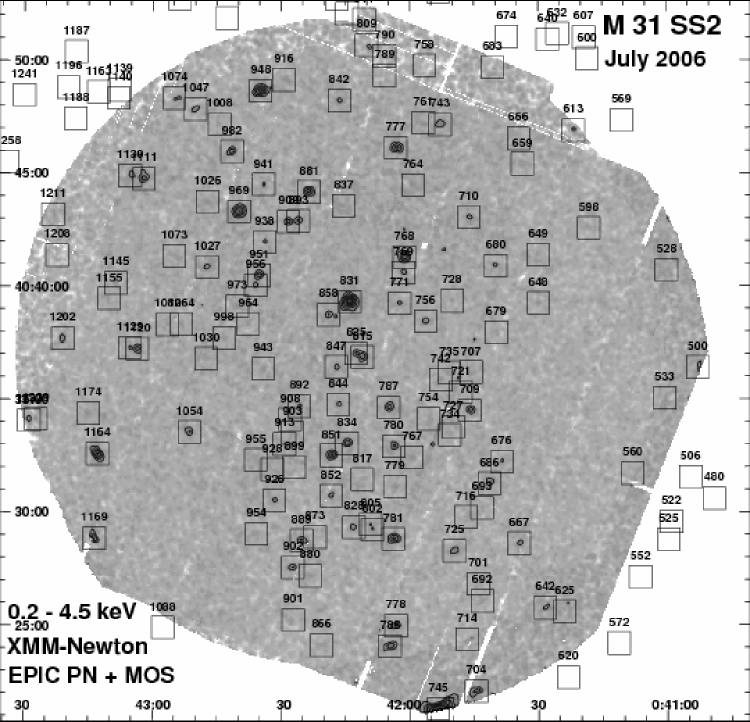
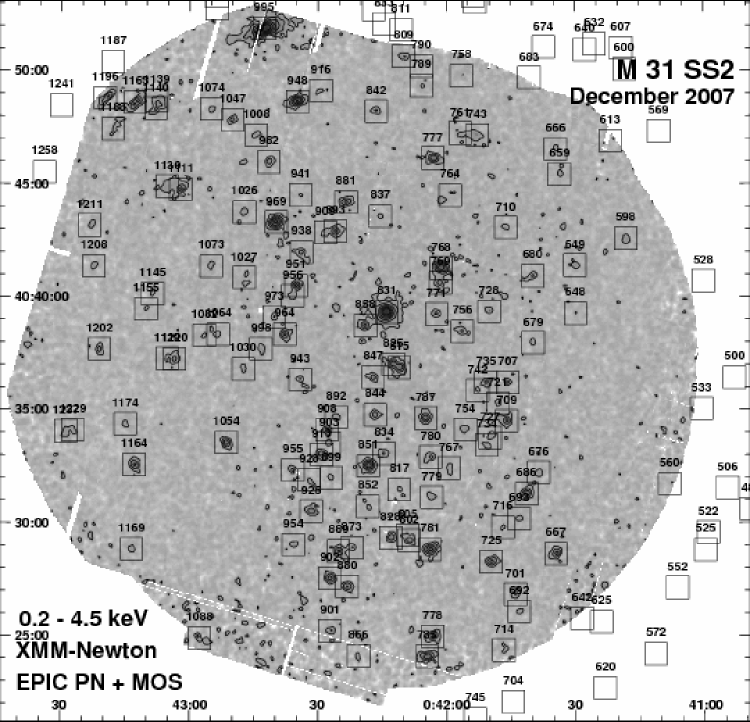
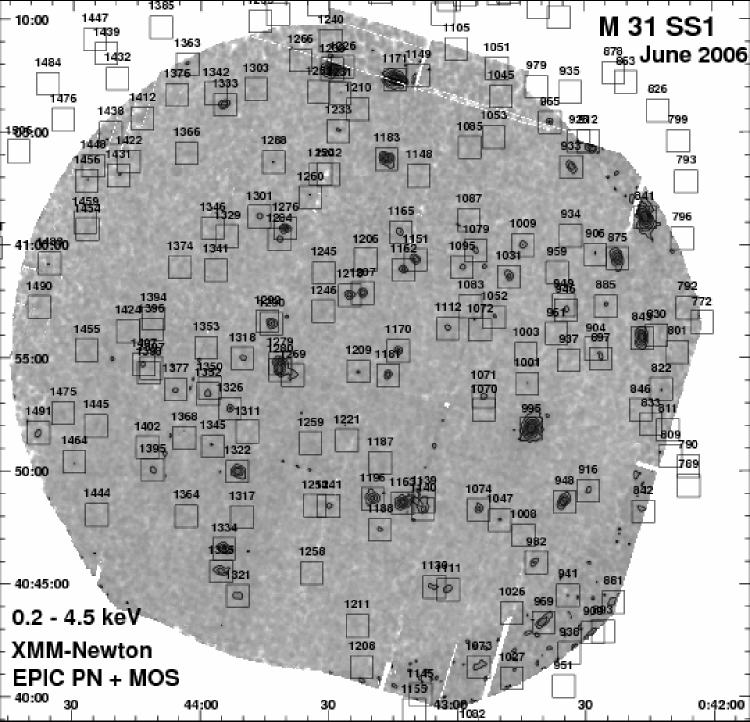
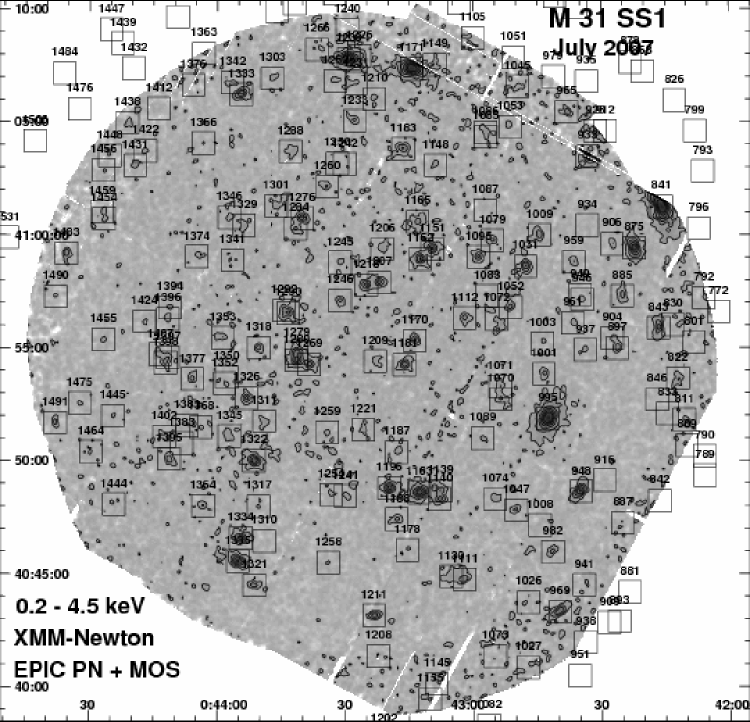
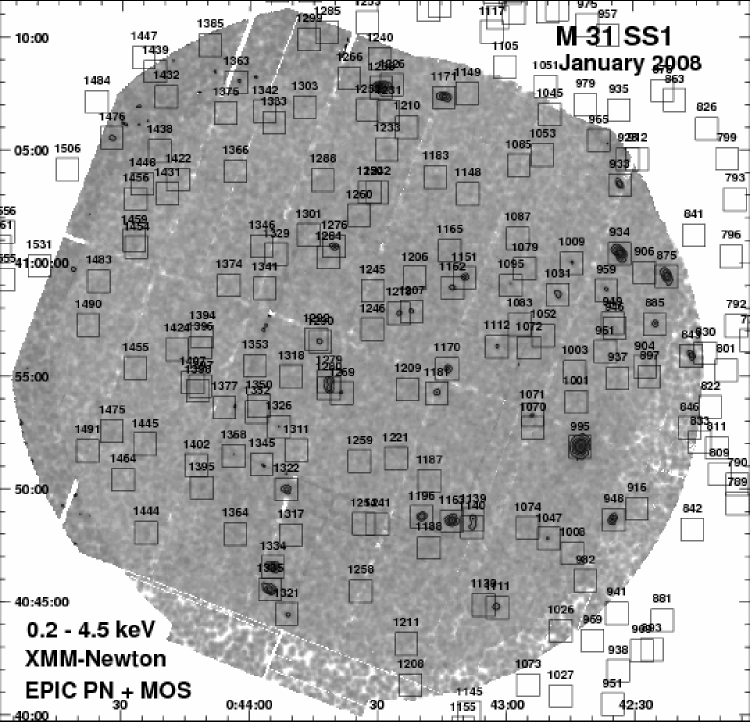
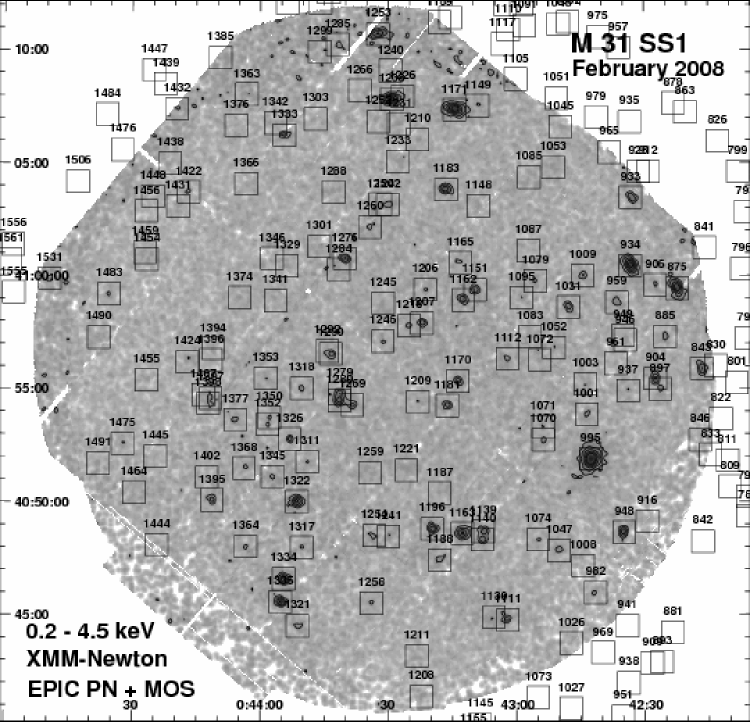
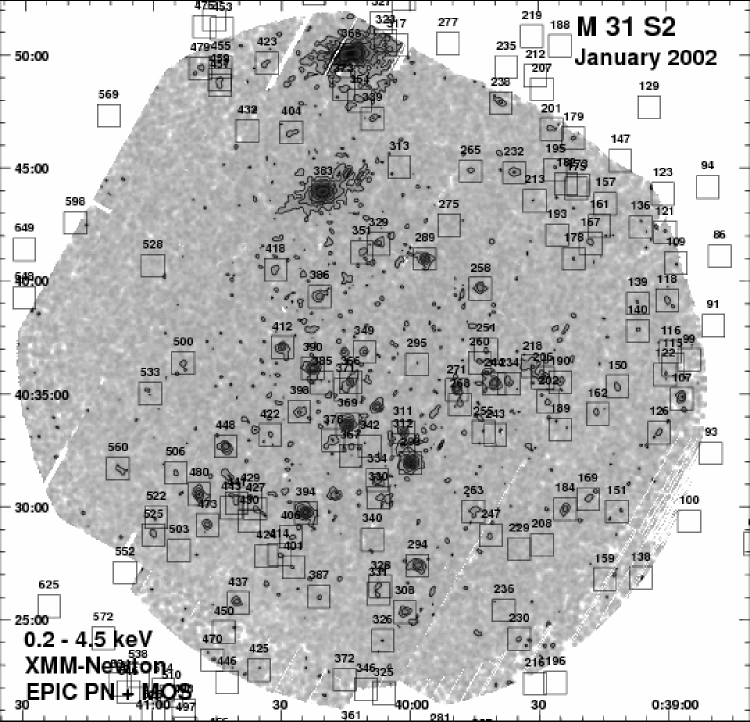
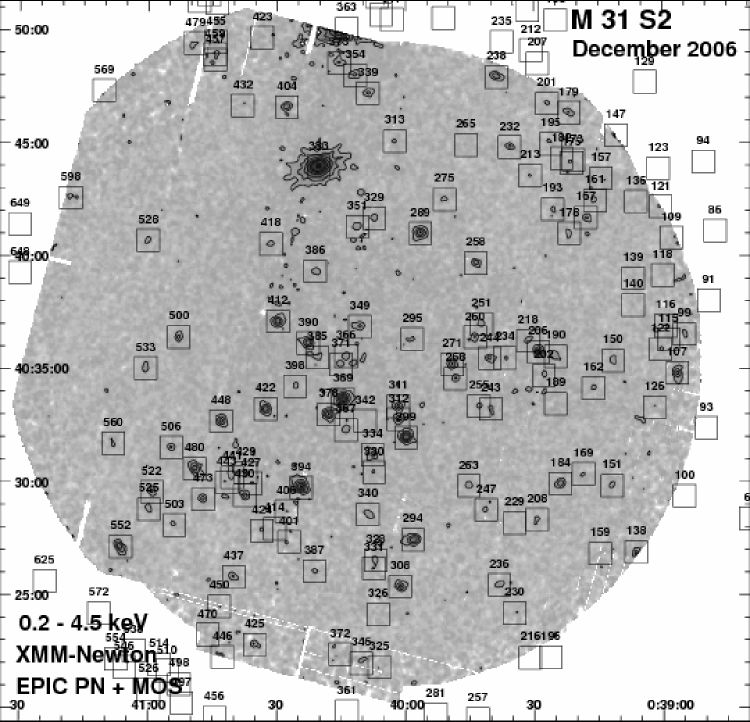
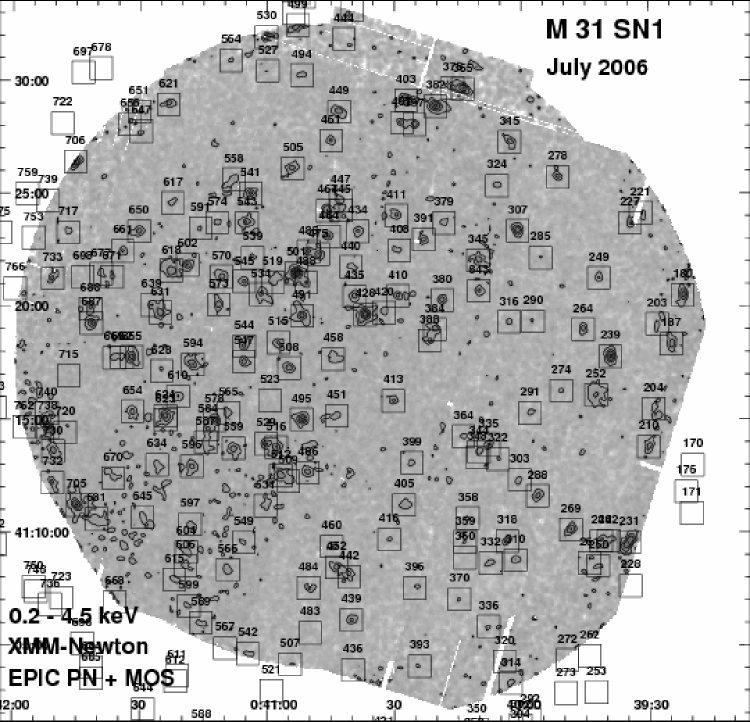
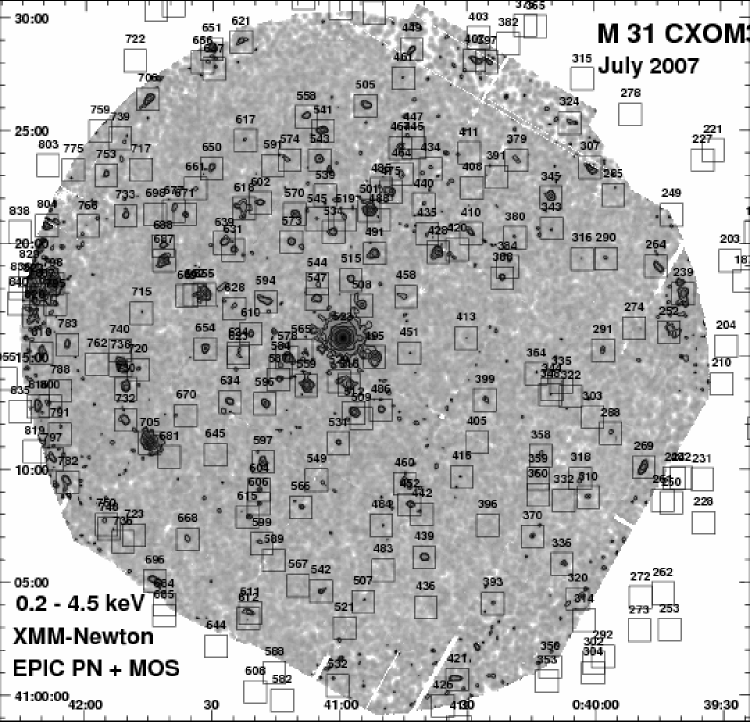
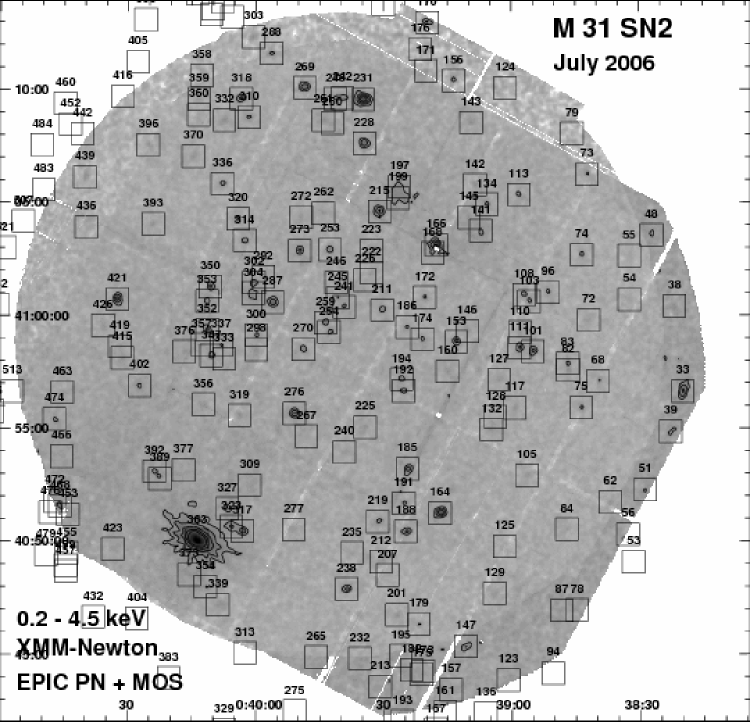
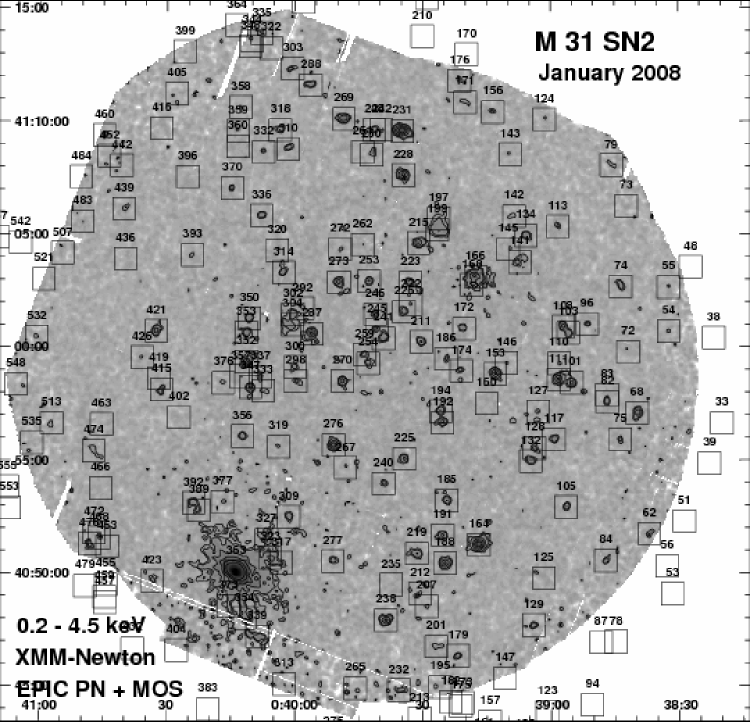
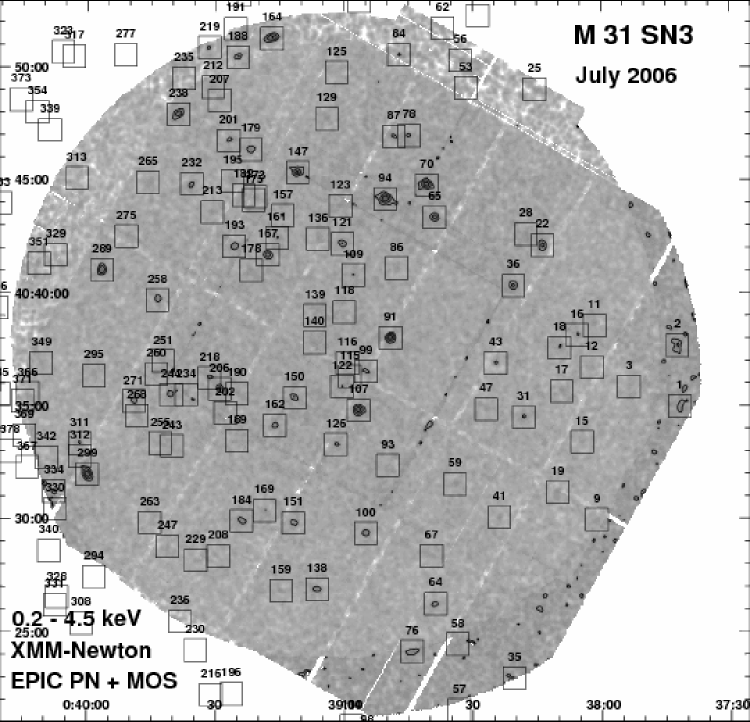
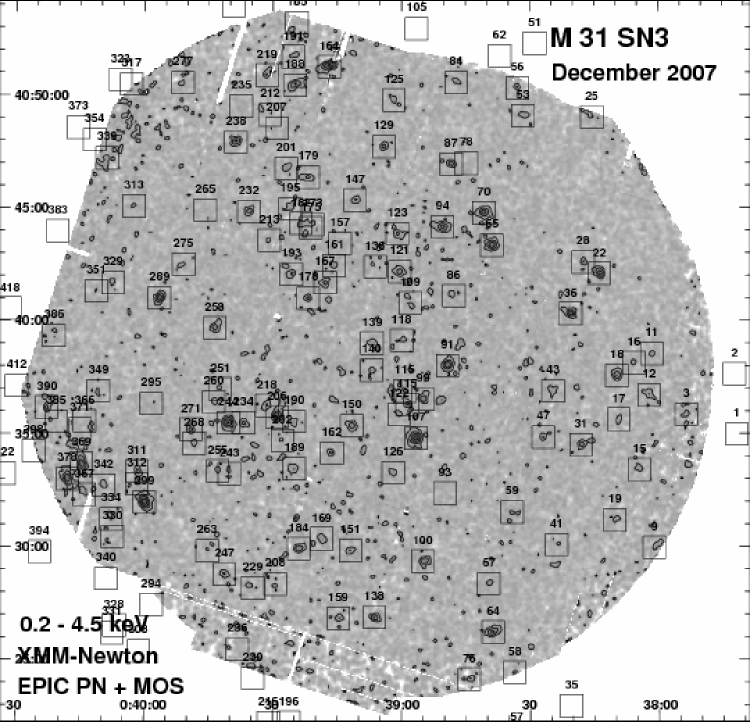
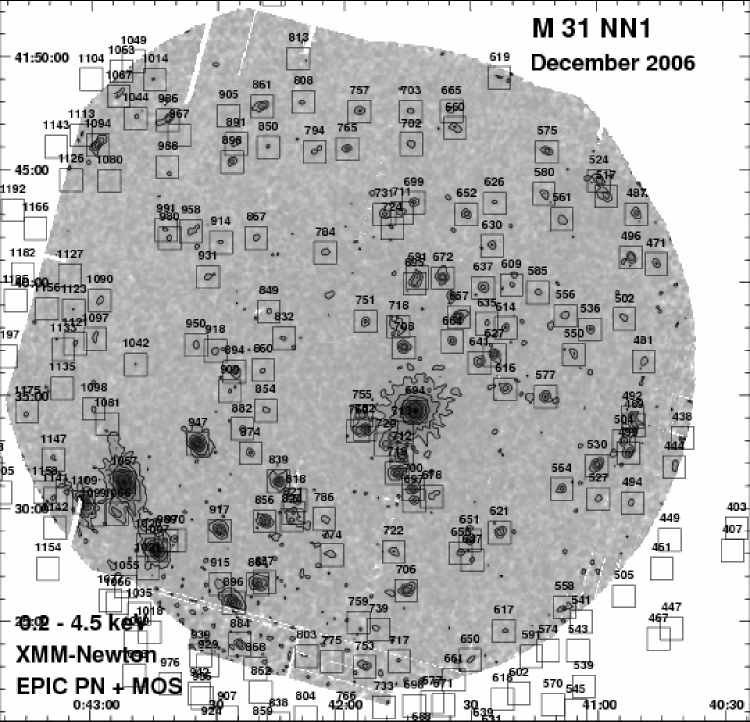
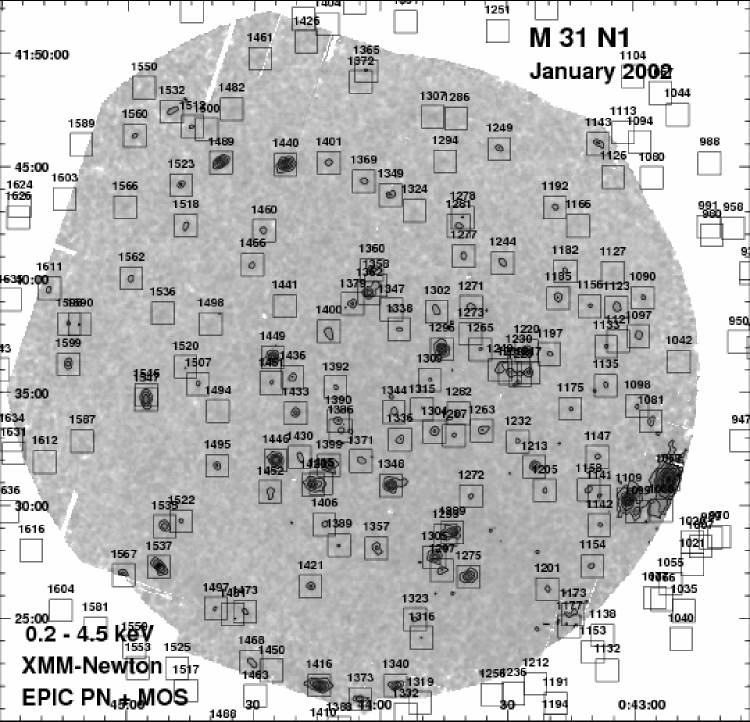
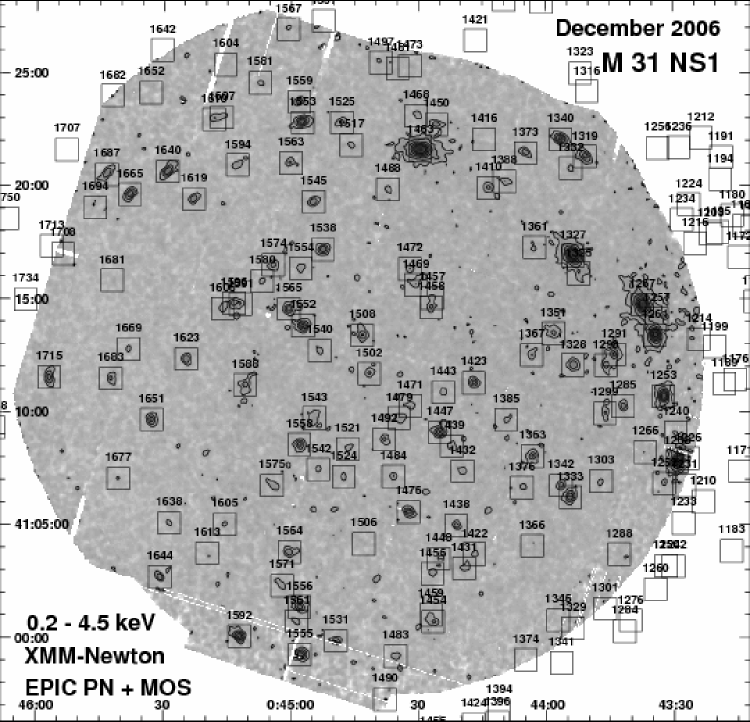
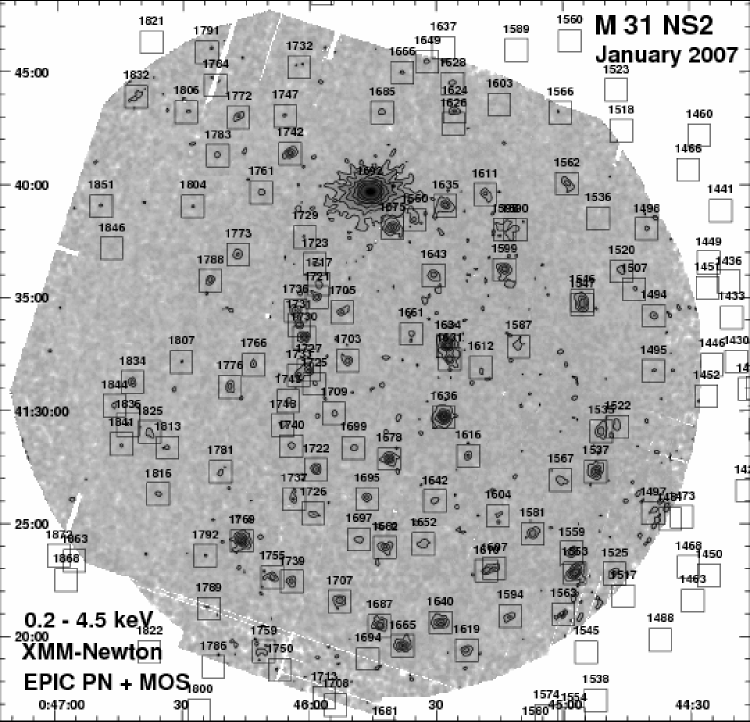
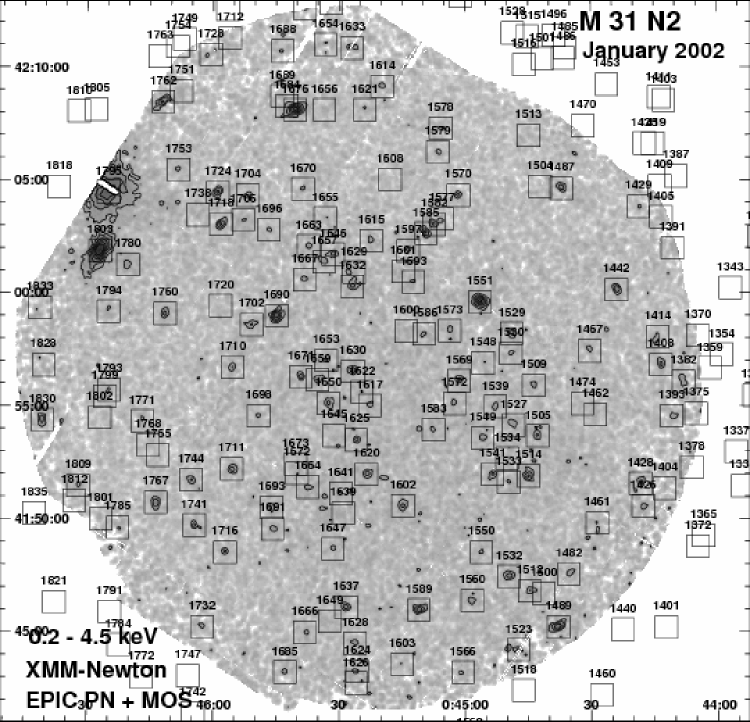
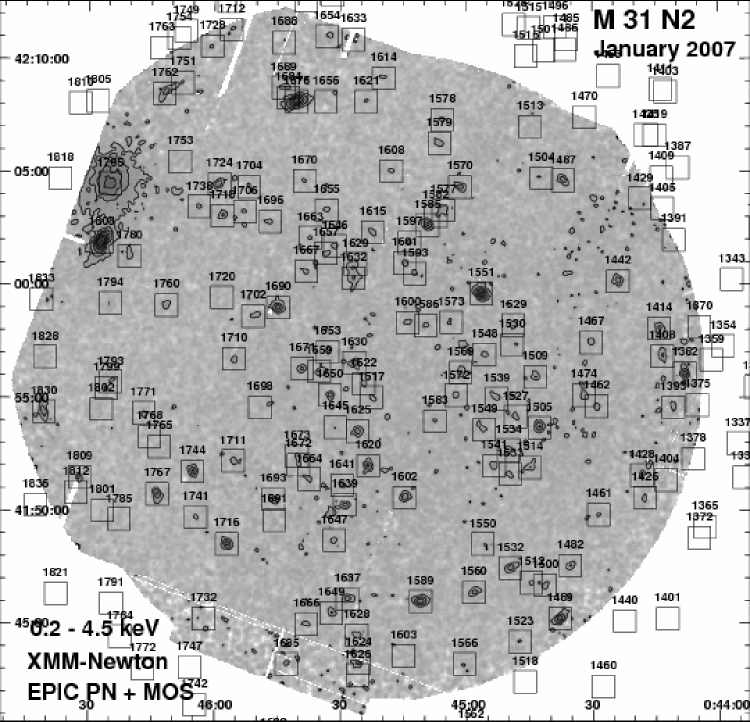
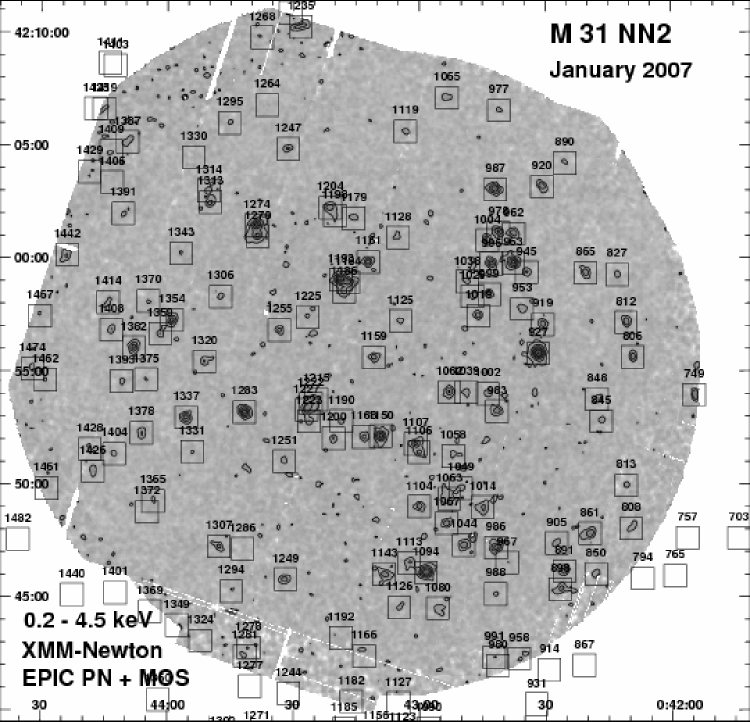
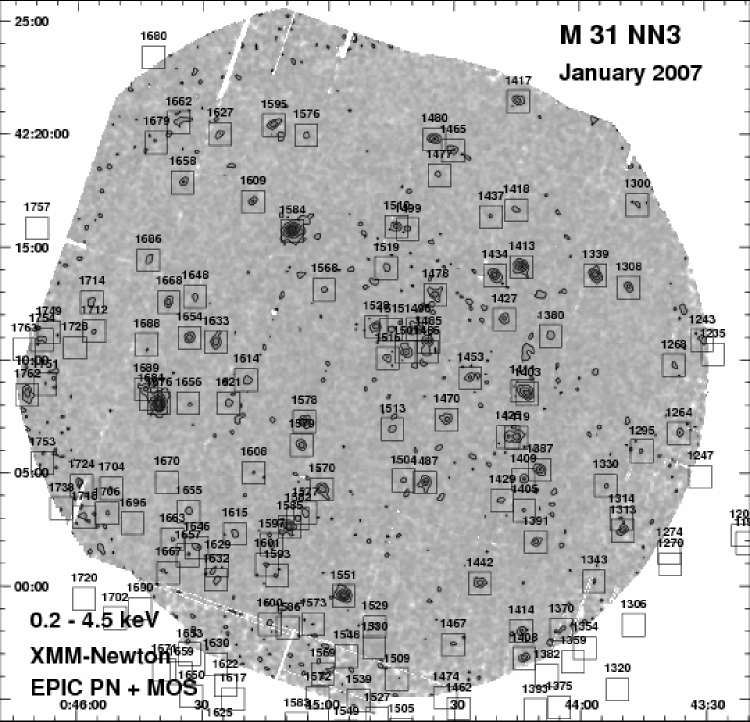
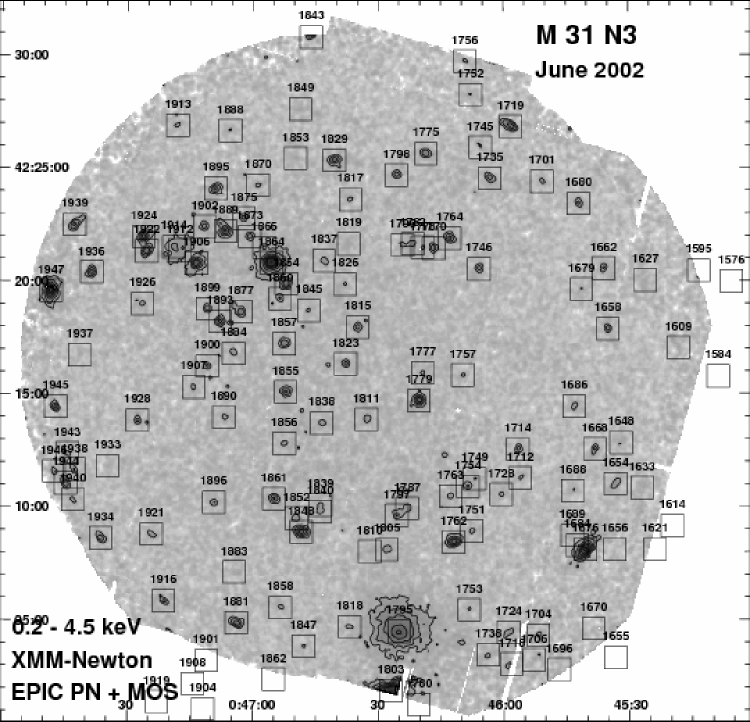
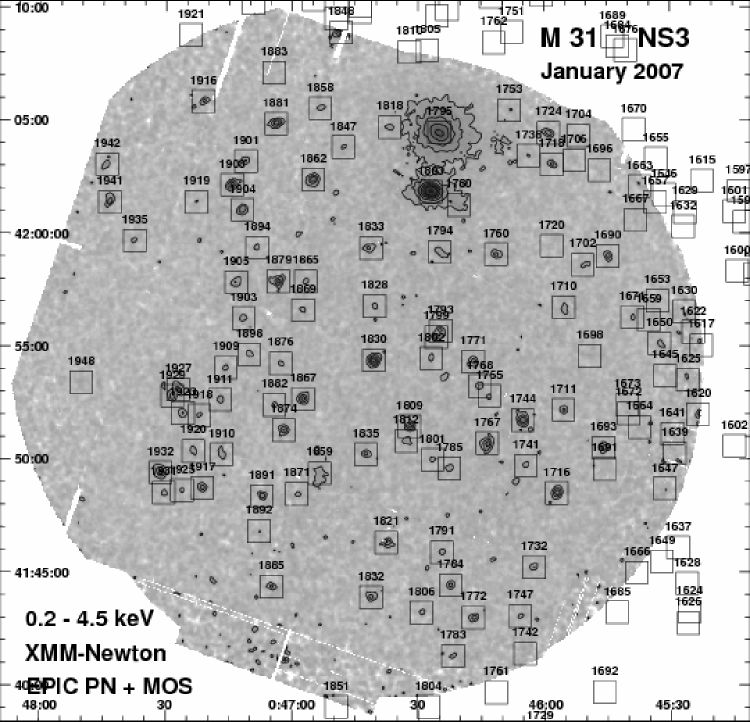
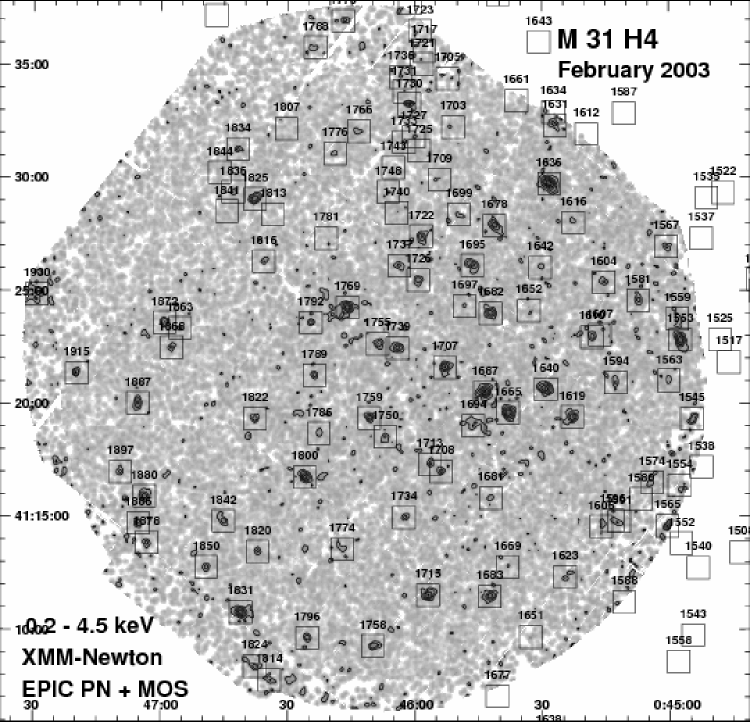
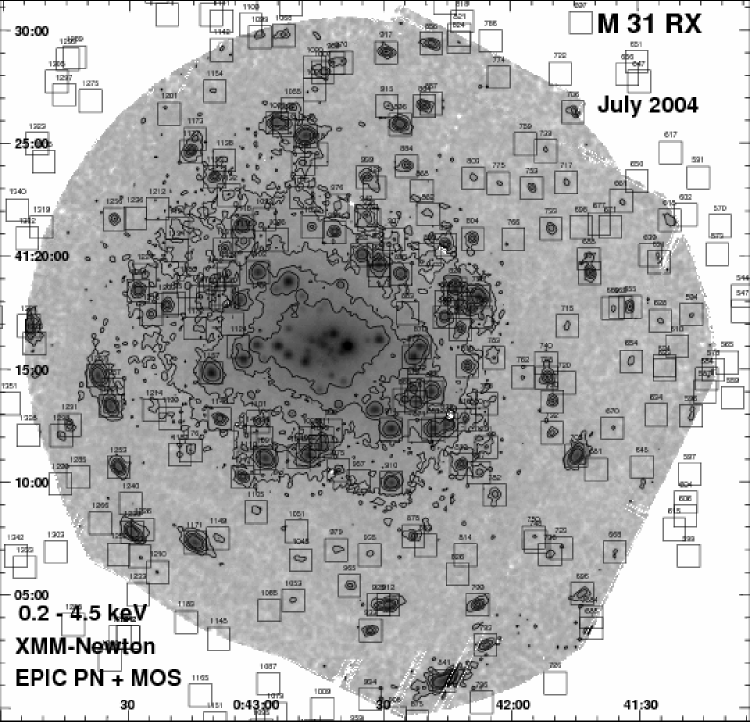
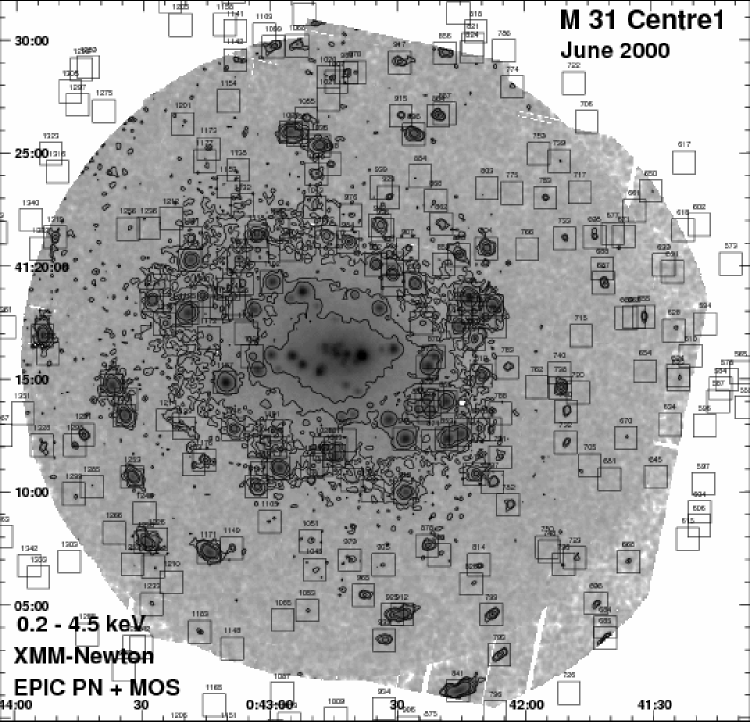
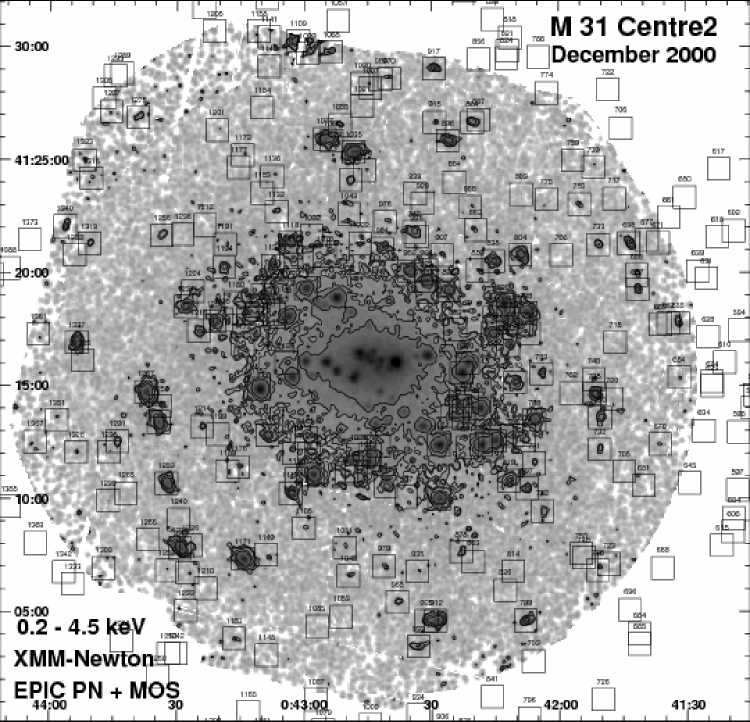
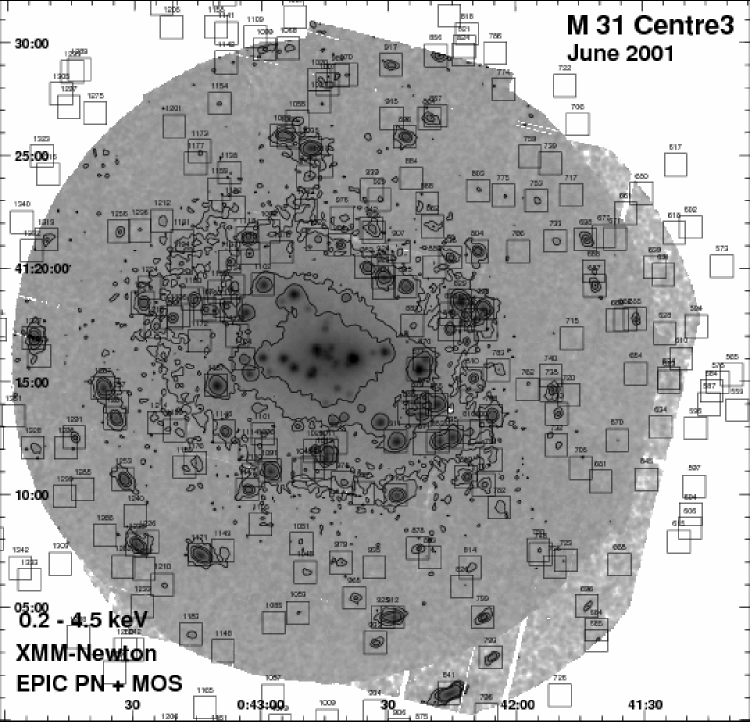
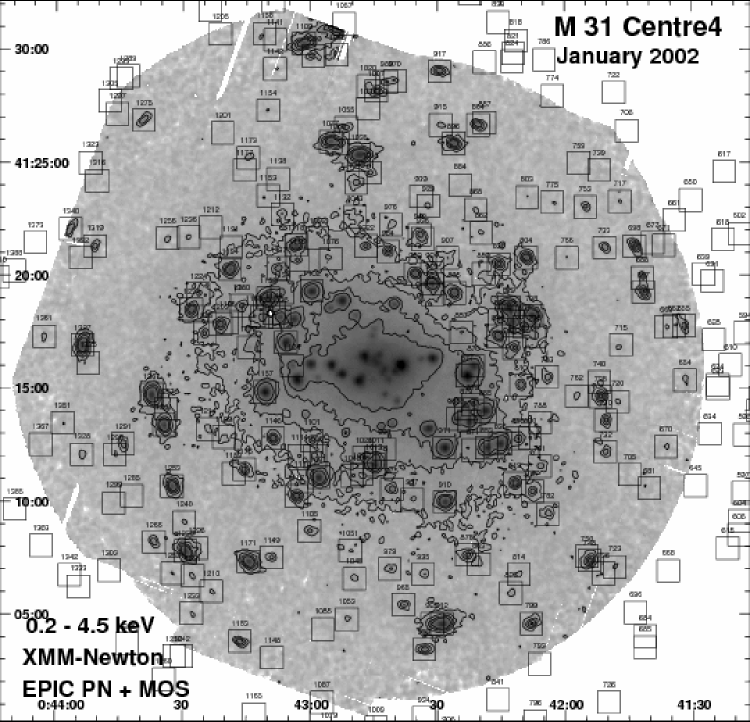
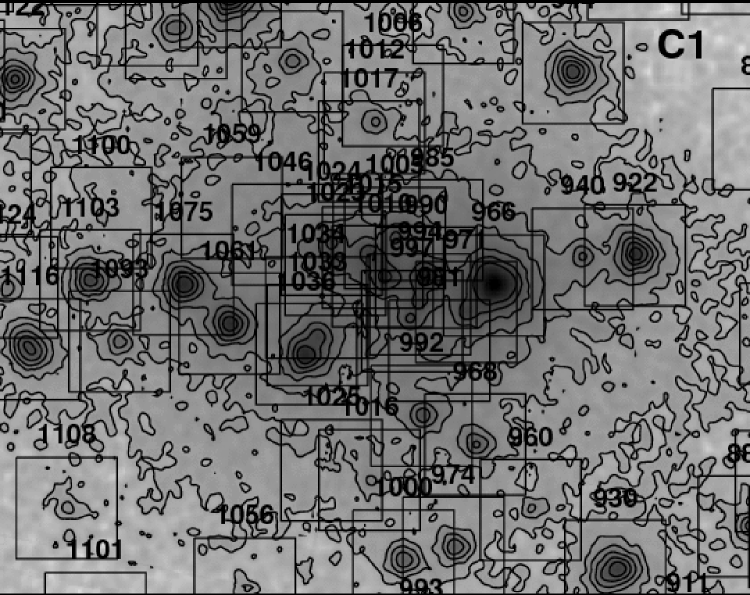
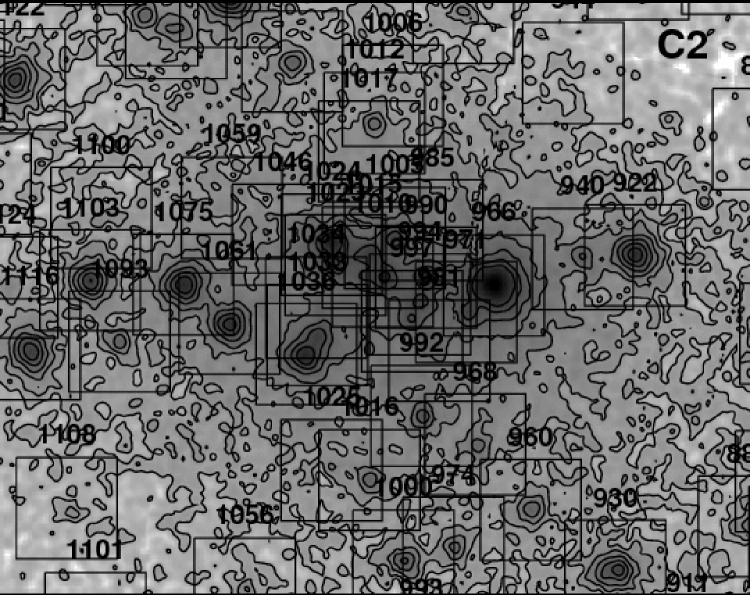
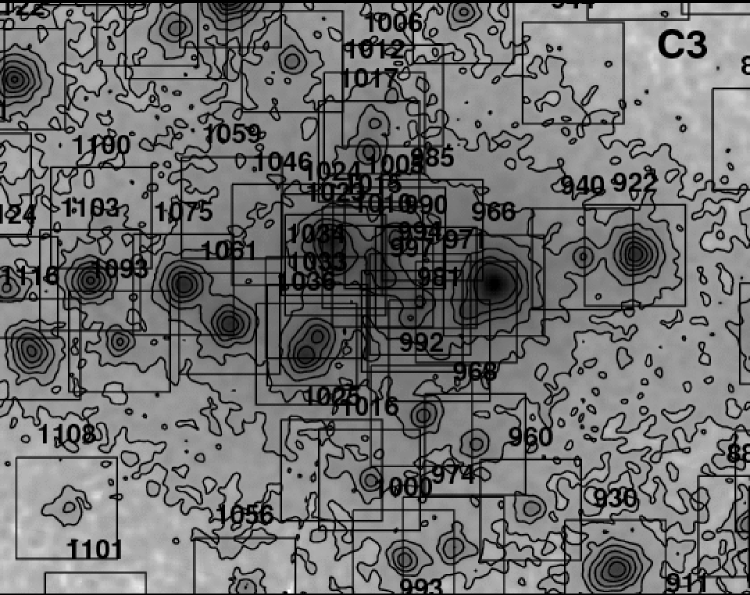
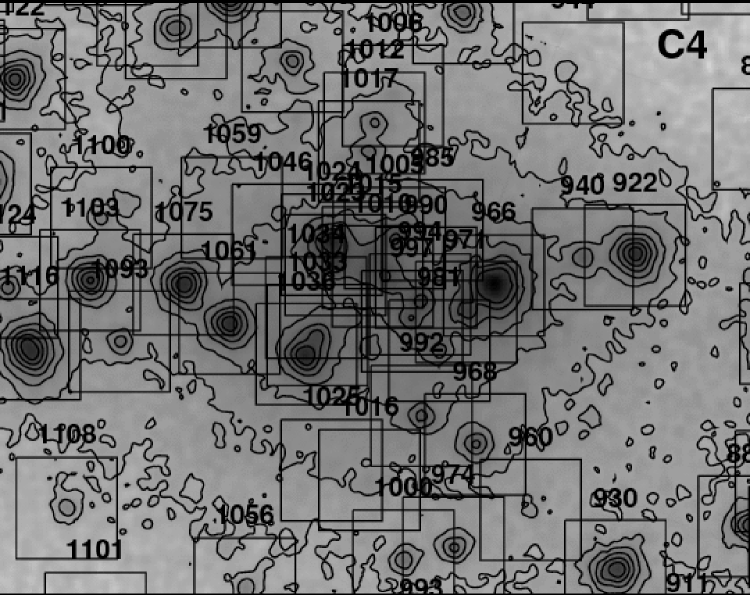
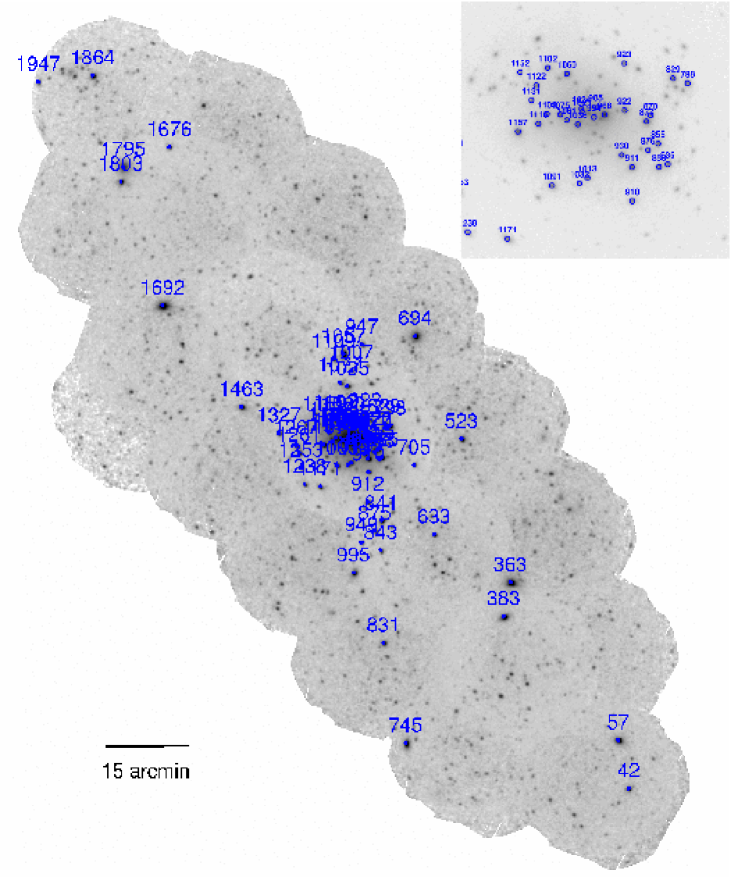
Logarithmically scaled XMM-Newton EPIC low background images made up of the combined images from the PN, MOS 1 and MOS 2 cameras in the (0.2–4.5) keV XID band for each M~31 observation can be found in the Appendix. The images also show X-ray contours, and the sources from the XMM LP-total catalogue are marked with boxes.
5 Source catalogue (XMM LP-total)
The source catalogue of the Deep XMM-Newton survey of M~31 (hereafter XMM LP-total catalogue) contains 1 897 X-ray sources. Of these sources 914 are detected for the first time in X-rays.
The source parameters are summarised in Table 5, which gives the source number (Col. 1), detection field from which the source was entered into the catalogue (2), source position (3 to 9) with (99.73%) uncertainty radius (10), likelihood of existence (11), integrated PN, MOS 1 and MOS 2 count rate and error (12,13) and flux and error (14,15) in the (0.2–4.5) keV XID band, and hardness ratios and errors (16–23). Hardness ratios are calculated only for sources for which at least one of the two band count rates has a significance greater than . Errors are the properly combined statistical errors in each band and can extend beyond the range of allowed values of hardness ratios as defined previously (–1.0 to 1.0; Eq. 2). The “Val” parameter (Col 24) indicates whether the source is within the field of view (true or false, “T” or “F”) in the PN, MOS 1 and MOS 2 detectors respectively.
Table 5 also gives the exposure time (25), source existence likelihood (26), the count rate and error (27, 28) and the flux and error (29, 30) in the (0.2–4.5) keV XID band, and hardness ratios and errors (31–38) for the EPIC PN. Columns 39 to 52 and 53 to 66 give the same information corresponding to Cols. 25 to 38, but for the EPIC MOS 1 and MOS 2 instruments. Hardness ratios for the individual instruments were again screened as described above. From the comparison between the hardness ratios derived from the integrated PN, MOS 1 and MOS 2 count rates (Cols. 16–23) and the hardness ratios from the individual instruments (Cols. 31–38, 45–52 and 59–66), it is clear that the combined count rates from all instruments yielded a significantly larger fraction of hardness ratios above the chosen significance threshold.
Column 67 shows cross correlations with published M~31 X-ray catalogues (cf. Sect. 3.8). We discuss the results of the cross correlations in Sects. 9 and 10.
In the remaining columns of Table 5, we give information extracted from the USNO-B1, 2MASS and LGGS catalogues (cf. Sect. 3.8). The information from the USNO-B1 catalogue (name, number of objects within search area, distance, B2, R2 and I magnitude of the brightest151515in B2 magnitude object) is given in Cols. 68 to 73. The 2MASS source name, number of objects within search area, and the distance can be found in Cols. 74 to 76. Similar information from the LGGS catalogue is given in Cols. 77 to 82 (name, number of objects within search area, distance, V magnitude, V-R and B-V colours of the brightest161616in B magnitude object). To improve the reliability of source classifications we used the USNO-B1 B2 and R2 magnitudes to calculate
| (5) |
and the LGGS V magnitude to calculate
| (6) |
following Maccacaro et al. (1988, see Cols. 83–86).
The X-ray sources in the XMM LP-total catalogue are identified or classified based on properties in X-rays (HRs, variability, extent) and of the correlated objects in other wavelength regimes (Cols. 87 and 88 in Table 5). For classified sources the class name is given in angled brackets. Identification and classification criteria are summarised in Table 6, which provides, for each source class (Col. 1), the classification criteria (2), and the numbers of identified (3) and classified (4) sources. The hardness ratio criteria are based on model spectra. Details on the definition of these criteria can be found in Sect. 6 of PFH2005. As we have no clear hardness ratio criteria to discriminate between XRBs, Crab-like supernova remnants (SNRs) or AGN we introduced a hard class for those sources. If such a source shows strong variability (i. e. V10) on the examined time scales it is likely to be an XRB. Compared with SPH2008 the HR2 selection criterion for SNRs was tightened (from HR2 to HR2EHR2) to exclude questionable SNR candidates from the class of SNRs. If we applied the former criterion to the survey data, 35 sources would be classified as SNRs in addition to those listed in Table 6. Most of the 35 sources are located outside the D25 ellipse, and none of them correlates with an optically identified SNR, a radio source, or an HII region. In addition, the errors in HR2 are of the same order as the HR2 values. It is therefore very likely that these sources do belong to other classes, since the strip between HR20 is populated by foreground stars, XRBs, background objects, and candidates for these three classes. Outcomes of the identification and classification processes are discussed in detail in Sects. 9 and 10.
The last column (89) of Table 5 contains the XMM-Newton source name as registered to the IAU Registry. Source names consist of the acronym XMMM31 and the source position as follows: XMMM31 Jhhmmss.s+ddmmss, where the right ascension is given in hours (hh), minutes (mm) and seconds (ss.s) truncated to decimal seconds and the declination is given in degrees (dd), arc minutes (mm) and arc seconds (ss) truncated to arc seconds, for equinox 2000. In the following, we refer to individual sources by their source number (Col. 1 of Table 5), which is marked with a “N” at the front of the number.
Of the 1 897 sources, 1 247 can only be classified as hard sources, while 123 sources remain without classification. Two of them (N 482, N 768) are highly affected by optical loading; both “X-ray sources” coincide spatially with very bright optical foreground stars (USNO-B1 R2 magnitudes of 6.76 and 6.74 respectively). The spectrum of source N 482 is dominated by optical loading. This becomes evident from the hardness ratios which indicate an SSS. For N 768 the hardness ratios would allow a foreground star classification. The obtained count rates and fluxes of both sources are affected by the usage of epreject, which neutralises the corrections applied for optical loading. Therefore residuals are visible in the difference images created from event lists obtained with and without epreject. As we cannot exclude the possibility that some of the detected photons are true X-rays – especially for source N 768 –, we decided to include them in the XMM LP-total catalogue, but without a classification.
| Source class | Selection criteria | identified | classified |
|---|---|---|---|
| fg Star | and HR2EHR and HR3EHR or not defined | 40 | 223 |
| AGN | Radio source and not classification as SNR from HR2 or optical/radio | 11 | 49 |
| Gal | optical id with galaxy | 4 | 19 |
| GCl | X-ray extent and/or spectrum | 1 | 5 |
| SSS | HR, HR2EHR or HR2 not defined, HR3, HR4 not defined | 30 | |
| SNR | HR and HR2EHR and not a fg Star, or id with optical/radio SNR | 25 | 31 |
| GlC | optical id | 36 | 16 |
| XRB | optical id or X-ray variability | 10 | 26 |
| hard | HR2EHR or only HR3 and/or HR4 defined, and no other classification | 1 247 |
5.1 Flux distribution
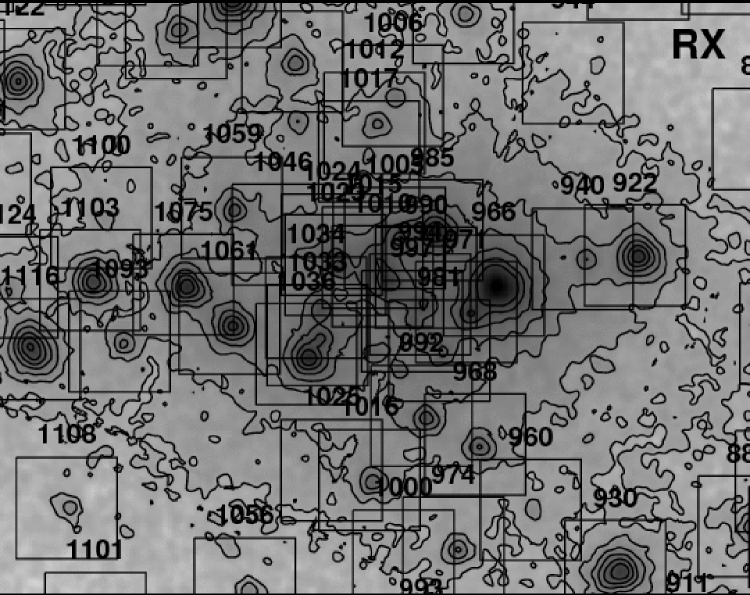
The faintest source (N 526) has an XID band flux of 5.8 erg cm-2 s-1. The source with the highest XID Flux (N 966, XID band flux of 3.75 erg cm-2 s-1) is located in the centre of M~31 and identified as a Z-source LMXB (Barnard et al. 2003). This source has a mean absorbed XID luminosity of 2.74 erg s-1.
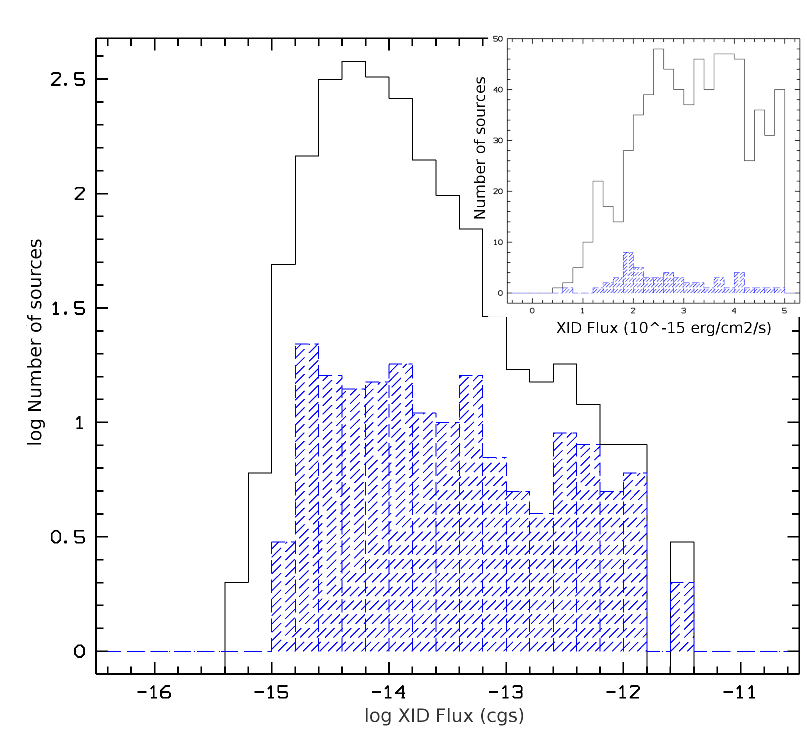
Figure 3 shows the distribution of the XID (0.2–4.5 keV) source fluxes. Plotted are the number of sources in a certain flux bin. We see from the inlay that the number of sources starts to decrease in the bin from 2.4 to 2.6 erg cm-2 s-1. This XID flux roughly determines the completeness limit of the survey and corresponds to an absorbed 0.2–4.5 keV limiting luminosity of erg s-1.
Previous X-ray studies (Williams et al. 2004, and references therein) noted a lack of bright sources ( erg s-1; 0.1–10 keV) in the northern half of the disc compared to the southern half. This finding is not supported in the present study. Excluding the pointings to the centre of M~31, we found in the remaining observations 13 sources in each hemisphere that were brighter than erg s-1.171717The luminosity is based on XID Fluxes. Using the total 0.2–12 keV band the result does not change (23 in the northern half and 24 in the southern half). The reason our survey does not support the old results is that we found several bright sources in the outer regions of the northern half of the disk, which have not been covered in Williams et al. (2004, and references therein). In the central field of M~31, a total of 41 sources brighter than erg s-1 (0.2–4.5 keV) were found.
Figure 4 shows the spatial distribution of the bright sources. Striking features are the two patches located north and south of the centre. The southern one seems to point roughly in the direction of M 32 (N 995), while the northern one ends in the globular cluster B 116 (N 947). However there is no association to any known spatial structure of M~31, like e. g. the spiral arms.
5.2 Exposure map
Figure 5 shows the exposure map used to create the colour image of all XMM-Newton Large Survey and archival observations (Fig. 2). The combined MOS exposure was weighted by a factor of 0.4, before being added to the PN exposure. However, this map does not quite represent the exposures used in source detection; overlapping regions were not combined during source detection.
From Fig. 5 we see that the exposure for most of the surveyed area is rather homogeneous. Exceptions are the central area, overlapping regions and observation h4.
5.3 Hardness ratio diagrams
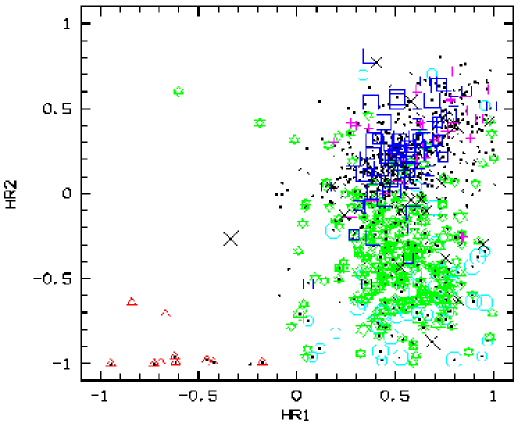
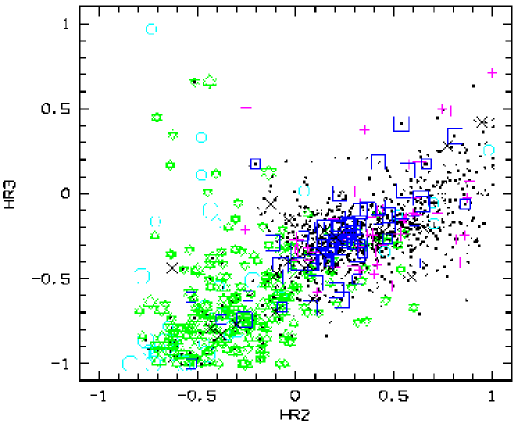
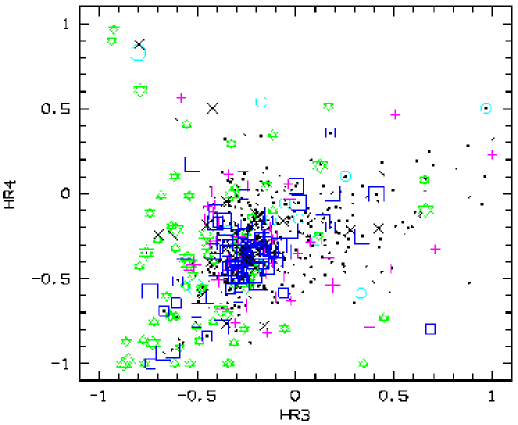
We plot X-ray colour/colour diagrams based on the HRs (see Fig. 6). Sources are plotted as dots if the error in both contributing HRs is below 0.2. Classified and identified sources are plotted as symbols in all cases. Symbols including a dot therefore mark the well-defined HRs of a class.
From the HR1-HR2 diagram (upper panel in Fig. 6) we note that the class of SSSs is the only one that can be defined based on hardness ratios alone. In the part of the HR1-HR2 diagram that is populated by SNRs, most of the foreground stars and some background objects and XRBs are also found.
Foreground star candidates can be selected from the HR2-HR3 diagram (middle panel in Fig. 6), where most of them are located in the lower left corner. The HR3-HR4 diagram (lower panel in Fig. 6) does not help to disentangle the different source classes. Thus, we need additional information from correlations with sources in other wavelengths or on the source variability or extent to be able to classify the sources.
5.4 Extended sources
The XMM LP-total catalogue contains 12 sources which are fitted as extended sources with a likelihood of extension larger than 15. This value was chosen so as to minimise the number of spurious detections of extended sources (H. Brunner; private communication), as well as keeping all sources that can clearly be seen as extended sources in the X-ray images. A convolution of a -model cluster brightness profile (Cavaliere & Fusco-Femiano 1976) with the XMM-Newton point spread function was used to determine the extent of the sources (cf. Sect. 3.3). This model describes the brightness profile of galaxy clusters, as
| (7) |
where denotes the core radius; this is also the extent parameter given by emldetect.
Table 7 gives the source number (Col. 1), likelihood of detection (2), the extent found (3) and its associated error (4) in arcsec, the likelihood of extension (5), and the classification of the source (6, see Sect. 9.2) for each of the 12 extended sources. Additional comments taken from Table 5 are provided in the last column.
| SRC | DET_ML | EXT+ | EEXT+ | EXT_ML | XFLUX∗ | XEFLUX∗ | class | comment† |
|---|---|---|---|---|---|---|---|---|
| (1) | (2) | (3) | (4) | (5) | (6) | (7) | (8) | (9) |
| 141 | 65.08 | 11.22 | 1.29 | 23.68 | 1.45 | 0.20 | GCl | GLG127(Gal), 37W 025A (IR, RadioS; NED) |
| 199 | 275.16 | 17.33 | 1.05 | 174.73 | 4.31 | 0.29 | hard | |
| 252 | 222.05 | 14.64 | 1.12 | 81.60 | 4.40 | 0.49 | GCl | 5 optical objects in error box |
| 304 | 299.75 | 15.10 | 0.92 | 133.62 | 2.20 | 0.18 | GCl | B242 [CHM09]; RBC3.5: GlC |
| 442 | 33.76 | 11.60 | 1.71 | 15.44 | 1.62 | 0.28 | hard | |
| 618 | 271.08 | 6.20 | 0.73 | 42.86 | 3.15 | 0.21 | hard | |
| 718 | 77.75 | 7.18 | 1.23 | 21.47 | 0.58 | 0.07 | Gal | B052 [CHM09], RBC3.5 |
| 1 130 | 168.31 | 10.80 | 0.97 | 44.23 | 3.27 | 0.31 | hard | |
| 1 543 | 70.49 | 11.87 | 1.37 | 28.63 | 1.51 | 0.19 | GCl | [MLA93] 1076 PN (SIM,NED) |
| 1 795 | 11 416.36 | 18.79 | 0.29 | 4 169.74 | 98.87 | 1.43 | GCl | GLG253 (Gal), [B90] 473, z=0.3 [KTV2006] |
| 1 859 | 107.09 | 13.73 | 1.40 | 43.89 | 1.23 | 0.19 | hard | |
| 1 912 | 332.06 | 23.03 | 1.23 | 213.90 | 5.43 | 0.37 | GCl | cluster of galaxies candidate |
Notes:
: Extent and error of extent in units of 1′′; 1′′ corresponds to 3.8 pc at the assumed distance of M~31
: XID Flux and flux error in units of 1 erg cm-2 s-1
: Taken from Table 5
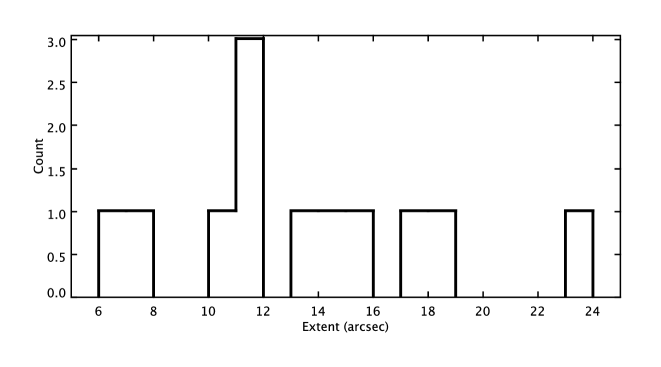
The extent parameter found for the sources ranges from 62 to 2303 (see Fig. 7). The brightest source (N 1 795), which has the highest likelihood of extension and the second largest extent, was identified from its X-ray properties as a galaxy cluster located behind M~31 (Kotov et al. 2006). The iron emission lines in the X-ray spectrum yield a cluster redshift of . For further discussion see Sect. 9.2.
6 Variability between XMM-Newton observations
To examine the long-term time variability of each source, we determined the XID flux at the source position in each observation or at least an upper limit for the XID flux. The XID fluxes were used to derive the variability factor and the significance of variability (cf. Sect. 3.6).
The sources are taken from the XMM LP-total catalogue (Table 5). Table 8 contains all information necessary to examine time variability. Sources are only included in the table if they are observed at least twice. Column 1 gives the source number. Columns 2 and 3 contain the flux and the corresponding error in the (0.2–4.5) keV XID band. The hardness ratios and errors are given in columns 4 to 11. Column 12 gives the type of the source. All this information was taken from Table 5.
The subsequent 140 columns provide information related to individual observations in which the position of the source was observed. Column 13 gives the name of one of these observations, which we will call observation 1. The EPIC instruments contributing to the source detection in observation 1, are indicated by three characters in the “obs1_val” parameter (Col. 14, first character for PN, second MOS 1, third MOS 2), each one being either a “T” if the source is inside the FoV, or “F” if it lies outside the FoV. Then the count rate and error (15,16) and flux and error (17,18) in the (0.2–4.5) keV XID band, and hardness ratios and error (19–26) of observation 1 are given. Corresponding information is given for the remaining observations which cover the position of the source: obs. 2 (cols. 27–40), obs. 3 (41–54), obs. 4 (55–68), obs. 5 (69–82), obs. 6 (83–96), obs. 7 (97–110), obs. 8 (111–124), obs. 9 (125–138), obs. 10 (139–152). Whether the columns corresponding to obs. 3 – obs. 10 are filled in or not, depends on the number of observations in which the source has been covered in the combined EPIC FoV. This number is indicated in column 153. The maximum significance of variation and the maximum flux ratio (fvar_max) are given in columns 154 and 155. As described in Sect. 3.6, only detections with a significance greater than 3 were used, otherwise the 3 upper limit was adopted. Column 156 indicates the number of observations that provide only an upper limit. The maximum flux (fmax) and its error are given in columns 157 and 158.
In a few cases a maximum flux value could not be derived, because each observation only yielded an upper limit. There can be two reasons for this: The first reason is that faint sources detected in merged observations may not be detected in the individual observations at the 3 limit. The second reason is that in cases where the significance of detection was not much above the 3 limit, it can become smaller than the 3 limit when the source position is fixed to the adopted final mean value from all observations.
| Source | fvar | svar | fmax‡ | efmax‡ | class+ | Comment† |
|---|---|---|---|---|---|---|
| 966 | 1.63 | 49.01 | 46.73 | 0.59 | XRB | 1(sv,z), 2, 10(v), 12(v), 13, 14, 20, 22(v), 25(LMXB), 27, 28(1.56) |
| 877 | 3.13 | 49.13 | 16.06 | 0.20 | hard | 1(sv), 2, 10(v), 12(v), 13, 14, 20(v), 22(v), 27, 28(3.05) |
| 745 | 2.43 | 26.89 | 12.65 | 0.18 | AGN | 13, 14 |
| 1 157 | 1.32 | 11.10 | 9.87 | 0.25 | GlC | 1(sv), 2, 5, 10, 12, 13, 14, 20, 21, 22(v), 27, 28(1.37) |
| 1 060 | 2.13 | 30.00 | 9.04 | 0.14 | XRB | 1(sv), 2, 10, 12, 13, 14, 20(v, NS-LMXB), 22(v), 27 |
| 1 171 | 4.14 | 18.86 | 9.02 | 0.41 | GlC | 1(d,sv), 2(t, 53.4), 5, 10, 12, 13, 14, 16, 20, 22, 27, 28(2.47) |
| 1 116 | 3.76 | 51.98 | 8.16 | 0.10 | GlC | 1(sv), 2(t, 58.6), 3(t, 33), 5, 10, 12, 13, 14, 16, 20, 21, 22(v,t), 27 |
Notes:
: maximum XID flux and error in units of 1 erg cm-2 s-1 or maximum absorbed 0.2–4.5 keV luminosity and error in units of 7.3 erg s-1
: class according to Table 6
: for comment column see Table LABEL:Tab:varlist
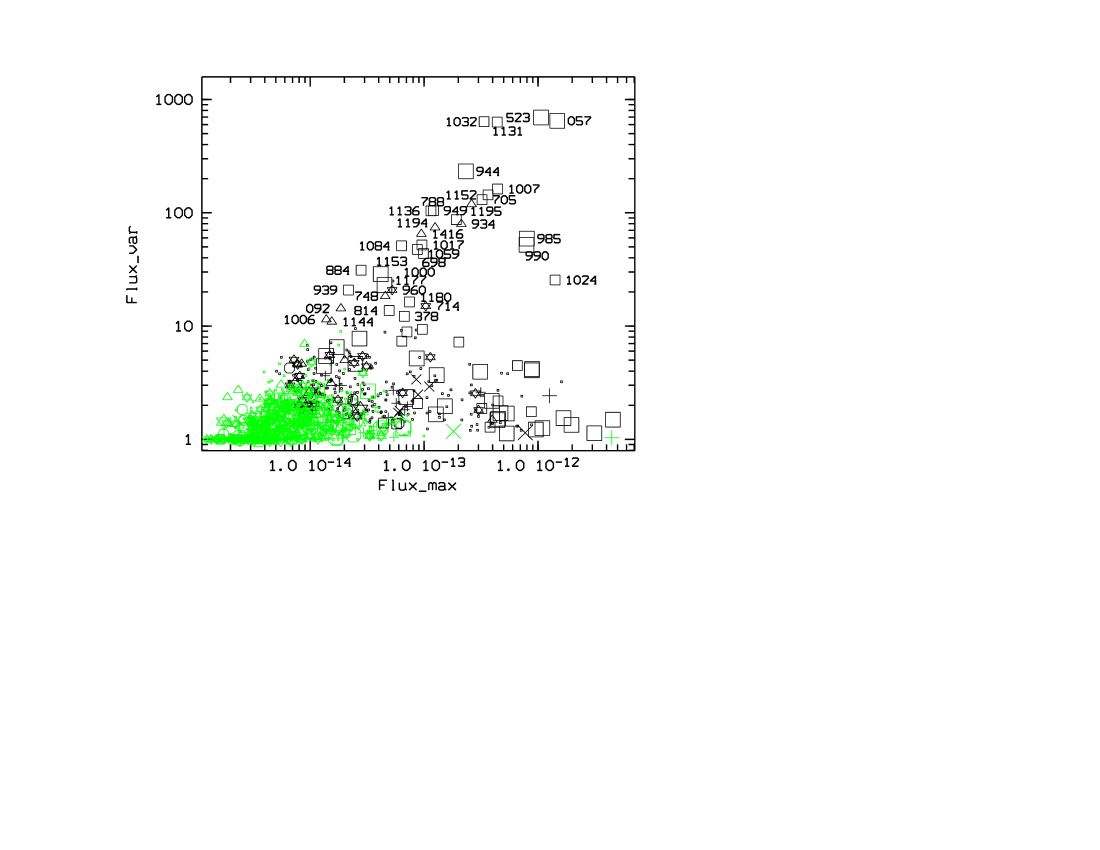
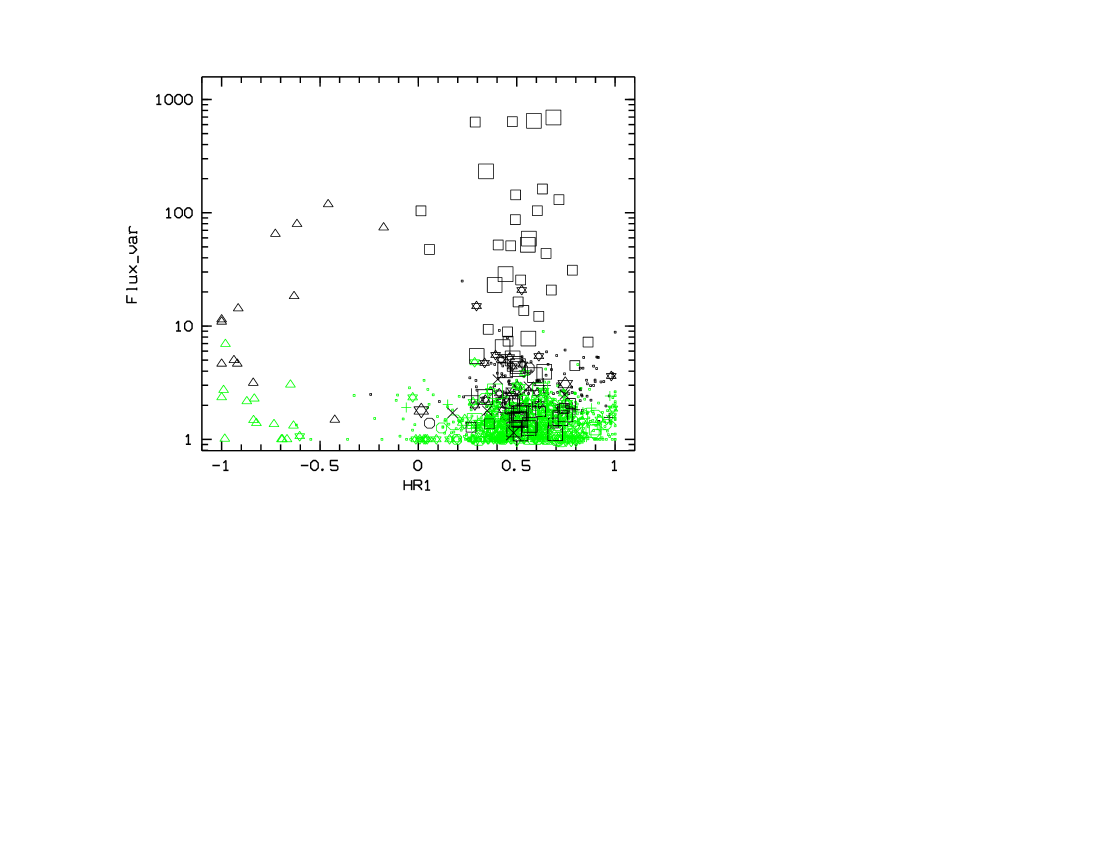
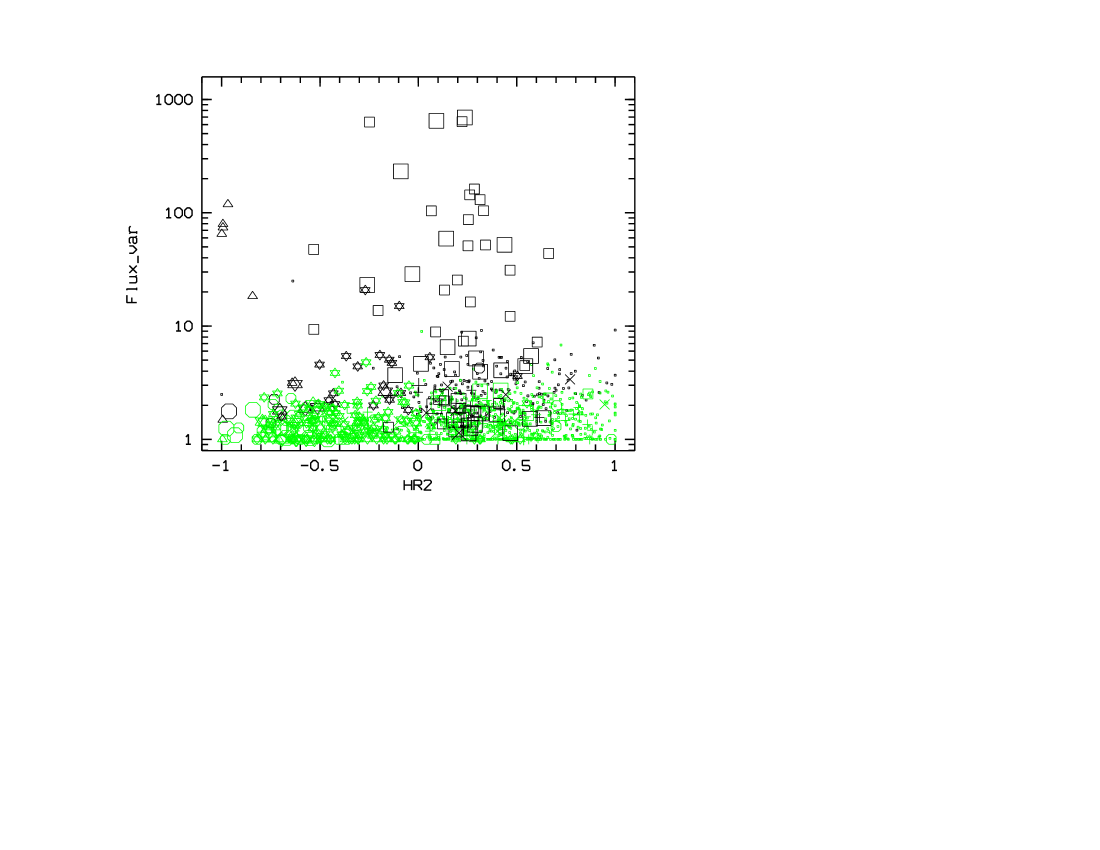
Figure 8 shows the variability factor plotted versus maximum detected XID flux. Apart from XRBs, or XRBs in GlCs, or candidates of these source classes, which were selected based on their variability, there are a few SSS candidates showing pronounced temporal variability. The sources classified or identified as AGN, background galaxies or galaxy clusters all show . Most of the foreground stars show .
Out of the 1 407 examined sources, we found 317 sources with a variability significance , i. e. 182 more than reported in SPH2008. For bright sources it is much easier to detect variability than for faint sources, because the difference between the maximum observed flux and the detection limit is larger. Therefore the significance of the variability declines with decreasing flux. This is illustrated by the distribution of the sources marked in green in Fig. 8.
Table LABEL:Tab:varlist lists all sources with a variability factor larger than five. There are 69 such sources (34 in addition to SPH2008). The sources are sorted in descending order with respect to their variability factors. Table LABEL:Tab:varlist gives the source number (Col. 1), maxima of flux variability (2) and maxima of the significance parameter (3). The next columns (4, 5) indicate the maximum observed flux and its error. Column 6 contains the class of the source. Sources with that were not already classified as SSS or foreground stars, were classified as XRB.
Time variability can also be helpful to verify a SNR candidate classification. If there is significant variability, the SNR classification must be rejected, and if an optical counterpart is detected, the source has to be re-classified as foreground star candidate. Column 7 contains references to the individual sources in the literature. In some cases the reference provides information on the temporal behaviour and a more precise classification (see brackets). The numbers given in connection with Voss & Gilfanov (2007) and Williams et al. (2006b) are the variability factors obtained in these papers from Chandra data. From the 69 sources of Table LABEL:Tab:varlist, ten show a flux variability larger than 100. With a flux variability factor source N 523 is the most variable source in our sample. Source N 57 has the largest significance of variability, with a value of . The variability significance is below 10 for just 33 sources, 15 of which show significance values below 5. Thirty-five of the variable sources are classified as XRBs or XRB candidates, and eight of them are located in globular clusters. Nine of the variable sources are SSS candidates, while six variable sources are classified as foreground stars and foreground star candidates.
Table 10 lists all “bright” sources with a maximum flux larger than 8 erg cm-2 s-1 and a flux variability smaller than five (the description of the columns is the same as in Table LABEL:Tab:varlist). All seven sources listed in Table 10 (three in addition to SPH2008) have a significance of variability . Apart from two sources, they are XRBs (three in globular clusters) or XRB candidates. The most luminous source in our sample is source N 966 with an absorbed 0.2–4.5 keV luminosity of erg s-1 at maximum.
Figure 9 shows the relationship between the variability factor and the hardness ratios HR1 and HR2, respectively. The hardness ratios are taken from Table 5. The HR1 plot shows that the sample of highly variable sources includes SSS and XRB candidates, which occupy two distinct regions in this plot (see also Haberl & Pietsch 1999, for the LMC). The SSSs marked by triangles, appear on the left hand side, while the XRBs or XRB candidates have much harder spectra, and appear on the right. It seems that foreground stars, SSSs and XRBs can be separated, on the HR2 diagram, although there is some overlap between foreground stars and XRBs.
7 Cross-correlations with other M~31 X-ray catalogues
Cross-correlations were determined by applying Eq. 4 to the sources of the XMM LP-total catalogue and to sources reported in earlier X-ray catalogues. The list of X-ray catalogues used is given in Table 4.
7.1 Previous XMM-Newton catalogues
Previous source lists based on archival XMM-Newton observations were presented in Osborne et al. (2001), PFH2005, Orio (2006), SPH2008, and SBK2009. Of these four studies, PFH2005 covers the largest area of M~31. Table 11 lists all sources from previous XMM-Newton studies that are not detected in the present investigation.
| PFH2005 856 sources | |
|---|---|
| 103 not detected | |
| 6 not detected, LH100: | 327 (SNR,LH2140.0), 384 (XRB,667.0), 332 (SNR,654.0), |
| 316 (SNR,259.0), 312 (SNR,241.0), 281(hard,160.0) | |
| 10 not detected, 20LH50: | 75 (SSS), 423 (fg Star), 120 (hard), 505 (hard), |
| 220 (SNR), 304 (fg Star), 819 (hard), 799 (SSS), 413 (SNR), 830 (hard) | |
| 14 not detected, 15LH20: | 427(hard), 734 (hard), 424 (hard), 518 (SSS), |
| 232 (hard), 339 (hard), 446 (SSS), 219 (fg Star), 567 (hard), 256 (fg Star), | |
| 356 (hard), 248 (hard), 160 (hard), 399 () | |
| 21 not detected, 10LH15: | 375 (hard), 17 (hard), 195 (hard), 417 (SNR), |
| 783 (hard), 803 (hard), 829 (hard), 135 (hard), 151 (hard), 131 (hard), | |
| 426 (hard), 593 (fg Star), 526 (hard), 250 (hard), 62 (hard), 67 (hard), | |
| 188 (hard), 186 (AGN), 510 (hard), 529 (hard), 754 (hard) | |
| 52 not detected, LH10: | 599 (hard), 439 (hard), 809 (hard), 14 (SNR), 743 (hard), |
| 433 (hard), 5 (), 210 (hard), 97 (hard), 708 (hard), 476 (), 534 (hard), 501 (), | |
| 170 (hard), 146 (SNR), 769 (), 838 (hard), 571 (hard), 816 (hard, 554 (), 627 (hard), | |
| 464 (fg Star), 811 (hard), 655 (hard), 184 (hard), 447 (hard), 380 (hard), | |
| 566 (hard), 137 (fg Star), 63 (), 48 (), 152 (fg Star), 291 (hard), 559 (hard), | |
| 102 (hard), 740 (hard), 540 (fg Star), 240 (hard), 485 (), 668 (hard), 44 (), | |
| 560 (hard), 836 (hard), 436 (hard), 484 (fg Star), 216 (hard), 362 (hard), 527 (), 179 (hard), | |
| 834 (hard), 86 (hard), 455 () | |
| SPH2008 39 sources | |
| 15 not detected | |
| 3 not detected, 50LH100: | 874 (SNR,LH85.5), 895 (hard,75.9), 882 ( ,56.4) |
| 6 not detected, 10LH50: | 869 (), 885 (SNR), 863 (hard), 875 (SSS), 893 (hard), 866 (hard) |
| 6 not detected, LH10: | 870 (SNR), 891 (hard), 889 (hard), 872 (SNR), 867 (hard), 862 (SNR) |
| SBK2009 335 sources | |
| 31 not detected | |
| 4 (hard), 18 (hard), 29 (hard), 32 (hard), 34 (hard), 45 (SSS), 67 (hard), | |
| 102 (hard), 106 (hard), 117 (hard), 149 (hard), 152 (hard), 179 (hard), | |
| 183 (hard), 184 (hard), 188 (hard), 191 (hard), 192 (AGN), 202 (hard), | |
| 204 (fg star), 217 (hard), 249 (hard), 250 (hard), 260 (hard), 274 (hard), | |
| 279 (hard), 285 (hard), 295 (hard), 306 (hard), 325 (hard), 333 (hard) | |
In the ten observations covering the major axis, and a field in the halo of M~31, PFH2005 detected 856 X-ray sources with a detection likelihood threshold of 7 (cf. Sect. 3.3). Of these 856 sources, only 753 sources are also present in the XMM LP-total catalogue, i. e. 103 sources of PFH2005 were not detected. This can be due to: the search strategy; the parameter settings used in the emldetect run; the determination of the extent of a source for the XMM LP-total catalogue; the more severe screening for GTIs for the XMM LP-total catalogue, which led to shorter final exposure times; the use of the epreject task and last but not least due to the SAS versions and calibration files applied. The search strategy of PFH2005 was optimised to detect sources located close to each other in crowded fields. This point especially explains the non-detection of the bright PFH2005 sources [PFH2005] 281, 312, 316, 327, 332, 384 () in the present study, as four of them ([PFH2005] 312, 316, 327, 332) are located in the innermost central region of M~31 where source detection is complicated by the bright diffuse X-ray emission, while [PFH2005] 281 and 384 lie in the immediate vicinity of two bright sources ([PFH2005] 280 and 381 at distances of 7.7′′and 5.5′′, respectively). The changes in the SAS versions and the GTIs, in particular, affect sources with small detection likelihoods ().
The improvements in the SAS detection tools and calibration files should reduce the number of spurious detections, which increase with decreasing detection likelihood. However, this does not necessarily imply that all undetected sources with of PFH2005 are spurious detections. The changes in the SAS versions, calibration files and GTIs do not only affect the source detection tasks, but also can cause changes in the background images. These changes may increase the assumed background value at the position of a source, which would result in a lower detection likelihood. Going from mlmin = 7 to mlmin = 6, but leaving everything else unchanged, we detected an additional nine sources of PFH2005. One of the previously undetected sources ([PFH2005] 75) was classified as SSS, but correlates with blocks of pixels with enhanced low energy signal in the PN offset map and was corrected by epreject. Another source classified as SSS ([PFH2005] 799) is only detected in the MOS 1 camera, but not in MOS 2. From an examination by eye, it seems that source [PFH2005] 799 is the detection of some noisy pixels at the rim of the MOS 1 CCD 6 and not a real X-ray source.
SPH2008 extended the source catalogue of PFH2005 by re-analysing the data of the central region of M~31 and also including data of monitoring observations of LMXB RX J0042.6+4115. Of the 39 new sources presented in SPH2008, 24 are also listed in the XMM LP-total catalogue, i. e. 15 sources of SPH2008 were not detected. Differences between the two studies include the detection likelihood thresholds used for eboxdetect (SPH2008: likemin=5) and emldetect (SPH2008: mlmin=6), the lower limit for the likelihood of extention (SPH2008: dmlextmin = 4; XMM LP-total: 15), the screening for GTIs, the use of the epreject task and the SAS versions and calibration files used. Concerning the GTIs, images, background images and exposure maps SPH2008 followed the same procedures as in PFH2005. The arguments given above are therefore also valid here. From the 14 undetected sources, three sources were detected in SPH2008 with mlmin 7. One source ([SPH2008] 882) was added by hand to the final source list, as SPH2008 could not find any reason why emldetect did not automatically find it. The two extended sources ([SPH2008] 863, 869) detected with extent likelihoods between 4.7 and 5.1 in SPH2008, are neither detected as extended nor as pointlike sources in the present study, where the extent likelihood has to be larger than 15.
SBK2009 re-analysed the XMM-Newton observations located along the major axis of M~31, ignoring all observations pointing to the centre of the galaxy. They used a detection likelihood threshold of ten. Of the 335 sources detected by SBK2009, 304 sources are also contained in the XMM LP-total catalogue, i. e. 31 sources are not detected. Of the 304 re-detected sources, two ([SBK2009] 298, 233) are found with a detection likelihood below ten. Of the 31 undetected sources, 27 were also not detected in PFH2005. The remaining four sources correlate with PFH2005 sources, which were not detected in the present study. SBK2009 state that they find 34 sources not present in the source catalogue of PFH2005. A possible reason for this may be that SBK2009 used different energy bands for source detection. They also had five bands, but they combined bands 2 and 3 from PFH2005 into one band in the range 0.5–2 keV, and on the other hand they split band 5 of PFH2005 into two bands from 4.5–7 keV and from 7–12 keV, respectively. This might also explain why most of the additional found sources were classified as hard.
Orio (2006) addressed the population of SSSs and QSSs based on the same archival observations as PFH2005. Orio (2006) detected 15 SSSs, 18 QSSs and 10 SNRs of which one ([O2006] Table 4, Src. 3) is also listed as an SSS ([O2006] Table 2, Src. 13). Of these sources two SSSs, four QSSs and two SNRs (among them is the source [O2006] Table 4, Src. 3) are not contained in the XMM LP-total catalogue. These seven sources are also not present in the PFH2005 catalogue.
The nine bright variable sources from Osborne et al. (2001) were all detected.
7.2 Chandra catalogues
Details of the comparison between the XMM LP-total catalogue and the different Chandra catalogues can be found in Table 12. Here, we only give a few general remarks. A non-negligible number of Chandra sources not reported in the XMM LP-total catalogue have already been classified as transient or variable sources. Thus, it is not surprising that these sources were not detected in the XMM-Newton observations (parts of: Voss & Gilfanov 2007; Williams et al. 2006b, DKG2004). One Chandra source (n1-66) lies outside the field of M~31 covered by the XMM-Newton observations. For the innermost central region of M~31, the point spread function of XMM-Newton causes source confusion and therefore only Chandra observations are able to resolve the individual sources, especially if they are faint compared to the diffuse emission or nearby bright sources (Kong et al. 2002b; Kaaret 2002; Williams et al. 2004; Di Stefano et al. 2004; Williams et al. 2006b; Voss & Gilfanov 2007). This explains why a certain number of these sources are not detected in XMM-Newton observations.
| Kong et al. (2002b) 204 sources | |
| 58 not detected | |
| 5 transient: | r3-46,r3-43,r2-28,r1-23,r1-19 |
| 20 variable: | r3-53,r3-77,r3-106,r3-76,r2-52,r2-31,r2-23,r1-31,r2-20,r1-24,r1-28,r1-27,r1-33,r1-21,r1-20,r1-7,r2-15,r1-17,r1-16,r2-47 |
| 33 unclassified: | r3-102,r3-92,r3-51,r3-75,r3-91,r3-89,r3-101,r3-88,r2-44,r2-55,r2-54,r3-32,r2-53,r1-30,r3-99,r1-22,r1-26,r1-18,r3-26, |
| r2-41,r2-40,r3-71,r2-50,r2-49,r2-38,r3-97,r2-46,r3-12,r3-66,r3-104,r3-82,r3-5,r3-4 | |
| Kaaret (2002) 142 sources | |
| 26 not detected | |
| 3 transient: | J004217.0+411508,J004243.8+411604,J004245.9+411619 |
| 7 variable: | J004232.7+411311,J004242.0+411532,J004243.1+411640,J004244.3+411605,J004245.2+411611,J004245.5+411608, |
| J004248.6+411624 | |
| 16 unclassified: | J004207.3+410443,J004229.1+412857,J004239.5+411614,J004239.6+411700,J004242.5+411659,J004242.7+411503, |
| J004243.1+411604,J004244.2+411614,J004245.0+411523,J004246.1+411543,J004247.4+411507,J004249.1+411742, | |
| J004251.2+411639,J004252.3+411734,J004252.5+411328,J004318.5+410950 | |
| Williams et al. (2004) 166 sources | |
| 28 not detected | |
| 12 transient: | s1-79,s1-80,s1-82,r3-46,r2-28,r1-23,r1-19,r2-69,r1-28,r1-35,r1-34,n1-85 |
| 7 variable: | r2-31,r1-31,r1-24,r1-20,r1-7,r1-17,r1-16 |
| 9 unclassified: | s1-81,r2-68,s1-85,r1-30,r1-22,r1-26,r1-18,n1-77,n1-84 |
| Voss & Gilfanov (2007) 261 sources | |
| 104 not detected | |
| 11 transient: | 6,12,29,32,41,51,59,84,118,130,146 |
| 15 variable: | 3,5,8,9,18,22,24,27,44,63,92,96,99,149,169 |
| 78 unclassified: | 4,19,21,25,26,30,37,39,40,42,48,49,53,56,57,58,60,62,65,70,73,75,76,77,80,82,84,86,87,89,91,94,97,98,104,109,114, |
| 115,117,119,122,124,129,133,138,141,143,144,145,150,152,158,162,164,167,171,173,182,183,188,189,191,193,194, | |
| 197,202,205,206,210,213,217,219,220,225,256,257,263 | |
| Williams et al. (2006b) 45 sources | |
| 25 not detected | |
| 25 transient: | n1-26,n1-85,n1-86,n1-88,n1-89,r1-19,r1-23,r1-28,r1-34,r1-35,r2-28,r2-61,r2-62,r2-66,r2-69,r2-72,r3-43,r3-46,s1-18, |
| s1-27,s1-69,s1-79,s1-80,s1-82,s2-62 | |
| DKG2004 43 sources | |
| 15 not detected | |
| 9 transient: | s2-62,s1-27,s1-69,s1-18,n1-26,r2-62,r1-35,r2-61,r2-66 |
| 5 unclassified: | s2-27,s2-10,n1-29,n1-46,r2-54 |
| 1 not in FoV: | n1-66 |
| Di Stefano et al. (2002) 28 sources | |
| 2 not detcted | |
| 2 unclassified: | 17 ( r2-15), 28 ( r3-71) |
Notes:
Variability information (transient, variable) is taken from the papers. “Unclassified” denotes sources which are not indicated as transient or variable sources in the papers.
Of the 28 bright X-ray sources located in globular clusters (Di Stefano et al. 2002), two were not found in the XMM-Newton data (see Table 12). They are also not included in the source catalogue of PFH2005 and SPH2008. Hence, both objects are good candidates for being transient or at least highly variable sources (cf. Sect. 10.4.2). Another study of the globular cluster population of M~31 is presented by Trudolyubov & Priedhorsky (2004). Their work is based on XMM-Newton and Chandra data and contains 43 X-ray sources. Of these sources three were not found in the present study. One of them ([TP2004] 1) is located well outside the field of M~31 covered by the Deep XMM-Newton Survey181818The source was observed with XMM-Newton on 11 January 2001. Obs. id.: 0065770101. The second source ([TP2004] 21) correlates with r3-71, which is discussed above (see Di Stefano et al. (2002) in Table 12). The transient nature of the third source ([TP2004] 35), and the fact that it was not observed in any XMM-Newton observation taken before 2004 was already reported by Trudolyubov & Priedhorsky (2004). The source was first detected with XMM-Newton in the observation from 31 December 2006.
7.3 ROSAT catalogues
Of the 86 sources detected with ROSAT HRI in the central 34′ of M~31 (PFJ93), all but eight sources ([PFJ93] 1,2,31,33,40,48,63,85) are detected in the XMM-Newton observations. Six of these eight sources ([PFJ93] 1,2,31,33,63,85) have already been discussed in PFH2005 and classified as transients. Sources [PFJ93] 40 and 48 correlate with [PFH2005] 312 and 332, respectively, which are discussed in Sect. 7.1. In addition to these eight sources, PFH2005 did not detect source [PFJ93] 51. This source was detected in the XMM-Newton observations centred on RX J0042.6+4115 and was thus classified as a recurrent transient (see SPH2008).
In each of the two ROSAT PSPC surveys of M~31, 396 individual X-ray sources were detected (SHP97 and SHL2001). From the SHP97 catalogue 130 sources were not detected. Of these sources 48 are located outside the FoV of our XMM-Newton M~31 survey. From the SHL2001 catalogue, 93 sources are not detected, 60 of which lie outside the XMM-Newton FoV. For information on individual sources see Table 13.
| SHP97 396 sources | |
|---|---|
| 130 not detected | |
| 48 outside FoV: | 1,2,3,4,5,7,8,14,31,41,72,91,98,104,120,125,159,202,209,271,276,285,286,290,300,312,314, |
| 320,342,350,363,367,371,374,383,385,386,387,388,389,390,391,392,393,394,395,396 | |
| 1 transient: | 69 |
| 21 not detected, LH12: | 19,24,27,33,46,52,59,63,68,71,133,149,161,264,273,275,307,329,330,358,377 |
| 16 not detected, 12LH15: | 12,15,49,82,93,113,114,128,196,230,262,283,334,364,372,376 |
| 44 not detected, LH15: | 16(LH26.6),32(30.2),43(18.2),45(51.2),60(20.1),66(36.2),67(4536.2),78(20.5),80(16.3),81(26.6), |
| 88(33.7),95(548.0),102(16.4),126(217.3),141(843.3),145(46.9),146(673.7),166(17.4),167(90.0), | |
| 171(54.3),182(454.4),186(39.8),190(113.0),191(54.5),192(54.3),203(103.3),214(400.2),215(251.0), | |
| 232(104.4),245(26.0),260(54.6),263(38.1),265(24.6),268(54.3),270(40.4),277(15.6),309(81.8), | |
| 319(23.4),331(19.5),335(51.2),340(27.5),341(28.1),365(22.4),373(69.5) | |
| SHL2001 396 sources | |
| 93 not detected | |
| 60 outside FoV: | 1,2,3,4,5,6,7,8,9,10,11,12,14,15,16,21,22,32,39,58,67,69,75,77,81,83,85,90,93,125,141,146, |
| 160,164,192,202,243,260,282,296,298,302,325,326,328,355,371,372,378,379,383,388,389,390, | |
| 391,392,393,394,395,396 | |
| 4 not detected, LH12: | 62,96,238,269 |
| 2 not detected, 12LH15: | 231,361 |
| 27 not detected, LH15: | 51(LH28.4),104(901.2),121(94.1),126(46.2),143(34.7),168(131.9),171(43.0),173(317.8),190(215.8), |
| 207(98.0),208(298.8),226(73.1),230(75.6),232(1165.6),240(218.4),246(39.9),248(219.6),256(60.0), | |
| 267(22.2),271(52.8), 322(2703.3),324(147.7),344(40.7),356(15.3),365(19.0),380(17.4),384(15.8) | |
Forty-four (out of 302) sources from SHP97 and 27 (out of 293) sources from SHL2001, have ROSAT detection likelihoods larger than 15, but are not listed in the XMM LP-total catalogue. These sources have to be regarded as transient or at least highly variable.
7.4 Einstein catalogue
The list of Einstein X-ray sources in the field of M~31 reported by TF91 contains 108 sources, with 81 sources taken from the Einstein HRI data with an assumed positional error of 3′′ (reported by Crampton et al. 1984), and 27 sources based on Einstein IPC data with a 45′′ positional error. Applying the above mentioned correlation procedure to the Einstein HRI sources, 64 of these sources are also detected in this work and listed in the XMM LP-total catalogue, i. e. 17 sources are not detected ([TF91] 29, 31, 35, 39, 40, 43, 46, 50, 53, 54, 65, 66, 72, 75, 78, 93, 96). For the Einstein IPC sources only the 1 positional error was used to search for counterparts among the XMM-Newton sources. Of the 27 Einstein IPC sources six remain without a counterpart in our catalogue ([TF91] 15, 99, 100, 106, 107, 108), of which [TF91] 15 and 108 are located outside the field of M~31 covered by the XMM LP-total catalogue. Sources [TF91] 50 and 54 correlate with [PFH2005] 312 and 316, respectively. Both sources were already discussed in Sect. 7.1. Apart from [TF91] 106, which is suggested as a possible faint transient by SHL2001, the remaining 18 sources are also not detected by PFH2005. They classified those sources as transient.
8 Cross-correlations with catalogues at other wavelengths
The XMM LP-total catalogue was correlated with the catalogues and public data bases given in Sect. 3.8. Two sources (from the XMM LP-total and from the reference catalogues) were be considered as correlating, if their positions matched within the uncertainty (see Eq. 4).
However, the correlation of an X-ray source with a source from the reference catalogue does not necessarily imply that the two sources are counterparts. To confirm this, additional information is needed, like corresponding temporal variability of both sources or corresponding spectral properties. We should also take into account the possibility that the counterpart of the examined X-ray source is not even listed in the reference catalogue used (due to faintness for example).
The whole correlation process will get even more challenging if an X-ray source correlates with more than one source from the reference catalogue. In this case we need a method to decide which of the correlating sources is the most likely to correspond to the X-ray source in question. Therefore, the method used should indicate how likely the correlation is with each one of the sources from the reference catalogue. Based on these likelihoods one can define criteria to accept a source from the reference catalogue as being the most likely source to correspond to the X-ray source.
The simplest method uses the spatial distance between the X-ray source and the reference sources to derive the likelihoods. In other words, the source from the reference catalogue that is located closest to the X-ray source is regarded as the most likely source corresponding to the X-ray source.
An improved method is a “likelihood ratio” technique, were an additional source property (e. g. an optical magnitude in deep field studies) is used to strengthen the correlation selection process. This technique was applied successfully to deep fields to find optical counterparts of X-ray sources (e. g. Brusa et al. 2007). A drawback of this method is that one a priori has to know the expected probability distribution of the optical magnitudes of the sources belonging to the studied object. In our case, this means that we have to know the distribution function for all optical sources of M~31 that can have X-ray counterparts, without including foreground and background sources. Apart from the fact that such distribution functions are unknown, an additional challenge would be the time dependence of the magnitude of the optical sources (e. g. of novae) and of the connection between optical and X-ray sources (e. g. optical novae and SSSs). Therefore it is not possible to apply this “likelihood ratio” technique to the sources in the XMM LP-total survey. The whole correlation selection process becomes even more challenging if more than one reference catalogue is used.
To be able to take all available information into account, we decided not to automate the selection process, but to select the class and most likely correlations for each source by hand (as it was done e. g. in PFH2005). Therefore the source classification, and thus the correlation selection process, is based on the cross correlations between the different reference catalogues, on the X-ray properties (hardness ratios, extent and time variability), and on the criteria given in Table 6. For reasons of completeness we give for each X-ray source the number of correlations found in the USNO-B1, 2MASS and LGGS catalogues in Table 5. The caveat of this method is that it cannot quantify the probability of the individual correlations.
9 Foreground stars and background objects
9.1 Foreground stars
X-ray emission has been detected from many late-type – spectral types F, G, K, and M – stars, as well as from hot OB stars (see review by Schmitt 2000). Hence, X-ray observations of nearby galaxies also reveal a significant fraction of Galactic stars. With typical absorption-corrected luminosities of erg s-1, single stars in other galaxies are too faint to be detected with present instruments. However, concentrations of stars can be detected, but not resolved.
Foreground stars (fg Stars) are a class of X-ray sources which are homogeneously distributed over the field of M~31 (Fig. 10). The good positional accuracy of XMM-Newton and the available catalogues USNO-B1, 2MASS and LGGS allow us to efficiently select this type of source. The selection criteria are given in Table 6. The optical follow-up observations of Hatzidimitriou et al. (2006) and Bonfini et al. (2009) have confirmed the foreground star nature of bright foreground star candidates selected in PFH2005, based on the same selection criteria as used in this paper. Somewhat different criteria were applied for very red foreground stars, with an LGGS colour or USNO-B1 colour . These are classified as foreground star candidates, if and . A misclassification of symbiotic systems in M~31 as foreground objects by this criterion can be excluded, as symbiotic systems typically have X-ray luminosities below erg s-1, which is more than a factor 100 below the detection limit of our survey.
If the foreground star candidate lies within the field covered by the LGGS we checked its presence in the LGGS images (as the LGGS catalogue itself does not list bright stars, because of saturation problems). Otherwise DSS2 images were used. Correlations with bright optical sources from the USNO-B1 catalogue, with an in the range expected for foreground stars, that were not visible in the optical images were rejected as spurious. We found 223 foreground star candidates. Fourty sources were identified as foreground stars, either because they are listed in the globular cluster catalogues as spectroscopically confirmed foreground stars or because they have a spectral type assigned to them in the literature (Bonfini et al. 2009; Hatzidimitriou et al. 2006, SIMBAD).
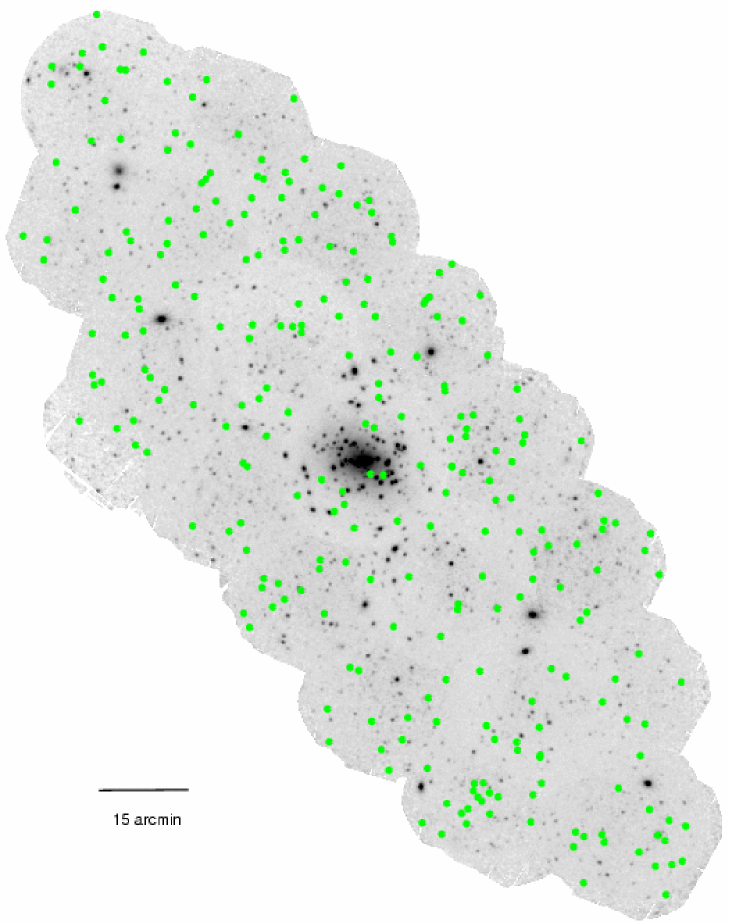
Two of the foreground star candidates close to the centre of M~31 (N 826, N 1 110) have no entry in the USNO-B1 and LGGS catalogues, and one has no entry in the USNO-B1 R2 and B2 columns (N 976). However, they are clearly visible on LGGS images, they are 2MASS sources and they fulfil the X-ray hardness ratio selection criteria. Therefore, we also classify them as foreground stars.
The following 19 sources were selected as very red foreground star candidates: N 54, N 118, N 384, N 391, N 393, N 585, N 646, N 651, N 711, N 1 038, N 1 119, N 1 330, N 1 396, N 1 429, N 1 506, N 1 605, N 1 695, N 1 713 and N 1 747. A further 10 sources (N 210, N 269, N 278, N 310, N 484, N 714, N 978, N 1 591, N 1 908 and N 1 930) fulfil the hardness ratio criteria, but violate the criteria and are therefore marked as “foreground star candidates” in the comment column of Table 5.


Six sources (N 473, N 780, N 1 551, N 1 585, N 1 676, N 1 742), classified as foreground star candidates, have X-ray light curves that in a binning of 1 000 s showed flares (see Fig. 11). These observations strengthen the foreground star classification. A seventh source (N 714) is classified as a foreground star candidate, since its hardness ratios and its ratio in the quiescent state fulfil the selection criteria of foreground star candidates. In addition, the source shows a flare throughout observation ss3. Hence, the ratio for this observation, in which the source is brightest, is too high to be consistent with the range of values expected for foreground stars.
| N | J mag | H mag | K mag | SpT∗ | err+ |
|---|---|---|---|---|---|
| 473 | 12.984 | 12.681 | 12.558 | K0 | 0.4 |
| 714 | 14.310 | 13.618 | 13.458 | M0 | 0.2 |
| 780 | 14.251 | 13.595 | 13.351 | M3 | 0.1 |
| 1551 | 12.666 | 12.009 | 11.806 | M2 | 0.1 |
| 1585 | 13.488 | 12.899 | 12.650 | M2 | 0.1 |
| 1676 | 10.460 | 9.878 | 9.798 | K1 | 0.2 |
| 1742 | 13.722 | 13.138 | 12.896 | M1 | 0.2 |
Notes:
: spectral type
: error (in subtypes)
Table 14 gives the J, H and K magnitudes taken from the 2MASS catalogue for each of the six flaring foreground stars. Using the standard calibration of spectral types for dwarf stars based on their near infrared colours (from the fourth edition of Allen’s astrophysical quantities, edt. A.Cox, p.151) we derived the spectral classification for the objects, using both H-K and J-K. The spectral types (and ”error”) we give in Table 14 are derived from averaging the two classes (derived from the two colours). The spectral types are entirely consistent with those expected for flare stars (usually K and M types).
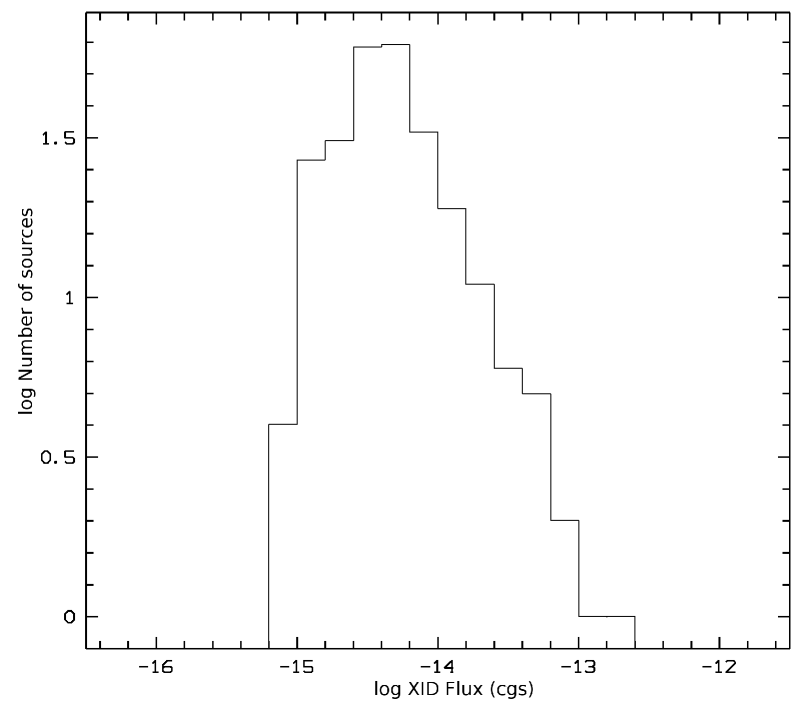
Figure 12 shows the XID flux distribution for foreground stars and foreground star candidates, which ranges from 6.9 erg cm-2 s-1 to 2.0 erg cm-2 s-1. Most of the foreground stars and candidates (257 sources) have fluxes below 5 erg cm-2 s-1.
9.1.1 Comparing XMM-Newton, Chandra and ROSAT catalogues
In the combined ROSAT PSPC survey (SHP97, SHL2001) 55 sources were classified as foreground stars. Of these, 14 sources remain without counterparts in the present XMM-Newton survey. Five of these 14 sources are located outside the field observed with XMM-Newton. Forty-one ROSAT foreground star candidates have counterparts in the XMM LP-total catalogue. Of these counterparts, 16 were classified as foreground star candidates and four were identified as foreground stars (spectral type from Bonfini et al. 2009; Hatzidimitriou et al. 2006, or SIMBAD). In addition 12 sources were listed as hard, two as AGN candidates and one as a globular cluster candidate in the XMM LP-total catalogue. The counterparts of three ROSAT sources remain without classification in the XMM LP-total catalogue.
Another three ROSAT sources have more than one counterpart in the XMM-Newton data. Source [SHP97] 109 correlates with sources N 597, N 604, N 606, and N 645. The former three are classified as hard, while source N 645 is classified as a foreground star candidate. However source N 645 has the largest distance from the position of [SHP97] 109 compared to the other three XMM-Newton counterparts. Furthermore, this source had a flux below the ROSAT detection threshold (about a factor 2.6) in the XMM-Newton observations and is about a factor 3–34 fainter than the three other possible XMM-Newton counterparts. Thus it is very unlikely that [SHP97] 109 represents the X-ray emission of a foreground star.
Source [SHL2001] 156 has two XMM-Newton counterparts and is discussed in Sect. 10.1.3. The third source ([SHL2001] 374) correlates with sources N 1 922 and N 1 924. The two XMM-Newton sources are classified as hard and as a foreground star candidate, respectively. In the source catalogue of SHL2001 source [SHP97] 369 is listed as the counterpart of [SHL2001] 374. The source in the first ROSAT survey has a smaller positional error and only correlates with source N 1 924. Although this seems to indicate that source N 1 924 is the counterpart of [SHL2001] 374, we cannot exclude the possibility that [SHL2001] 374 is a blend of both XMM-Newton sources, as these two sources have similar luminosities in the XMM-Newton observations.
Kong et al. (2002b) classified four sources as foreground stars. For two sources (N 960r2-42 and N 976r3-33) the classification is confirmed by our study. The third source (N 1000r2-19) remained without classification in the XMM LP-total catalogue, as it is too soft to be classified as hard and the optical counterpart found in the LGGS catalogue does not fulfil the criteria. The fourth source (r2-46) was not detected in the XMM-Newton observations.
The foreground star classification of three sources (s1-74, s1-45, n1-82) in Williams et al. (2004) is confirmed by the XMM LP-total study (N 289, N 603, N 1 449). For source N 289 the spectral type F0 was determined (Hatzidimitriou et al. 2006).
The source list of DKG2004 contains six sources (s2-46, s2-29, s2-37, s1-45, s1-20, r3-122) that are classified as foreground stars. All six sources are confirmed as foreground star candidates by our XMM-Newton study (cf. Table 5). For source N 696 (s1-20) Hatzidimitriou et al. (2006) obtained the spectral type G0.
Of the four sources listed as foreground stars in Voss & Gilfanov (2007) only one source (N 936 [VG2007] 168) was confirmed as a foreground star, based on the entry in the RBC V3.5 and Caldwell et al. (2009). The second source (N 1 118[VG2007] 180) is listed in the RBC V3.5 and Caldwell et al. (2009) as a globular cluster. The third source (N 829[VG2007] 181) does not have a counterpart in the USNO-B1, 2MASS or LGGS catalogues, nor does it fulfil the hardness ratio criteria for foreground stars. Hence, the source is classified as hard. The fourth source ([VG2007] 81) is not spatially resolved from its neighbouring source [VG2007] 79 in our XMM-Newton observations (source N 1 078). Hence source N 1 078 is classified as hard.
9.2 Galaxies, galaxy clusters and AGN
The majority of background sources belong to the class of active galactic nuclei (AGN). This was shown by the recent deepest available surveys of the X-ray background (Mushotzky et al. 2000; Hasinger et al. 2001; Brandt & Hasinger 2005). The class of AGN is divided into many sub-sets. The common factor in all the sub-sets is that their emission emanates from a small, spatially unresolved galactic core. The small size of the emitting region is implied by the X-ray flux variability observed in many AGN, which is on time scales as short as several minutes (to years). The observed X-ray luminosities range from to erg s-1, sometimes even exceeding erg s-1. Although AGN show many different properties, like the amount of radio emission or the emission line strengths and widths, they are believed to be only different facets of one underlying basic phenomenon (cf. Urry & Padovani 1995): the accretion of galactic matter onto a supermassive black hole ( M⊙) in the centre of the galaxy.
It is difficult and, to some extent, arbitrary to distinguish between active and normal galaxies, since most galaxies are believed to host a black hole at the position of their kinetic centre (Bender et al. 2005). In normal galaxies the accretion rate to the central supermassive BH is so low, that only weak activity can be detected – if at all. The overall thermal emission of the nuclear region is due to bremsstrahlung from hot gas. The total X-ray luminosity of a normal galaxy can reach some erg s-1, at most. It consists of diffuse emission and emission of unresolved individual sources.
Galaxy clusters (GCls) are by far the largest and most massive virialised objects in the Universe. Their masses lie in the range of – M⊙ and they have sizes of a few megaparsecs (Mpc). A mass-to-light ratio of M⊙/L⊙ indicates that galaxy clusters are clearly dominated by their dark matter content. Furthermore, galaxy clusters allow us to study the baryonic matter component, as they define the only large volumes in the Universe from which the majority of baryons emit detectable radiation. This baryonic gas, the hot intracluster medium (ICM), is extremely thin, with electron densities of –105 m-3, and fills the entire cluster volume. Owing to the plasma temperatures of –10 keV, the thermal ICM emission gives rise to X-ray luminosities of – erg s-1. Therefore galaxy clusters are the most X-ray luminous objects in the Universe next to AGN.
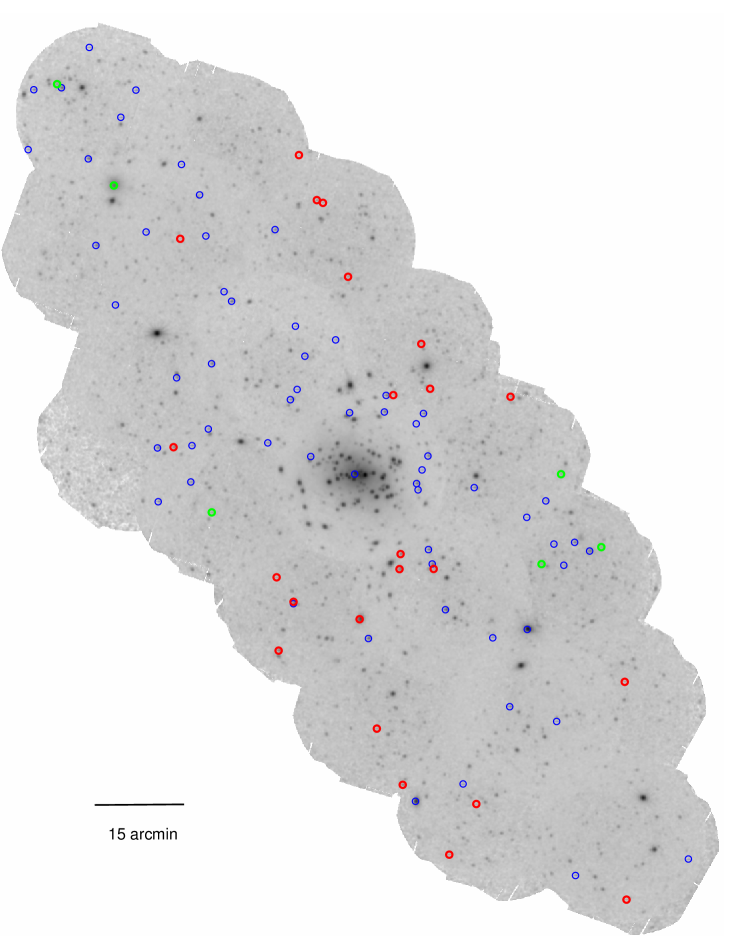
We identified four sources as background galaxies and 11 as AGN, and classified 19 galaxy and 49 AGN candidates. The classification is based on SIMBAD and NED correlations and correlations with sources listed as background objects in the globular cluster catalogues (RBC V3.5 and Caldwell et al. 2009). Sources are classified as AGN candidates, if they have a radio counterpart (NVSS; Braun 1990; Gelfand et al. 2004) with the additional condition of being neither a SNR nor a SNR candidate from X-ray hardness ratios, as well as not being listed as a “normal” background galaxy in Gelfand et al. (2004). Most AGN will be classified as hard ((HR2EHR2)0.2, see Table 6) because of their intrinsic power law component. Additional absorption in the line of sight by the interstellar medium of M~31 will lead to an even higher HR2. Only the few AGN with a dominant component in the measured flux below 1 keV may lead to a classification SNR or fg Star in our adapted scheme.
One (N 995) of the four identified galaxies is M 32. An overview of previous X-ray observations of this galaxy is given in PFH2005. They also discuss the fact that Chandra resolved the X-ray emission of M 32 into several distinct point sources (maximum separation of the three central Chandra sources 83). Although M 32 is located closer to the centre of the FoV in the observations of field SS1, than it was in the s1 observation used in PFH2005, XMM-Newton still detects only one source. The remaining three sources (N 88, N 403, N 718) are identified as galaxies, because they are listed as background galaxies in both the RBC V3.5 and Caldwell et al. (2009). For source N 403 (B 007) NED gives a redshift of (Kim et al. 2007).
Eleven X-ray sources are identified as AGN. The first one (N 363) correlates with a BL Lac object located behind M~31 (NED, see also PFH2005). The second source (N 745) correlates with a Seyfert 1 galaxy (5C 3.100), which has a redshift of (SIMBAD). The third source (N 1 559) correlates with a quasar (Sharov 21) that showed a single strong optical flare, during which its UV flux has increased by a factor of 20 (Meusinger et al. 2010). The remaining sources were spectroscopically confirmed (from our optical follow-up observations) to be AGN (D. Hatzidimitriou, private communication; and Hatzidimitriou et al. (2010) in prep.).
| Src ID | /1021 cm-2 | /keV | redshift | /dof |
|---|---|---|---|---|
| 141 | 78.5/53 | |||
| 252 | 56.4/151 | |||
| 304 | 50.9/57 | |||
| 1543 | 32.9/34 |
In Sect. 5.4 the 12 extended sources in the XMM LP-total catalogue were presented. Kotov et al. (2006) showed that the brightest of these sources (N 1795) is a galaxy cluster located at a redshift of . For the remaining 11 sources, X-ray spectra were created and fitted with the MEKAL model in XSPEC. Unfortunately, for most of the examined sources the spectral parameters (foreground absorption, temperature and redshift) are not very well constrained. Nevertheless four sources (N 141, N 252, N 304, N 1543) with temperatures in the range of –2 keV and proposed redshifts between 0.1 – 0.6 were found (Table 15). Inspection of optical images (DSS 2 images and if available LGGS images) revealed an agglomeration of optical sources at the positions of these four extended X-ray sources. Thus they are classified as galaxy cluster candidates.
Although, B242 (the optical counterpart of source N 304) is listed as a globular cluster candidate in the RBC3.5 catalogue, Caldwell et al. (2009) classified this source as a background object. Our findings from the X-rays favour the background object classification. Hence a globular cluster classification for this source seems to be excluded.
Source N 1 912 was already classified as a galaxy cluster candidate in PFH2005. The spectrum confirms this classification. The best fit parameters are cm-2, keV and redshift of .
A plot of the spatial distribution of the classified / identified background sources is given in Fig. 13, which shows that these sources are rather homogeneously distributed over the observed field. However, in the fields located along the major axis of M~31 we mainly see AGN, which are bright enough to be visible through M~31, while most of the galaxies and galaxy clusters are detected in the outer fields.
9.2.1 Comparing XMM-Newton, Chandra and ROSAT catalogues
Of the ten ROSAT PSPC survey sources classified as background galaxies one is located outside the field of the Deep XMM-Newton Survey. The remaining objects are confirmed to be background sources and are classified or identified as galaxies or AGN. The only case which is worth discussing in more detail is the source pair [SHP97] 246 and [SHL2001] 252. From the XMM-Newton observations it is evident that this source pair is not one source, as indicated in the combined ROSAT PSPC source catalogue (SHL2001), but consists of three individual sources (N 1 269, N 1 279 and N 1 280). [SHL2001] 252 correlates spatially with all three XMM-Newton sources, while [SHP97] 246 correlates only with source N 1 269, which is identified as a foreground star of type K2 (SIMBAD). The two other XMM-Newton counterparts of [SHL2001] 252 are classified as a galaxy candidate and an AGN candidate, respectively. In summary, [SHL2001] 252 is most likely a blend of both background sources and maybe even a blend of all three XMM-Newton sources, while [SHP97] 246 seems to be the X-ray counterpart of the foreground star mentioned above.
10 M 31 sources
10.1 Supersoft sources
Supersoft source (SSS) classification is assigned to sources showing extremely soft spectra with equivalent blackbody temperatures of 15–80 eV. The associated bolometric luminosities are in the range of – erg s-1 (Kahabka & van den Heuvel 1997).
Because of the phenomenological definition, this class is likely to include objects of several types. The favoured model for these sources is that they are close binary systems with a white dwarf (WD) primary, burning hydrogen on the surface (cf. Kahabka & van den Heuvel 1997). Close binary SSSs include post-outburst, recurrent, and classical novae, the hottest symbiotic stars, and other LMXBs containing a WD (cataclysmic variables, CVs). Symbiotic systems, which contain a WD in a wide binary system, may also be observed as SSSs (Kahabka & van den Heuvel 1997). Because matter that is burned can be retained by the WD, some SSS binaries may be progenitors of type-Ia supernovae (cf. van den Heuvel et al. 1992).
The XMM LP-total catalogue contains 30 SSS candidates that were selected on the basis of their hardness ratios (see Fig. 6 and Table 6).
10.1.1 Spatial and flux distribution
Figure 14 shows the spatial distribution of the SSSs. Clearly visible is a concentration of sources in the central field. There are two explanations for that central enhancement. The first is that the central region was observed more often than the remaining fields and therefore there is a higher chance of catching a transient SSS in outburst. The second reason is that the major class of SSSs in the centre of M~31 are optical novae (PFF2005, PHS2007). Optical novae are part of the old stellar population which is much denser in the centre of M~31.
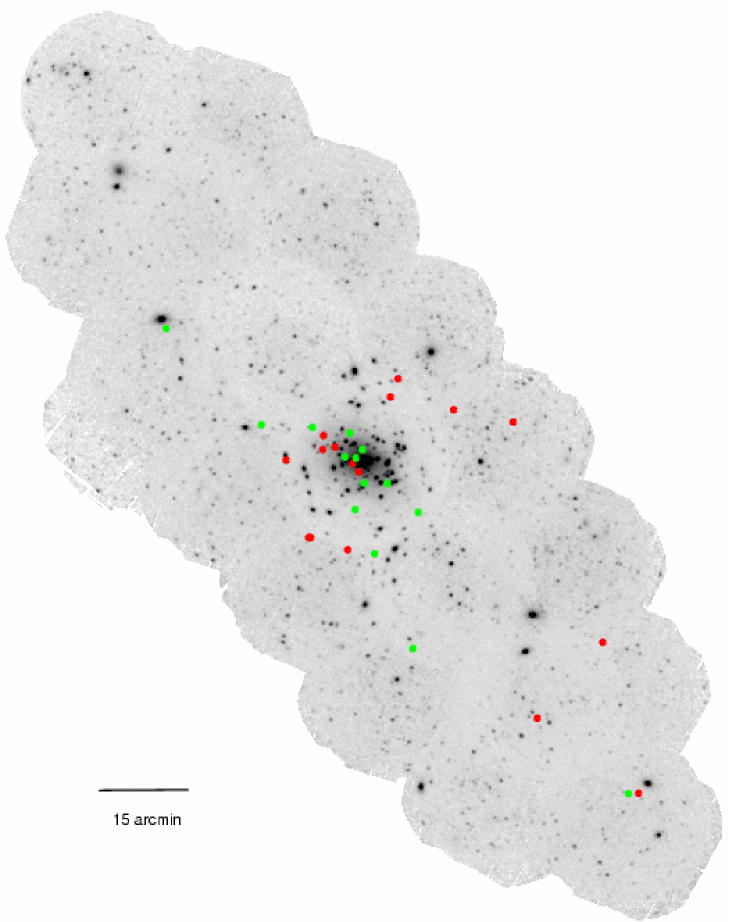
Figure 15 gives the distribution of 0.2–1.0 keV source fluxes for all SSSs (black) and for those correlating with optical novae (blue). The unabsorbed fluxes were determined assuming a 50 eV blackbody model (PFF2005). The two brightest SSSs ( erg cm-2 s-1) consist of a persistent source with 217 s pulsations (N 1 061; Trudolyubov & Priedhorsky 2008) and the nova M31N 2001-11a (N 1 416; Smirnova et al. 2006). A large fraction of SSSs are rather faint, with fluxes below 5 erg cm-2 s-1. Four sources have absorption-corrected luminosities below erg s-1 (0.2–1.0 keV), which was indicated as the limiting luminosity for SSSs. That does not necessarily imply that these sources are not SSSs, since it is possible that the blackbody fit chosen does not represent well the properties of these sources. A higher absorption or a lower temperature would lead to increased unabsorbed luminosities. We also have to take into account that we might have observed the source during a phase of rising or decaying luminosity, i. e. not at maximum luminosity.
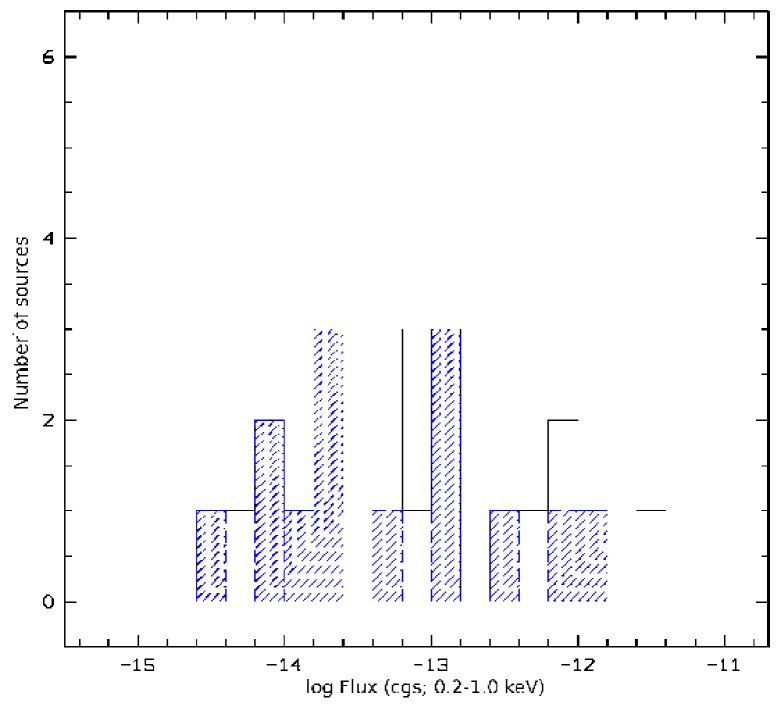
10.1.2 Correlations with optical novae
By cross-correlating with the nova catalogue191919http://www.mpe.mpg.de/~m31novae/opt/m31/M31_table.html indicated in Sect. 3.8, 14 of the 30 SSSs can be classified as X-ray counterparts of optical novae. Of these 14 novae, eight (N 748, N 993, N 1 006, N 1 046, N 1 051, N 1 076, N 1 100, and N 1 236) are already discussed in PFF2005 and PHS2007. Nova M31N 2001-11a was first detected as a supersoft X-ray source. Motivated by that SSS detection, Smirnova et al. (2006) found an optical nova at the position of the SSS in archival optical plates which had been overlooked in previous nova searches. Nova M31N 2007-06b has been discussed in Henze et al. (2009a). The remaining four novae are discussed individually in more detail below.
As was shown in the XMM-Newton/Chandra M~31 nova monitoring project202020http://www.mpe.mpg.de/~m31novae/xray/index.php, it is absolutely necessary to have a homogeneous and dense sample of deep optical and X-ray observations in order to study optical novae and their connections to supersoft X-ray sources. In the optical, the outer regions of M~31 are regularly observed down to a limiting magnitude of 17 mag (Texas Supernova Search (TSS); Quimby 2006), while in X-rays only “snapshots” are available. Hence, the correlations of optical novae with detected SSSs have to be regarded as lucky coincidences. That also means that the identified nova counterparts are detected at a random stage of their SSS evolution which does not allow us to constrain the exact start or end point of the SSS phase, nor the maximum luminosity of the SSS. We also cannot exclude the possibility that some of the SSSs observed in the outer parts of M~31 correspond to the supersoft phase of optical novae for which the optical outburst was missed. In the outer regions of M~31, the samples of optical novae and X-ray SSSs are certainly incomplete, due to the rather high luminosity limit in the optical monitoring, and the lack of complete monitoring in X-rays, respectively. So one should be cautious in deriving properties of the disc nova population of M~31 from the available data.
Nova M31N 1997-10c
was detected on 2 October 1997 at a B-band magnitude of (ShA 58; Sharov & Alksnis 1998). An upper limit of 19 mag on 29 September 1997 was reported by the same authors. They classified this source as a very fast nova. In the XMM-Newton observation c1 (25 June 2000), an SSS (N 871), located within 1 9 of the optical nova, was detected. The source was fitted with an absorbed blackbody model. The formal best fit parameters of the XMM-Newton EPIC PN spectrum are: absorption cm-2 and eV. The unabsorbed luminosity in the 0.2–1 keV band is erg s-1. Confidence contours for absorption column density and blackbody temperature are shown in Fig. 16. In the subsequent XMM-Newton observation of that region taken about half a year later (c2; 27 December 2000) the source is not detected. Although the source position is covered in observations c3 (29 June 2001), c4 (6/7 January 2002) and b (16–19 July 2004) the source was not re-detected. Using the count rates derived for the variability study (see Sect. 6) and assuming the same spectrum for the source as in observation c1, upper limits of the source luminosity can be derived, which are given in Table 16.

| observation | /1037 erg s-1 (0.2–1.0 keV) |
|---|---|
| c2 | 10.8+ |
| c3 | 1.9 |
| c4 | 1.0 |
Notes:
: The count rate detected in observation c2 gives a luminosity of 2.42.8 erg s-1, which results in the upper limit given in the Table. The fact that this upper limit is higher than the luminosity detected in observation c1 is, at least in part, attributed to the very short effective observing time of less than 6 000 s.
Nova M31N 2005-01b
was discovered on 19 January 2005 at a white light magnitude of 16.3 by R. Quimby.212121http://www.supernovae.net/sn2005/novae.html An SSS (N 764) that correlates with the optical nova (distance: 4 3; 3 error: 5 5) was found in observation ss2 taken on 8 July 2006, which is 535 days after the discovery of the optical nova. Due to the severe background screening applied to observation ss2, there is not enough statistics to obtain a spectrum of the X-ray source. To get an estimate of the spectral properties of that source we created a spectrum in the 0.2–0.8 keV range of the unscreened data. Although the spectrum was background corrected, we cannot totally exclude a contribution from background flares. The spectrum is best fitted by an absorbed blackbody model with an absorption of cm-2 and a blackbody temperature of eV. The unabsorbed 0.2–1 keV luminosity is 1.0 erg s-1. In another XMM-Newton observation taken 1 073 days after the optical outburst (ss21; 28 December 2007) the X-ray source is no longer visible. The 3 upper limit of the unabsorbed source luminosity is erg cm-2 s-1 in the 0.2–4.5 keV band, assuming the spectral model used for source detection.
Nova M31N 2005-01c
was discovered on 29 January 2005 at a white light magnitude of 16.1 by R. Quimby.222222http://www.supernovae.net/sn2005/novae.html In the XMM-Newton observation from 02 January 2007 (ns2, 703 days after optical outburst) an SSS was detected (N 1 675) at a position consistent with that of the optical nova (distance: 0 9). The X-ray spectrum (Fig. 17) can be well fitted by an absorbed blackbody model with the following best fit parameters: absorption cm-2 and eV. The unabsorbed 0.2–1 keV luminosity is 1.2 erg s-1. Confidence contours for absorption column density and blackbody temperature are shown in Fig. 18.
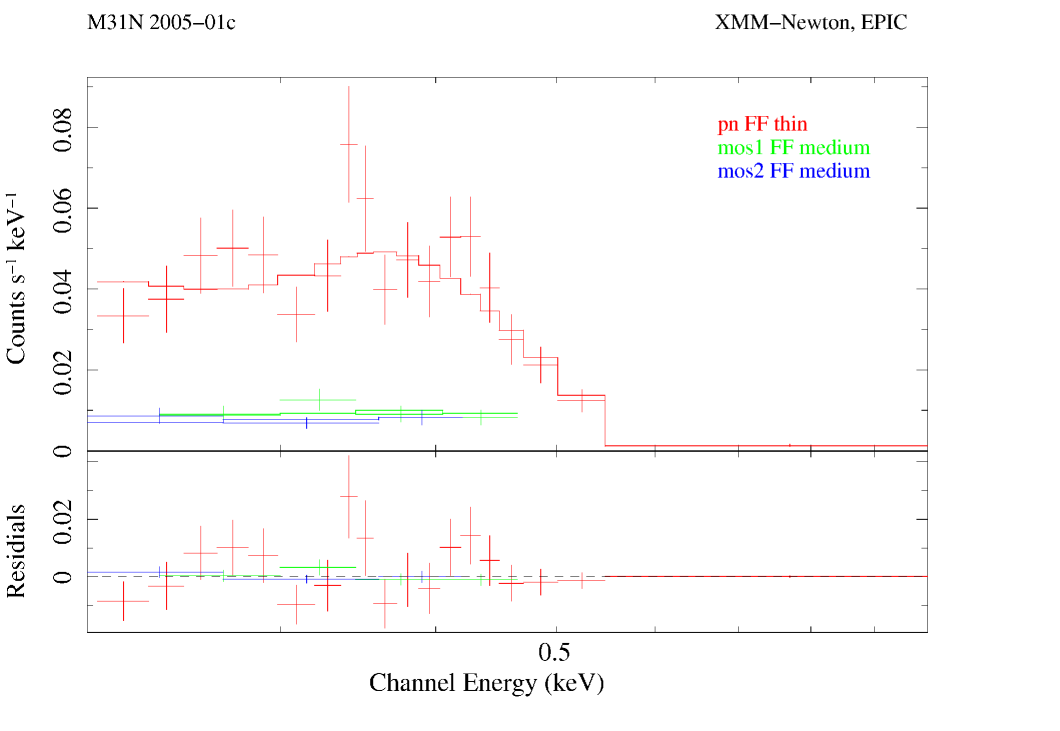
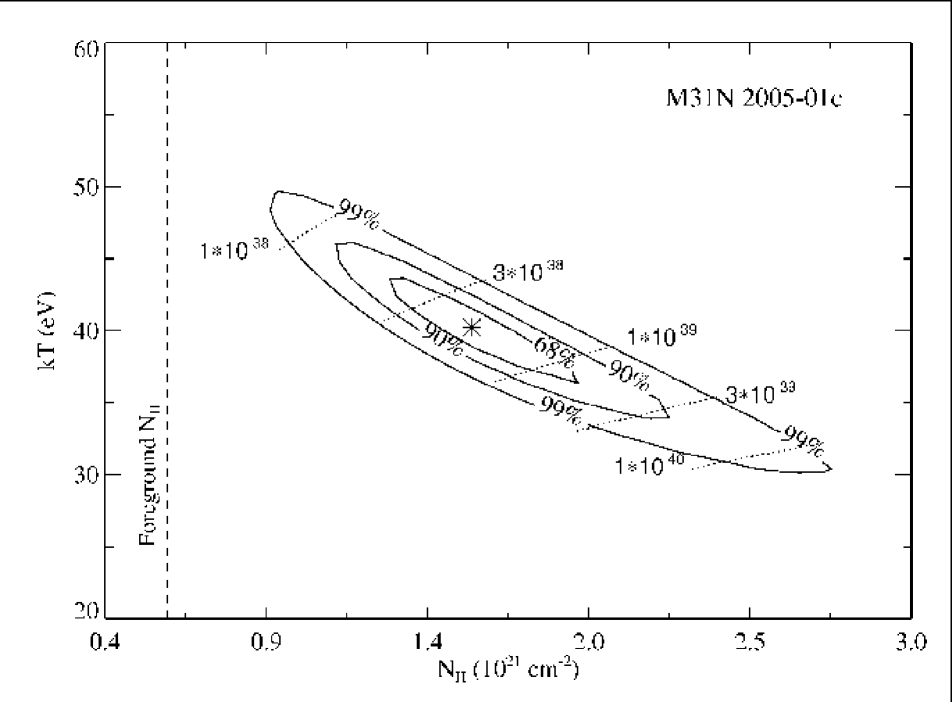
Nova M31N 2005-09b
was discovered in optical images taken on 01 and 02 September 2005 at white light magnitudes of 18.0 and 16.5 respectively. From 31 August 2005, an upper limit of 18.7 mag was reported (Quimby et al. 2005). The nova was spectroscopically confirmed (Pietsch et al. 2006) and classified as a possible Fe II or hybrid nova232323http://cfa-www.harvard.edu/iau/CBAT_M31.html. An X-ray counterpart (N 92) was detected in the XMM-Newton observation s3 (299 days after the optical outburst). Its position is consistent with that of the optical nova (distance: 0 57). As observation s3 was heavily affected by background flares, we only could estimate the spectral parameters from the unscreened data (see also paragraph about Nova M31N 2005-01b). A blackbody fit of the 0.2–0.8 keV gives cm-2, k eV, and an unabsorbed 0.2–1 keV luminosity of 5.4 erg s-1. The X-ray source was no longer visible in observation s31, which was taken 391 days after observation s3.
10.1.3 Comparing XMM-Newton, Chandra and ROSAT catalogues
The results and a detailed discussion of a study of the long-term variability of the SSS population of M~31 are presented in Stiele et al. (2010). In summary our comparative study of SSS candidates in M~31 detected with ROSAT, Chandra and XMM-Newton demonstrated that strict selection criteria have to be applied to securely select SSSs. It also underlined the high variability of the sources in this class and the connection between SSSs and optical novae.
10.2 Supernova remnants
After an supernova explosion the interaction between the ejected material and the ISM forms a supernova remnant (SNR). The SNR X-ray luminosities typically vary between and erg s-1 (0.2–10 keV).
SNRs can be divided into two categories, (i) sources where the thermal components dominate the X-ray spectrum below 2 keV, and (ii) the so-called “plerions” or Crab-like SNRs with power law spectra. The former are located in areas of the X-ray colour/colour diagrams that overlap only with foreground star locii. If we assume that we have identified all foreground star candidates from the optical correlation and inspection of the optical images, the remaining sources can be classified as SNR candidates using the criteria given in Table 6. Similar criteria were used to select supernova remnant candidates in XMM-Newton observations of M 33 (Pietsch et al. 2004; Misanovic et al. 2006). Ghavamian et al. (2005) and Long et al. (2010) confirmed the supernova remnant nature of many of these candidates based on optical and radio follow-up observations. They also used a hardness ratio criterion to select supernova remnant candidates from Chandra data.
An X-ray source is classified as a SNR candidate if it either fulfils the hardness ratio criterion given in Table 6 (these are 25 such sources), or if it correlates with a known optical or radio SNR candidate (six sources). The sources assigned the classification of a SNR candidate based on the latter criterion alone, are marked in the comment column of Table 5 with the flag ‘only correlation’. As these six SNR candidates would be classified as hard on the basis of their hardness ratios, they are good candidates for being “plerions”. SNRs are taken as identified when they coincide with SNR candidates from the optical or radio and fulfil the hardness ratio criterion. For a discussion of detection of SNRs in different wavelength bands see Long et al. (2010). All together, we identified 25 SNRs and 31 SNR candidates in the XMM LP-total catalogue.
This number is in the range expected from an extrapolation of the X-ray detected SNRs in the Milky Way as shown below. Assuming that our own Galaxy contains about 1 440 X-ray sources which are brighter than 1 erg s-1 (Revnivtsev et al. 2006), and that it contains 110 SNRs detected in X-rays (Green 2009), we would expect to detect 50 SNRs in the XMM LP-total catalogue (). This number is in good agreement with the number of identified and classified SNRs.
The XID fluxes for SNRs range between 5.9 erg cm-2 s-1 for source N 1 234 and 1.5 erg cm-2 s-1 for source N 419. These fluxes correspond to luminosities of 4.3 erg s-1 to 1.1 erg s-1. A diagram of the flux distribution of the detected SNRs and candidates is shown in Fig. 19.
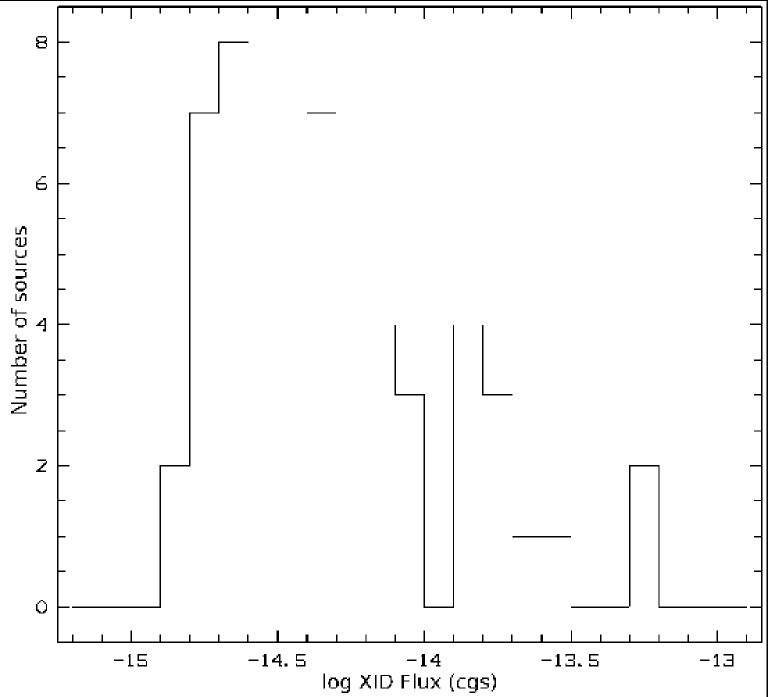
Among the 25 identified SNRs, there are 20 SNRs from the PFH2005 catalogue. Source [PFH2005] 146, which correlates with the radio source [B90] 11 and the SNR candidate BA146, was not found in the present study. Source [SPH2008] 858, which coincides with a source reported as a ring-like extended object in Chandra observations that was also detected in the optical and radio wavelength regimes and identified as a SNR (Kong et al. 2003), was re-detected (N 1 050). Of the 31 SNR candidates ten have been reported by PFH2005. In the following, we first discuss in more detail the remaining four identified SNRs, that appear in the new catalogue but were not included in PFH2005:
XMMM31 J003923.5+404419
(N 182) was classified as a SNR candidate from its [S II]:H ratio. It appears as an ‘irregular ring with southerly projection’ (Dodorico et al. 1980, and Fig. 20) and correlates with a radio source (Pooley 1969). X-ray radiation of that source was first detected in the present study.
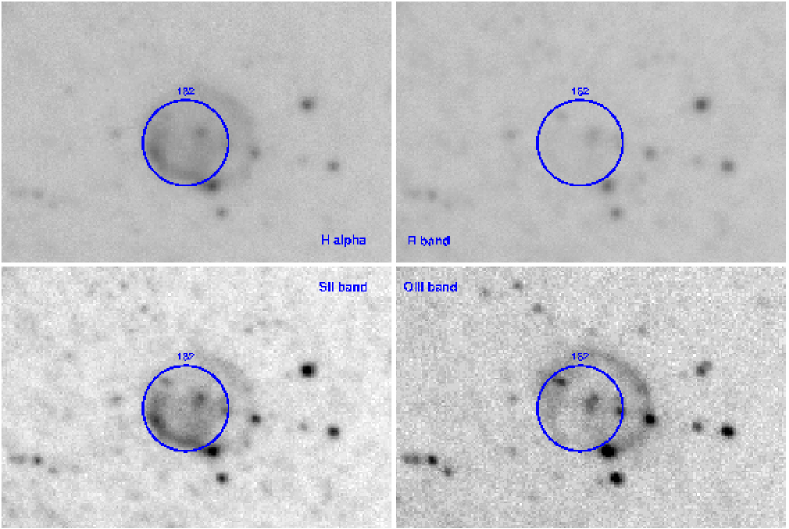
XMMM31 J004413.5+411954
(N 1 410) was classified as a SNR candidate from its [S II]:H ratio (Braun & Walterbos 1993; Magnier et al. 1995). From Fig. 21 we can see that the source ‘appears as a bright knot’, as was already reported by Braun & Walterbos (1993). The source has counterparts in the radio (Braun 1990) and X-ray (SHP97) range. It was reported as a SNR by SHP97.
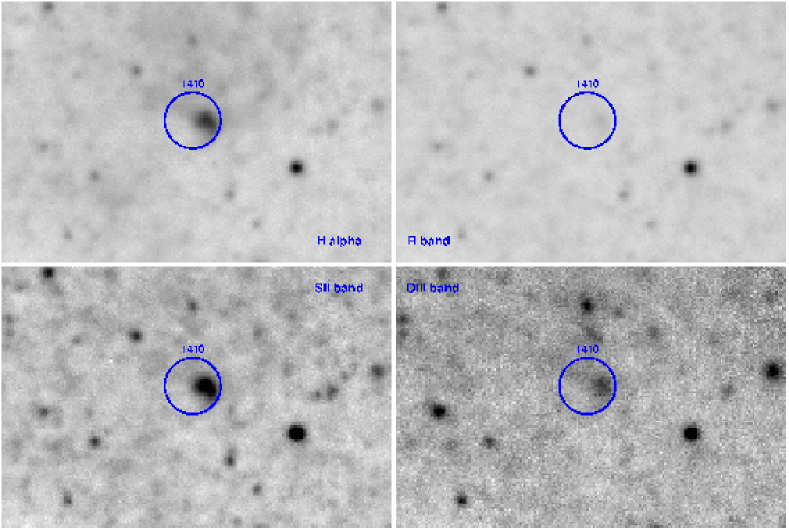
XMMM31 J004510.5+413251 and XMMM31 J004512.3+420029
(N 1 587 and N 1 593, respectively) are new X-ray detections and correlate with the radio sources: #354 and #365 in the list of Braun (1990). Source N 1 587 also correlates with source 37W209 from the catalogue of Walterbos et al. (1985). No optical counterparts were reported in the literature.
In the following, we discuss two SNR candidates in more detail:
XMMM31 J004434.8+412512
(N 1 481) lies in the periphery of a super-shell with [S II]:H0.5 (Braun & Walterbos 1993, src 490). Located next to this source is a SNR candidate reported in Magnier et al. (1995, src 3-086), which has a radio counterpart from the NVSS catalogue. N 1 481 also correlates with ROSAT source [SPH97] 284, which was identified as a SNR in SPH97 due to its spatial correlation with source 3-086. Figure 22 shows the XMM-Newton error circle over-plotted on LGGS images. From the XMM-Newton source position it looks more likely that the X-rays are emitted from the HII region rather than from the SNR candidate visible in the optical and radio wavelengths. Nevertheless the XMM-Newton source detected is point-like and its hardness ratios lie in the range expected for SNRs. If the X-ray emission originated from the H ii-region, it should have been detected as spatially extended emission. Thus, N 1 481 is classified as SNR candidate. A puzzling fact, however, is the pronounced variability between ROSAT and XMM-Newton observations of with a significance of (see Table 17), which is not consistent with the long term behaviour of SNRs. There is still the possibility that the detected X-ray emission does not belong to either the H ii-region or a SNR at all.
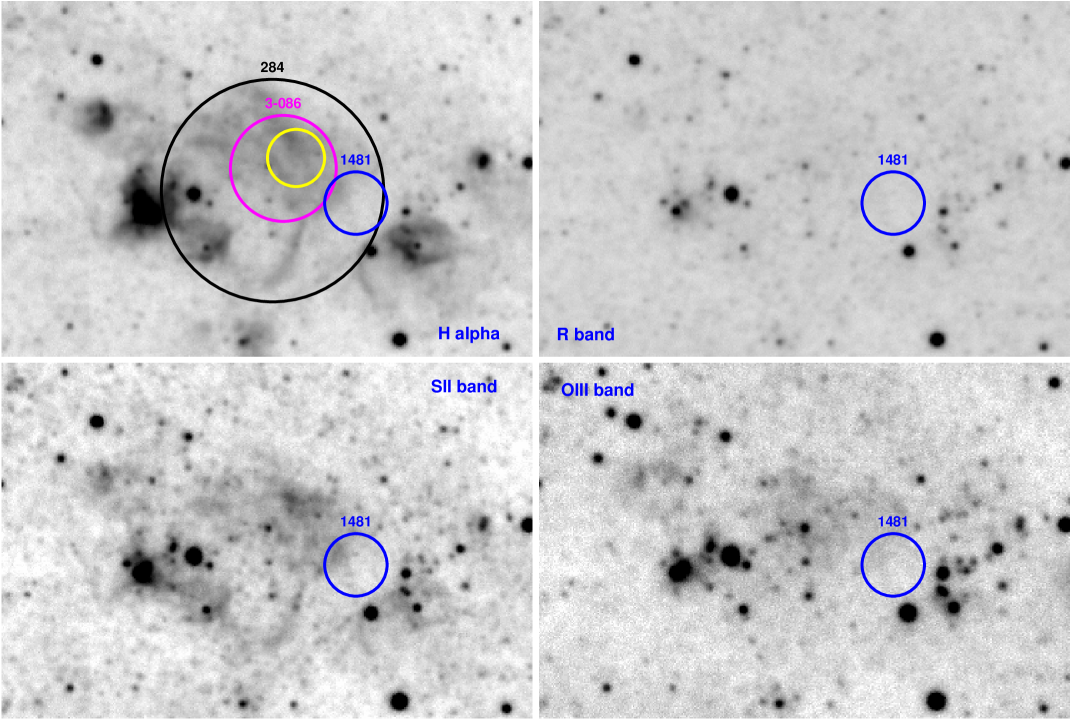
XMMM31 J004239.8+404318
(N 969) was already observed with ROSAT (SHP97, SHL2001) and Chandra (Williams et al. 2004, s1-84). No optical counterpart is visible on the LGGS images. The X-ray spectrum, which is shown in Fig. 23, is well fitted by an absorbed non-equilibrium ionisation model with the following best fit values: an absorption of cm-2, a temperature of eV, and an ionisation timescale of s cm-3. The unabsorbed 0.2–5 keV luminosity is erg s-1. The soft spectrum with the temperature of 200 eV is in good agreement with spectra of old SNRs e. g. in the SMC (Filipović et al. 2008). Although the unabsorbed luminosity is rather high for an old SNR, it is still in the range found for other SNRs (cf. Kong et al. 2002a; Gaetz et al. 2007). Hence, XMMM31 J004239.9+404318 is classified as a SNR candidate.
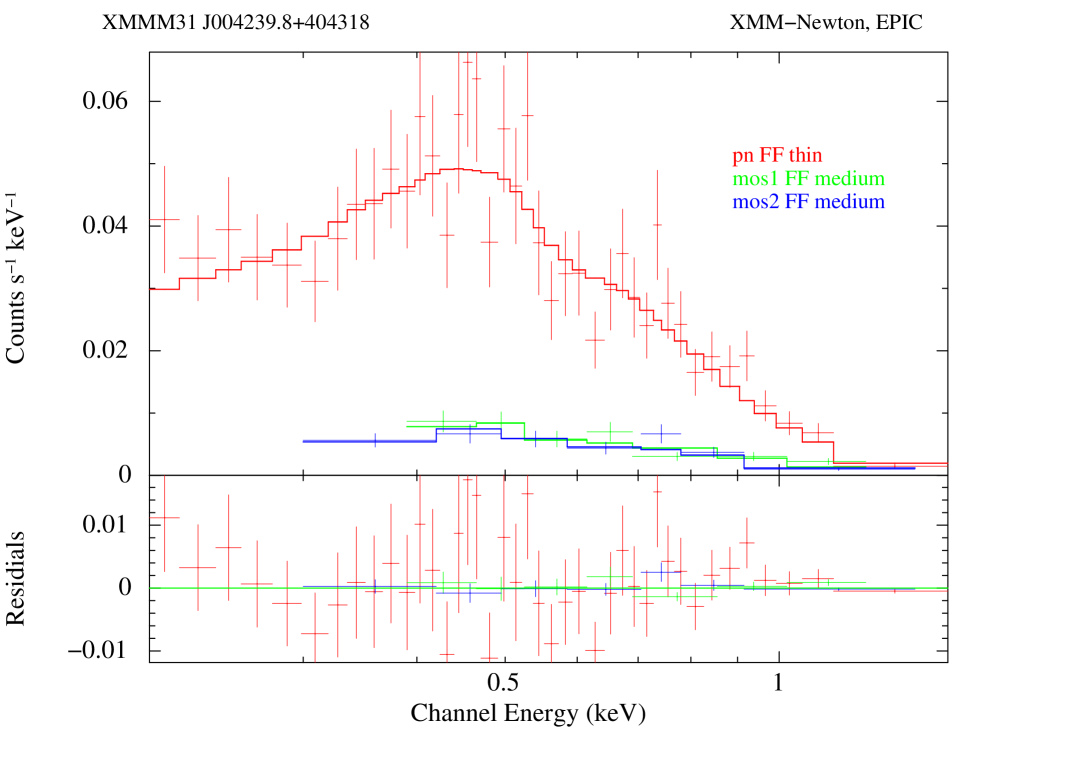
10.2.1 Comparing SNRs and candidates in XMM-Newton, Chandra and ROSAT catalogues
The second ROSAT PSPC catalogue (SHL2001) contains 16 sources classified as SNRs. The counterparts of 12 of these sources are also classified as SNRs or SNR candidates in the XMM LP-total catalogue.
| N | XLPt | SHP97 | SHL2001 | KGP2002+ | WGK2004+ | fvar | svar | reason why indicated vaiability is not reliable |
|---|---|---|---|---|---|---|---|---|
| XID Flux with error in erg cm-2 s-1 | ||||||||
| 474 | 5.27 0.56 | 21.18 4.46 | 4.01 | 3.54 | ||||
| 668 | 7.94 1.36 | 26.30 6.69 | 3.31 | 2.69 | ||||
| 883 | 2.83 0.33 | 3.33 0.83 | 1.18 | 0.56 | ||||
| 1 040 | 7.12 0.47 | 12.49 1.67 | 1.75 | 3.11 | ||||
| 1 050 | 8.25 0.70 | 2.50 0.83 | 3.30 | 5.28 | ||||
| 1 066 | 28.35 1.16 | 256.16 16.19 | 39.13 3.33 | 25.29 5.32 | 10.13 | 14.06 | ROSAT source is a blend of two XMM-Newton sources | |
| 1 234 | 59.12 1.10 | 152.91 13.82 | 268.98 17.09 | 54.11 3.33 | 109.13 11.31 | 4.97 | 12.34 | embedded in diffuse emission in central area of M~31 |
| 1 275 | 23.88 1.08 | 53.50 8.47 | 79.39 9.90 | 3.32 | 5.58 | |||
| 1 328 | 9.25 0.74 | 26.99 | 1.00 | 0.00 | ||||
| 1 351 | 4.96 0.68 | 24.96 8.92 | 17.77 | 1.00 | 0.00 | |||
| 1 372 | 2.12 0.84 | 29.91 | 1.00 | 0.00 | ||||
| 1 410 | 7.40 0.94 | 29.87 7.13 | 4.04 | 3.12 | ||||
| 1 481 | 3.43 0.97 | 33.66 7.36 | 9.82 | 4.07 | see Sect. 10.2 | |||
| 1 535 | 14.73 1.31 | 53.94 9.14 | 34.41 7.20 | 3.66 | 4.25 | |||
| 1 599 | 16.08 0.92 | 54.39 10.03 | 33.51 6.97 | 3.38 | 3.80 | |||
| 1 637 | 12.72 1.33 | 27.21 | 1.00 | 0.00 | ||||
Notes:
: KGP2002: Kong et al. (2002b),WGK2004: Williams et al. (2004)
ROSAT and Chandra count rates are converted to 0.2–4.5 keV fluxes, using WebPIMMS and assuming a foreground absorption of cm-2 and a photon index of : ECF10-14 erg cm-2 cts-1, ECF10-14 erg cm-2 cts-1, and ECF10-14 erg cm-2 cts-1. For WGK2004 the luminosity given in Table 2 of WGK2004 was converted to XID flux using [erg cm-2 s-1] 10[1036erg s-1].
Table 17 lists the XMM-Newton, ROSAT, and Chandra fluxes of all SNRs and SNR candidates from the XMM LP-total catalogue that have counterparts classified as SNRs in ROSAT or Chandra source lists. In addition, the maximum flux variability and the maximum significance of the variability (following the variability calculation of Sect. 3.6) are given. Three SNRs that have ROSAT counterparts show variability changing in flux by more than a factor of five. The most variable source (N 1 066) is discussed below, the second source was discussed in Sect. 10.2 (XMMM31 J004434.8+412512, N 1 481), and the third source (N 1 234) is embedded in the diffuse emission of the central area of M~31. In this environment the larger PSF of ROSAT results in an overestimate of the source flux, since the contribution of the diffuse emission could not be totally separated from the emission of the point source.
The remaining four ROSAT sources classified as SNRs and their XMM-Newton counterparts are discussed in the following paragraph.
| N | XLPt | Chandra | PFJ93 | SHP97 | SHL2001 | fvar | svar | remark‡ |
|---|---|---|---|---|---|---|---|---|
| XID Flux with error in erg cm-2 s-1 | ||||||||
| (1) | (2) | (3) | (4) | (5) | (6) | (7) | (8) | (9) |
| 294 | 2.88 | 5.16 | ||||||
| 472 | 8.28 | 3.76 | 468 brt | |||||
| 969 | 2.58 | 3.96 | ||||||
| 1 079 | 4.79 | 2.53 | brt | |||||
| 1 291 | 24.0 | 2.81 | 3.33 | |||||
| 1 741 | 1.01 | — | brt | |||||
| 1 793 | 7.06 | 3.46 | 1 799 brt | |||||
Notes:
: Source number (from XMM LP-total catalogue) of another (brighter) XMM LP-total source which correlate with the same ROSAT source as the XMM LP-total source given in Col. 1; brt: XMM LP-total flux is below the ROSAT detection threshold (5.3 erg cm-2 s-1).
ROSAT and Chandra count rates are converted to 0.2–4.5 keV fluxes, using WebPIMMS and assuming a foreground absorption of cm-2 and a photon index of : ECF10-14 erg cm-2 cts-1, ECF10-14 erg cm-2 cts-1, ECF10-14 erg cm-2 cts-1, : ECF10-12 erg cm-2 cts-1.
: For WGK2004 the luminosity given in Table 2 of WGK2004 was converted to XID flux using [erg cm-2 s-1] 10[1036erg s-1].
: For VG2007 the luminosity given in Table 2 of VG2007 was converted to XID flux using [erg cm-2 s-1] 10[1036erg s-1].
SHP97 report that [SHP97] 203 and [SHP97] 211 ([SHL2001] 206) correlate with the same SNR ([DDB80] 1.13), have the same spectral properties and have luminosities within the range of SNRs. A correlation with the ROSAT HRI catalogue (PFJ93) reveals that the true X-ray counterpart of [DDB80] 1.13 is located between the two ROSAT PSPC sources. Furthermore, PFJ93 report that this SNR is located ‘within 19 ′′of a brighter X-ray source’ which matches positionally with [SHP97] 211. These findings are confirmed by XMM-Newton and Chandra observations. The X-ray counterpart of [DDB80] 1.13 is source N 1 066 in the XMM LP-total catalogue (or [PFH2005] 354 or r3-69 in Kong et al. 2002b). The second source, which correlates with [SHP97] 211, is the XMM-Newton source N 1 077, which has a “hard” spectrum and is times brighter than N 1 066. Hence, [SHP97] 211 is a blend of the two XMM-Newton sources N 1 066 and N 1 077. This also explains the pronounced variability between [SHL2001] 206 and N 1 066 given in Table 17. Comparing the Chandra detections of the SNR counterpart with the XMM-Newton flux gives a variability factor of .
The distance between [SPH97] 203 and [DDB80] 1.13 is ′′. [SPH97] 203 was reported only in the first ROSAT PSPC catalogue. It was not detected in the observations of the second ROSAT PSPC catalogue or in any XMM-Newton or Chandra observation of that region. Thus it seems very likely that [SPH97] 203 was either a transient source or a false detection. In both cases [SPH97] 203 cannot be a SNR. As the field of [DDB80] 1.13 was observed many times with Chandra, and as Chandra has detected weak SNRs in the central part of M~31 (Kong et al. 2003, and e. g. [DDB80] 1.13), Chandra should have detected X-ray emission corresponding to the ROSAT source [SPH97] 203, if it really belonged to a SNR.
The remaining two ROSAT SNRs correlate with XMM-Newton sources, which were not classified as SNRs or SNR candidates. Source [SHP97] 258 correlates with source N 1 337 and has a 3 positional error of 30′′. From the improved spatial resolution of XMM-Newton the total positional error reduces to 2 3. Hence, we can see that the X-ray source belongs to a foreground star candidate (cf. Table 5) and not to the very nearby SNR. Source [SHL2001] 129 correlates with sources N 743 and N 761, which are classified as a GlC and a GlC candidate, respectively. The SNR candidate listed as the counterpart of [SHL2001] 129 is located between these two XMM-Newton sources. In addition PFH2005 gives a third source which lies within the error circle of [SHL2001] 129 and which is classified as an AGN candidate. Thus it is very likely that [SHL2001] 129 is a blend of these three XMM-Newton sources and that the correlation with the SNR candidate has to be considered as a chance coincidence.
From the sources listed as SNRs in the different Chandra studies many are re-detected. Nevertheless two SNRs from Chandra were not detected in the XMM-Newton observations. Source n1-85 has been reported as spatially correlated with an optical SNR by Williams et al. (2004), but has also been classified as a repeating transient source in the same paper. An XMM-Newton counterpart to n1-85 was detected neither in the study of PFH2005 nor in the XMM LP-total catalogue. The transient nature of this source is at odds with the SNR classification. Source CXOM31 J004247.8+411556 (Kong et al. 2003), which correlates with the radio source [B90] 95, is located in the vicinity of two bright sources and close to the centre of M~31. Due to XMM-Newton’s larger point spread function this source cannot be resolved by XMM-Newton in this environment. The larger PSF of XMM-Newton is also the reason why source N 1 050 has a significant variability in Table 17, since this source is located within the central diffuse emission of M~31.
Finally, we wanted to determine whether any of the XMM LP-total SNRs and SNR candidates were previously observed, but not classified as SNRs. In total there are seven such sources.
One of them (N 1741) is classified as a SNR candidate based on its XMM-Newton hardness ratios, and correlates with the Chandra source n1-48 (DKG2004). The fluxes obtained with XMM-Newton and Chandra are in good agreement (see Table 18), but below the ROSAT detection threshold (5.3 erg cm-2 s-1).
For a further four sources, the corresponding sources were only detected previously with ROSAT. One of them (N 1 793[SHP97] 347) also correlates with a radio source (source 472 of Braun 1990) and is therefore identified as a SNR. The rather high flux variability between the ROSAT and XMM-Newton observations (see Table 18) can be attributed to source N 1 799, which is located within 19 9 of N 1 793. This suggests that [SHP97] 347 is a combination of both XMM-Newton sources, but as [SHP97] 347 was not detected in SHL2001, we cannot exclude a transient source or false detection as an explanation for the ROSAT source. Source N 472 ([SHL2001] 84), source N 294 ([SHP97] 53[SHL2001] 56), and source N 1 079 ([SHP97] 212) are SNR candidates based on their hardness ratios. The pronounced flux variability of source N 472 is due to source N 468, which is located within 185 of N 472 and is 8.6 times brighter than N 472. The observed flux for source N 1 079 was below the ROSAT threshold. Furthermore, the ROSAT source [SHP97] 212 was classified as a SNR, but did not appear in the SHL2001 catalogue. Hence ROSAT may have detected an unrelated transient instead.
Sources corresponding to the remaining two XMM-Newton sources were detected with ROSAT and Chandra. Source N 969 was detected in both ROSAT PSPC surveys ([SHP97] 185[SHL2001] 186) and correlates with Chandra source s1-84 (Williams et al. 2006b). We classify it as a SNR candidate due to its hardness ratios and X-ray spectrum (see XMMM31 J004239.8+404318). Counterparts for source N 1 291 were reported in the literature as [PFJ93] 84, [SHP97] 251, [SHL2001] 255, [VG2007] 261 and source 4 in Table 5 of Orio (2006). Based on the XMM-Newton hardness ratios and the correlation with radio source [B90] 166 (Braun 1990), we identified the source as a SNR. For sources N 294, N 969, and N 1 291 the variability between different observations may not be real because of systematic cross-calibration uncertainties. Therefore, we keep the SNR and SNR classifications for these sources.
10.2.2 The spatial distribution
To examine the spatial distribution of the XMM-Newton SNRs and SNR candidates, we determined projected distances from the centre of M 31. The distribution of SNRs and SNR candidates (normalised per deg2) is shown in Fig. 24. It shows an enhancement of sources around 3 kpc, which corresponds to the SNR population in the ’inner spiral arms’ of M 31. In addition, a second enhancement of sources around 10 kpc is detected; this corresponds to the well known dust ring or star formation ring in the disc of M~31 (Block et al. 2006). Only a few sources are located beyond this ring. Figure 25 shows the spatial distribution of the SNRs and SNR candidates from the XMM LP-total catalogue plotted over the IRAS 60m image (Wheelock et al. 1994). We see that most of the SNRs and SNR candidates are located on features that are visible in the IRAS image. This again demonstrates that SNRs and SNR candidates are coincident with the dust ring at kpc. In addition, the locations of star forming regions obtained from GALEX data (Kang et al. 2009, and private communication) are indicated in Fig. 25. We see that many of the SNRs and SNR candidates are located within or next to star forming regions in M 31.

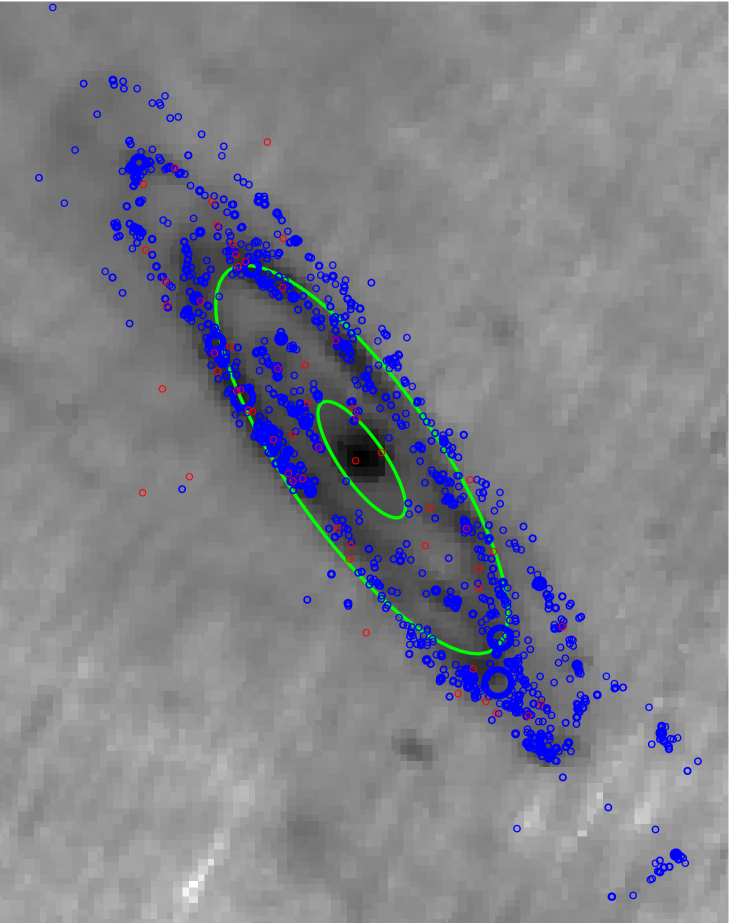
10.3 X-ray binaries
X-ray binaries consist of a compact object plus a companion star. The compact object can either be a white dwarf (these systems are a subclass of CVs), a neutron star (NS), or a black hole (BH). A common feature of all these systems is that a large amount of the emitted X-rays is produced due to the conversion of gravitational energy from the accreted matter into radiation by a mass-exchange from the companion star onto the compact object.
X-ray binaries containing an NS or a BH are divided into two main classes, depending on the mass of the companion star:
-
•
Low mass X-ray binaries (LMXBs) contain companion stars of low mass ( 1 M⊙) and late type (type A or later), and have a typical lifetime of yr (Fabbiano 2006). LMXBs can be located in globular clusters. Mass transfer from the companion star into an accretion disc around the compact object occurs via Roche-lobe overflow.
-
•
High mass X-ray binaries (HMXBs) contain a massive O or B star companion ( M⊙, Verbunt & van den Heuvel 1995) and are short-lived with lifetimes of yr (Fabbiano 2006). One has to distinguish between two main groups of HMXBs: super-giant and the Be/X-ray binaries. In these systems wind-driven accretion onto the compact object powers the X-ray emission. Mass-accretion via Roche-lobe overflow is less frequent in HMXBs, but is still known to occur in several bright systems (e. g. LMC X-4, SMC X-1, Cen X-3). HMXBs are expected to be located in areas of relatively recent star formation, between 25–60 Myr ago (Antoniou et al. 2010).
We should expect about 45 LMXBs in M~31, following a similar estimation as the one presented in Sect. 10.2. Here the number of LMXBs in the Galaxy was estimated from Grimm et al. (2002). In the XMM LP-total catalogue 88 sources are identified/classified as XRBs. This is not surprising as we may expect M~31 to have a higher fraction of XRBs than the Galaxy since it is an earlier type galaxy composed of a higher fraction of old stars.
XRBs are the main contribution to the population of “hard” X-ray sources in M~31. Despite some more or less reliable candidates, not a single, definitely detected HMXB is known in M~31. The results of a new search for HMXB candidates are presented in Sect. 10.3.2. The LMXBs can be separated into two sub-classes: the field LMXBs (discussed in this section) and those located in globular clusters. Sources belonging to the latter sub-class are discussed in Sect. 10.4.
The sources presented here are classified as XRBs, because they have HRs indicating a hard source and are either transient or show a variability factor larger than ten (see Sect. 6).
In total 10 sources are identified and 26 are classified as XRBs by us, according to the classification criteria given in Table 6. Apart from source N 57 (XMMM31 J003833.2+402133, see below), the identified XRBs had been reported as X-ray binaries in the literature (see comment column of Table 5). Figure 26 (red histogram) shows the flux distribution of XRBs. We see that this class contains only rather bright sources. This is not surprising as the classification criterion for XRBs is based on their variability, which is more easily detected for brighter sources (cf. Sect. 6). The XID fluxes range from 1.4 erg cm-2 s-1 (N 378) to 3.75 erg cm-2 s-1 (N 966), which correspond to luminosities from 1.0 erg s-1 to 2.7 erg s-1.
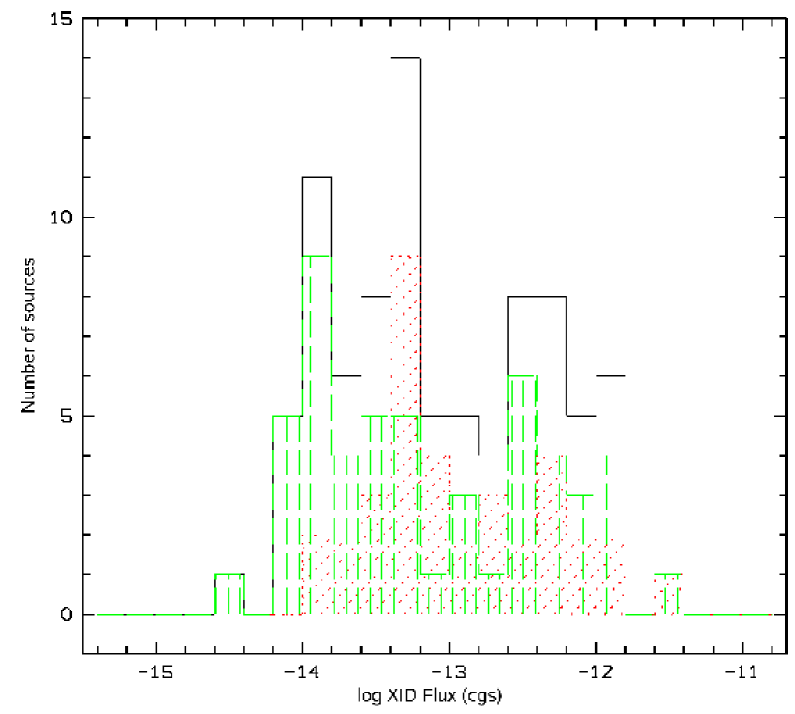
It is clear from Fig. 27, which shows the spatial distribution of the XRBs, that nearly all sources classified or identified as XRBs (yellow dots) are located in fields that were observed more than once (centre and southern part of the disc). This is partly a selection effect, caused by the fact that these particular fields were observed several times, thus allowing the determination of source variability. For sources located outside these fields, especially the northern part of the disc, the transient nature must have been reported in the literature to mark them as an XRBs. The source density of LMXBs, which follows the overall stellar density, is higher in the centre than in the disc of M~31. One would not expect HMXBs in the central region which is dominated by the bulge (old stellar population). From Fig. 28, which shows the spatial distribution of the XRBs over-plotted on an IRAS 60 m image (Wheelock et al. 1994), we see that only a few sources, classified or identified as XRBs, are located in the vicinity of star forming regions.
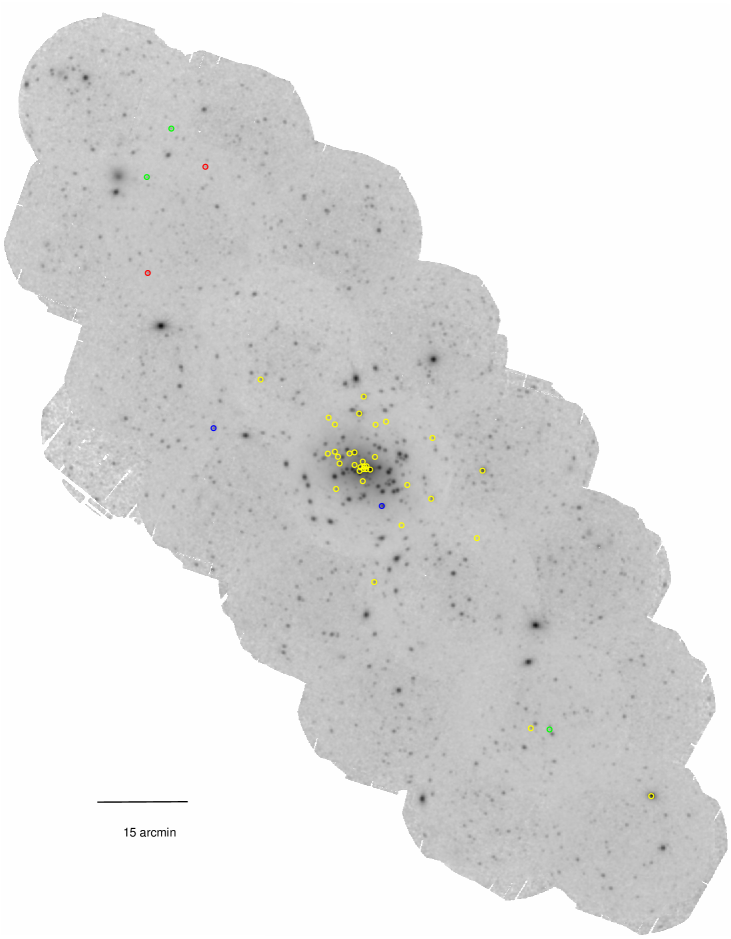
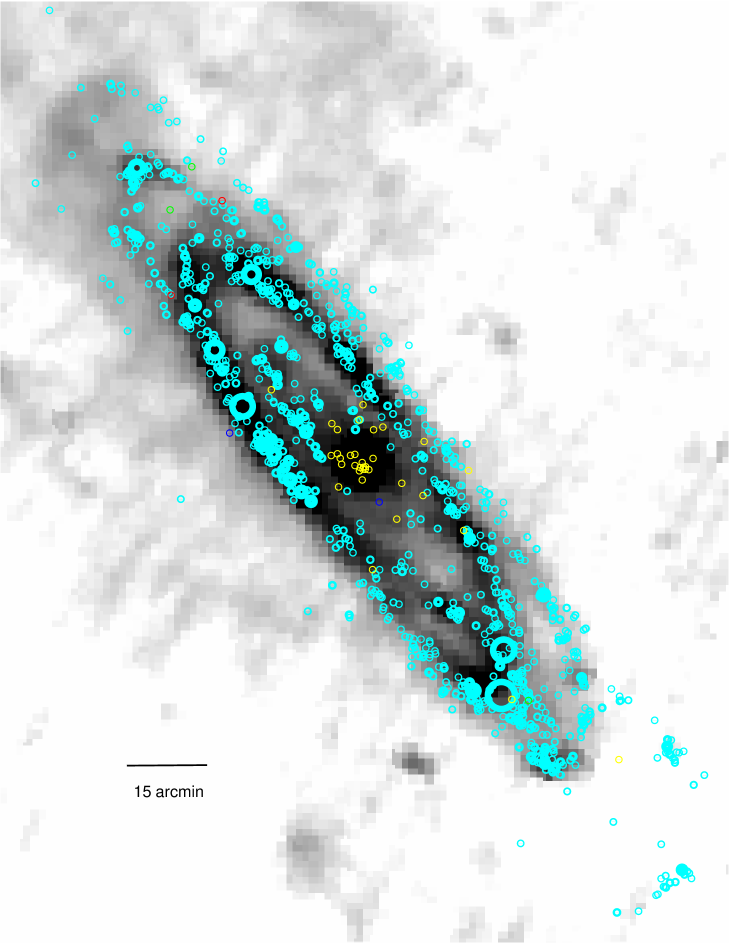
References for the sources, selected from their temporal variability, are given in Table LABEL:Tab:varlist. TPC06 report on four bright X-ray transients, which they detected in the observations of July 2004 and suggested to be XRB candidates. We also found these sources and classified source N 705 and identified sources N 985, N 1 153, N 1 177 as XRBs. One of the identified XRBs (N 1 177) shows a very soft spectrum. Williams et al. (2005b) observed source N 1 153 with Chandra and HST. From the location and X-ray spectrum they suggest it to be an LMXB. They propose that the optical counterpart of the X-ray source is a star within the X-ray error box , which shows an optical brightness change (in B) by 1 mag. Source N 985 was first detected in January 1979 by TF91 with the Einstein observatory. WGM06 rediscovered it in Chandra observations from 2004. Their coordinated HST ACS imaging does not reveal any variable optical counterpart. From the X-ray spectrum and the lack of a bright star, WGM06 suggest that this source is an LMXB with a black hole primary.
In the following subsections we discuss three transient XRBs in more detail.
XMMM31 J003833.2+402133
(N 57) was first detected in the XMM-Newton observation from 02 January 2008 (s32) at an unabsorbed 0.2 – 10 keV luminosity of erg s-1. From two observations, taken about 0.5 yr (s31) and 1.5 yr (s3) earlier, we derived upper limits for the fluxes, which were more than a factor of 100 below the values obtained in January 2008.
The combined EPIC spectrum from observation s32 (Fig. 29(a)) is best fitted with an absorbed disc blackbody plus power-law model, with cm-2, temperature at the inner edge of the disc keV and power-law index of . The contribution of the disc blackbody luminosity to the total luminosity is . Formally acceptable fits are also obtained from an absorbed disc blackbody and an absorbed bremsstrahlung model (see Table 19).
We did not find any significant feature in a fast Fourier transformation (FFT) periodicity search. The combined EPIC light curve during observation s32 was consistent with a constant value.
To identify possible optical counterparts we examined the LGGS images and the images taken with the XMM-Newton optical monitor during the X-ray observation (UVW1 and UVW2 filters). The absence of optical/UV counterparts and of variability on short timescales, as well as the spectral properties suggest that this source is a black hole LMXB in the steep power-law state (McClintock & Remillard 2006).
CXOM31 J004059.2+411551:
Galache et al. (2007) reported on the detection of a previously unseen X-ray source in a 5 ks Chandra ACIS-S observation from 05 July 2007. In an XMM-Newton ToO observation (sn11, Stiele et al. 2007) taken about 20 days after the Chandra detection, the source (N 523) was still bright. The position agrees with that found by Chandra. We detected the source at an unabsorbed 0.2 – 10 keV luminosity of erg s-1.
The combined EPIC spectrum (Fig. 29(b)) can be well fitted with an absorbed disc blackbody model with cm-2 and with a temperature at the inner edge of the disc of keV (Table 19). The spectral parameters and luminosity did not change significantly compared to the Chandra values of Galache et al. (2007).
We did not find any significant feature in an FFT periodicity search. The combined EPIC light curve was consistent with a constant value.
The examination of LGGS images and of images taken with the XMM-Newton optical monitor (UVW1 and UVW2 filters) during the X-ray observation did not reveal any possible optical/UV counterparts.
The lack of bright optical counterparts and the X-ray parameters (X-ray spectrum, lack of periodicity, transient nature, luminosity) are consistent with this source being a black hole X-ray transient, as already mentioned in Galache et al. (2007).
XMMU J004144.7+411110
(N 705) was detected by Trudolyubov et al. (2006) in XMM-Newton observations b1–b4 (July 2004) at an unabsorbed luminosity of 3.1–4.4 erg s-1 in the 0.3–7 keV band, using a DISKBB model. We detected the source in observation sn11 (25 July 2007) with an unabsorbed 0.2–10 keV luminosity of 1.8 erg s-1, using also a DISKBB model.
In observation sn11, the source was bright enough to allow spectral analysis. The spectra can be well fitted with an absorbed power-law, disc blackbody or bremsstrahlung model (Table 19). The obtained spectral shapes (absorption and temperature as well as photon index) are in agreement with the values of Trudolyubov et al. (2006).
An FFT periodicity search did not reveal any significant periodicities in the 0.3 s to 2 000 s range.
No optical counterparts were evident in the images taken with the XMM-Newton optical monitor UVW1 and UVW2 during the sn11 observation, nor in the LGGS images. The lack of a bright optical counterpart and the X-ray parameters support that this source is a black hole X-ray transient, as classified by Trudolyubov et al. (2006).

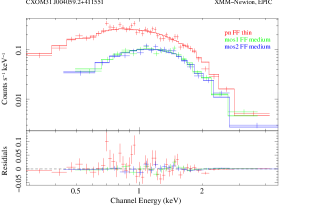
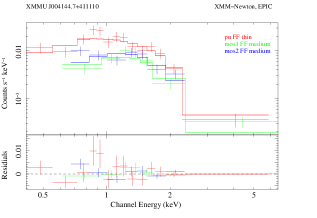
| M 31 field | Model | Photon | Instrument | |||||
| ( cm-2) | (keV) | (km) | Index | (d.o.f) | ||||
| XMMM31 J003833.2+402133 (N 57) | ||||||||
| s32 | PL+DISCBB | 173.89(145) | 2.04 | PN+M1+M2 | ||||
| s32 | DISCBB | 270.01(147) | 1.46 | PN+M1+M2 | ||||
| s32 | BREMSS | 208.65(147) | 2.12 | PN+M1+M2 | ||||
| CXOM31 J004059.2+411551 (N 523) | ||||||||
| sn11 | DISCBB | 97.70(79) | 1.12 | PN+M1+M2 | ||||
| sn11 | BREMSS | 93.17(79) | 1.72 | PN+M1+M2 | ||||
| XMMU J004144.7+411110 (N 705) | ||||||||
| sn11 | DISCBB | 29.74(23) | 0.18 | PN+M1+M2 | ||||
| sn11 | BREMSS | 29.48(23) | 0.29 | PN+M1+M2 | ||||
| sn11 | PL | 31.57(23) | 1.12 | PN+M1+M2 | ||||
Notes:
: effective inner disc radius, where is the inclination angle of the disc
: unabsorbed luminosity in the – keV energy range in units of erg s-1
10.3.1 Sources from the XMM-LP total catalogue that were not detected by ROSAT
To search for additional XRB candidates, we selected all sources from the XMM LP-total catalogue, that were classified as hard and which did not correlate with a source listed in the ROSAT catalogues (PFJ93, SHP97 and SHL2001). The flux distribution of the selected sources is shown in Fig. 30, and Table 20 gives the number of sources brighter than the indicated flux limit.
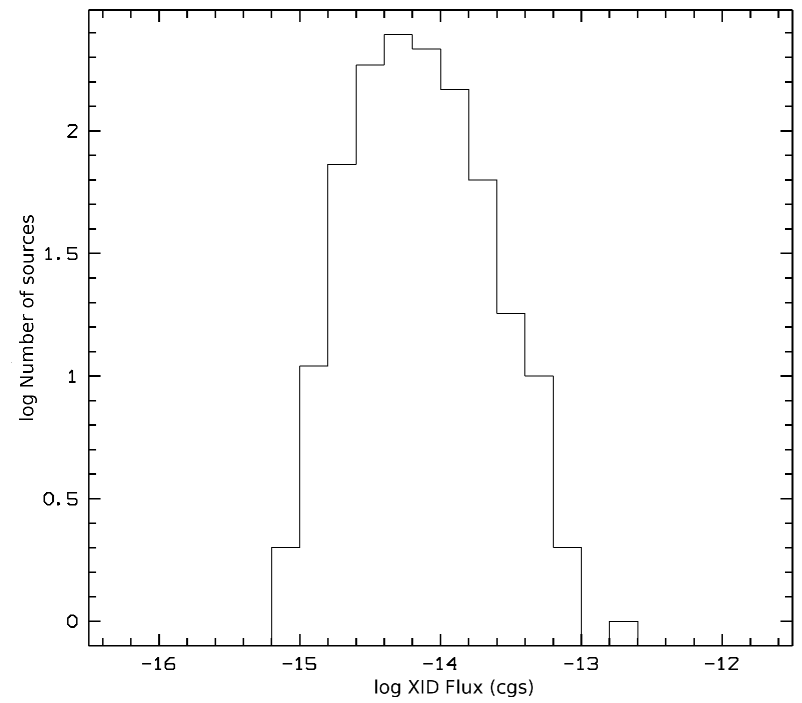
| XID flux limit | # of sources |
|---|---|
| erg cm-2 s-1 | |
| 5.5 E-15 | 541 |
| 1 E-14 | 242 |
| 5 E-14 | 7 |
| 1 E-13 | 1 |
Possible, new XRB candidates are sources that have an XID flux that lies at least a factor of ten above the ROSAT detection threshold (5.3 erg cm-2 s-1). These sources fulfil the variability criterion used to classify XRBs (cf. Sect. 6). The XMM LP-total catalogue lists five sources without ROSAT counterparts that have XID fluxes above 5.3 erg cm-2 s-1. These are: N 239, N 365, N 910, N 1 164, and N 1 553. Between the ROSAT and XMM-Newton observations more than ten years have elapsed. On this time scale AGN can also show strong variability. To estimate the number of AGN among the five sources listed above, we investigated how many sources of the identified and classified background objects from the XMM LP-total catalogue with an XID flux larger than 5.3 erg cm-2 s-1 were not detected by ROSAT. The result is that ROSAT detected all background sources with an XID flux larger than 5.3 erg cm-2 s-1 that are listed in the XMM LP-total catalogue. Thus, the probability that any of the five sources listed above is a background object is very small, in particular if the source is located within the D25 ellipse of M~31. Therefore, the two sources located within the D25 ellipse are listed in the XMM LP-total catalogue as XRB candidates, while the remaining three sources, which are located outside the D25 ellipse, are classified as hard. All five sources are marked in the comment column of Table 5 with ‘XRB cand. from ROSAT corr.’.
10.3.2 Detection of high mass X-ray binaries
As already mentioned, until now not a single secure HMXB in M~31 has been confirmed. The reason for this is that the detection of HMXBs in M~31 is difficult. Colbert et al. (2004) showed that the hardness ratio method is very inefficient in selecting HMXBs in spiral galaxies. The selection process is complicated by the fact, that the spectral properties of BH HMXBs, which have power-law spectra with indices of 1– 2 are similar to LMXBs and AGN. Therefore the region in the HR diagrams where BH HMXB are located is contaminated by other hard sources (LMXBs, AGN, and Crab like SNRs). For the NS HMXBs, which have power-law indices of 1, and thus should be easier to select, the uncertainties in the hardness ratios lead at best to an overlap – in the worst case to a fusion – with the area occupied by other hard sources (Colbert et al. 2004).
Based on the spectral analysis of individual sources of M~31, SBK2009 identified 18 HMXB candidates with power-law indices between 0.8 and 1.2. One of these sources ([SBK2009] 123) correlates with a globular cluster, and hence it is rather an LMXB in a very hard state rather than an HMXB (cf. Trudolyubov & Priedhorsky 2004). Four of their sources ([SBK2009] 34, 106, 149, and 295) do not have counterparts in the XMM LP-total catalogue.
Eger (2008) developed a selection algorithm for HMXBs in the SMC, which also uses properties of the optical companion. X-ray sources were selected as HMXB candidates if they had HR2EHR20.1 as well as an optical counterpart within 2 5 of the X-ray source, with BV mag, UB mag and V17 mag.
We tried to transfer this SMC selection algorithm to M~31 sources. In doing so, we encountered two problems: The first problem is that the region of the U-B/B-V diagram is also populated by globular clusters (LMXB candidates) in M~31. The second problem is that due to the much larger distance to M~31, the range of detected V magnitudes of HMXBs in the SMC of 13V17 mag translates to a 19V23 mag criterion for M~31. Thus the V magnitude of optical counterparts of possible HMXB candidates lies in the same range as the optical counterparts of AGN. Therefore the V mag criterion, which provided most of the discriminatory power in the case of the SMC, fails totally in the case of M~31.
A few of the sources selected from the optical colour-colour diagram and HR diagrams are bright enough to allow the creation of X-ray spectra. That way two additional (i. e. not given in SBK2009) HMXB candidates were found.
In addition, we determined the reddening free Q parameter:
| (8) |
(for definition see e. g. Cox 2001) which allowed us to keep only the intrinsically bluest stars, using Q (O-type stars typically have Q, while -0.4 corresponds to a B5 dwarf or giant or an A0 supergiant, Massey et al. 2007). UB and BV were taken from the LGGS catalogue.
XMMM31 J004557.0+414830
(N 1 716) has an USNO-B1 (R218.72 mag), a 2MASS and an LGGS (V20.02 mag; Q) counterpart. The EPIC spectrum is best fitted () by an absorbed power-law with cm-2 and photon index . The absorption corrected X-ray luminosity in the 0.2–10 keV band is 7.1 erg s-1.
XMMM31 J004506.4+420615
(N 1 579) has an USNO-B1 (B220.87 mag), a 2MASS and an LGGS (V20.77 mag; Q) counterpart. The EPIC PN spectrum is best fitted () by an absorbed power-law with cm-2 and photon index . The absorption corrected X-ray luminosity in the 0.2–10 keV band is 8.6 erg s-1.
To strengthen these classifications spectroscopic optical follow-up observations of the optical counterparts are needed. An FFT periodicity search did not reveal any significant periodicities for either of the two sources and the light curves do not show eclipses.
From the sources reported as HMXB candidates in SBK2009, three sources ([SBK2009] 21, 236, and 256) are located in the region of the U-B/B-V diagram, that we used. Another three sources ([SBK2009] 123, 172, and 226) are located outside that region. The remaining sources of SBK2009 have either no counterparts with a U-B colour entry in the LGGS catalogue ([SBK2009] 99, 234, 294, and 302) or have no optical counterpart from the LGGS catalogue at all ([SBK2009] 9, 160, 197, and 305). The reddening free Q parameter for the SBK2009 sources that have counterparts in the LGGS catalogue are given in Table 21.
| N | [SBK2009] | LGGS counterpart | |
|---|---|---|---|
| 312 | 21 | J004001.50+403248.0 | -0.34 |
| 1668 | 236 | J004538.23+421236.0 | -0.77 |
| 1724 | 256 | J004558.98+420426.5 | -0.81 |
| 1109 | 123 | J004301.51+413017.5 | +1.77 |
| 1436 | 172 | J004420.98+413546.7 | -0.65 |
| J004421.01+413544.3∗ | -0.29 | ||
| 1630 | 226 | J004526.68+415631.5 | -0.92 |
| J004526.58+415633.1∗ | -0.72 |
Notes:
: counterparts listed in SBK2009
10.4 Globular cluster sources
A significant number of the luminous X-ray sources in the Galaxy and in M~31 are found in globular clusters. X-ray sources corresponding to globular clusters are identified by cross-correlating with globular cluster catalogues (see Sect. 3.8). Therefore changes between the XMM LP-total catalogue and the catalogue of PFH2005 in the classification of sources related to globular clusters are based on the availability of and modifications in recent globular cluster catalogues.
In total 52 sources of the XMM LP-total catalogue correlate with (possible) globular clusters. Of these sources 36 are identified as GlCs because their optical counterparts are listed as globular clusters in the catalogues given in Sect. 3.8, while the remaining 16 sources are only listed as globular cluster candidates.
The range of source XID fluxes goes from 3.1 erg cm-2 s-1 (N 924) to 2.7 erg cm-2 s-1 (N 1 057), or in luminosity from 2.3 erg s-1 to 2.0 erg s-1 (Fig. 26; green histogram). Compared to the fluxes found for the XRBs discussed in Sect. 10.3, 14 sources that correlate with GlCs have fluxes below the lowest flux found for field XRBs. The reason for this finding is that the classification of field XRBs is based on the variable or transient nature of the sources, which can only be to detected for brighter sources (cf. Sect. 6) and not just by positional coincidence that is also possible for faint sources.
Figure 31 shows the spatial distribution of the GlC sources. X-ray sources correlating with GlCs follow the distribution of the optical GlCs, which are also concentrated towards the central region of M~31.
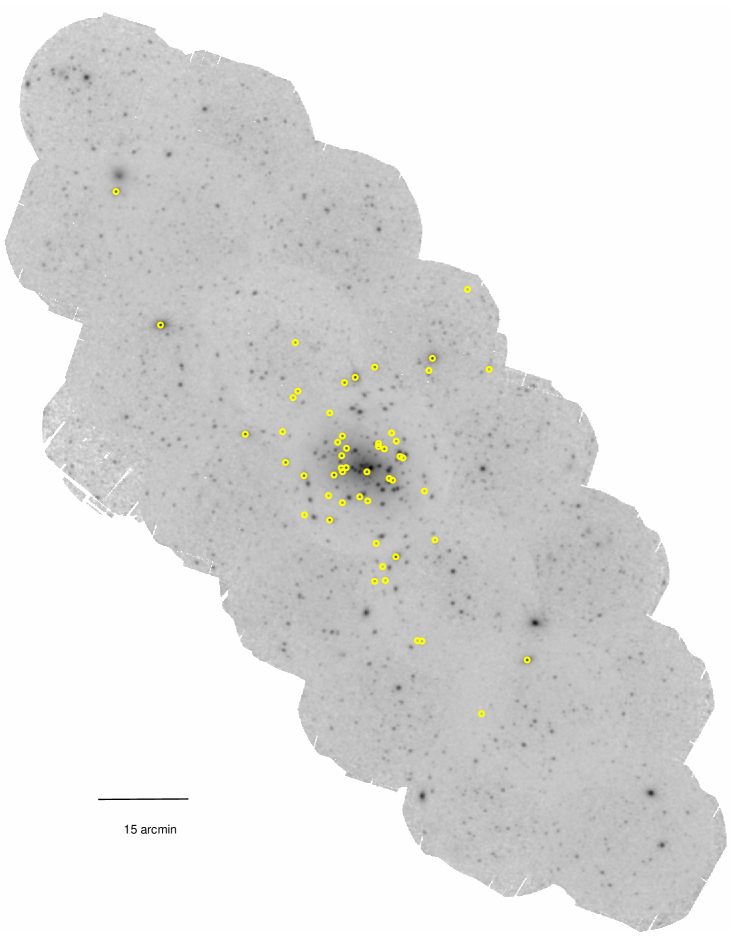
The three brightest globular cluster sources, which are located in the northen disc of M~31, are N 1 057 (XMMM31 J004252.0+413109), N 694 (XMMM31 J004143.1+413420), and N 1 692 (XMMM31 J004545.8+413941). They are all brighter than 8.4 erg s-1. Source N 694 was classified as a black hole candidate, due to its variability observed at such high luminosities. A detailed discussion of the three sources is given in Barnard et al. (2008).
XMMM31 J004303.2+412121 (N 1 118) was identified as a foreground star in PFH2005, based on the classification in the “Revised Bologna Catalogue” (Galleti et al. 2004). Galleti et al. (2004) took the classification from Dubath & Grillmair (1997), which is based on the velocity dispersion of that source. Recent ‘HST images unambiguously reveal that this [B147] is a well resolved star cluster, as recently pointed out also by Barmby et al. (2007)’ (Galleti et al. 2007). That is why source N 1 118 is now identified as an XRB located in globular cluster B147.
10.4.1 Integrated optical properties of the globular clusters in which the X ray sources are located
| Name | Class∗ | Age+ | V mag | VI | VI0 | Age† |
|---|---|---|---|---|---|---|
| B005 | confirmed | old | 15.69 | 1.29 | 1.15 | old |
| SK055B | candidate | - | 18.991 | 0.388 | 0.248 | – |
| B024 | confirmed | old | 16.8 | 1.15 | 1.01 | old |
| SK100C | candidate | na | 18.218 | 1.181 | 1.041 | old |
| B045 | confirmed | old | 15.78 | 1.27 | 1.13 | old |
| B050 | confirmed | old | 16.84 | 1.18 | 1.04 | old |
| B055 | confirmed | old | 16.67 | 1.68 | 1.54 | old |
| B058 | confirmed | old:: | 14.97 | 1.1 | 0.96 | old-inter |
| MITA140 | confirmed | old | 17 | 9999 | - | – |
| B078 | confirmed | old | 17.42 | 1.62 | 1.48 | old |
| B082 | confirmed | old | 15.54 | 1.91 | 1.77 | old |
| B086 | confirmed | old | 15.18 | 1.26 | 1.12 | old |
| SK050A | confirmed | - | 18.04 | 1.079 | 0.939 | old-inter |
| B094 | confirmed | old | 15.55 | 1.26 | 1.12 | old |
| B096 | confirmed | old | 16.61 | 1.48 | 1.34 | old |
| B098 | confirmed | old | 16.21 | 1.13 | 0.99 | old-inter |
| B107 | confirmed | old | 15.94 | 1.28 | 1.14 | old |
| B110 | confirmed | old | 15.28 | 1.28 | 1.14 | old |
| B117 | confirmed | old:: | 16.34 | 1 | 0.86 | inter |
| B116 | confirmed | old | 16.79 | 1.86 | 1.72 | old |
| B123 | confirmed | old | 17.416 | 1.29 | 1.15 | old |
| B124 | confirmed | old | 14.777 | 1.147 | 1.007 | old |
| B128 | confirmed | old:: | 16.88 | 1.12 | 0.98 | old-inter |
| B135 | confirmed | old | 16.04 | 1.22 | 1.08 | old |
| B143 | confirmed | old | 16 | 1.22 | 1.08 | old |
| B144 | confirmed | old:: | 15.88 | 0.59 | 0.45 | young |
| B091D | confirmed | old | 15.44 | 9999 | - | – |
| B146 | confirmed | old:: | 16.95 | 1.09 | 0.95 | interm |
| B147 | confirmed | old | 15.8 | 1.27 | 1.13 | old |
| B148 | confirmed | old | 16.05 | 1.17 | 1.03 | old |
| B150 | confirmed | old | 16.8 | 1.28 | 1.14 | old |
| B153 | confirmed | old | 16.24 | 1.3 | 1.16 | old |
| B158 | confirmed | old | 14.7 | 1.15 | 1.01 | old |
| B159 | confirmed | old | 17.2 | 1.41 | 1.27 | old |
| B161 | confirmed | old | 16.33 | 1.1 | 0.96 | old-inter |
| B182 | confirmed | old | 15.43 | 1.29 | 1.15 | old |
| B185 | confirmed | old | 15.54 | 1.18 | 1.04 | old |
| B193 | confirmed | old | 15.33 | 1.28 | 1.14 | old |
| SK132C | candidate | - | 18.342 | 1.84 | 1.7 | old |
| B204 | confirmed | old | 15.75 | 1.17 | 1.03 | old |
| B225 | confirmed | old | 14.15 | 1.39 | 1.25 | old |
| B375 | confirmed | old | 17.61:: | 1.02 | 0.88 | interm |
| B386 | confirmed | old | 15.547 | 1.154 | 1.014 | old |
Notes:
: classification as confirmed or otherwise comes from the revised Bologna catalogue (December 2009, Version 4) http://www.bo.astro.it/M31/RBC_Phot07_V4.tab
: age comes from Caldwell et al. (2009)
V, and VI are integrated colours that come from the revised Bologna catalogue (December 2009, Version 4)
http://www.bo.astro.it/M31/RBC_Phot07_V4.tab
(VI)o is the dereddened V-I integrated colour, assuming E(B-V)=0.10+-0.03, which is the average of the reddenings of all M~31 clusters in Rich et al. (2005). (this E(BV) corresponds to E(VI))
: This dereddened colour (VI)o is used to estimate the age on the basis of the plots (VI)o versus log Age from Sarajedini et al. (2007).

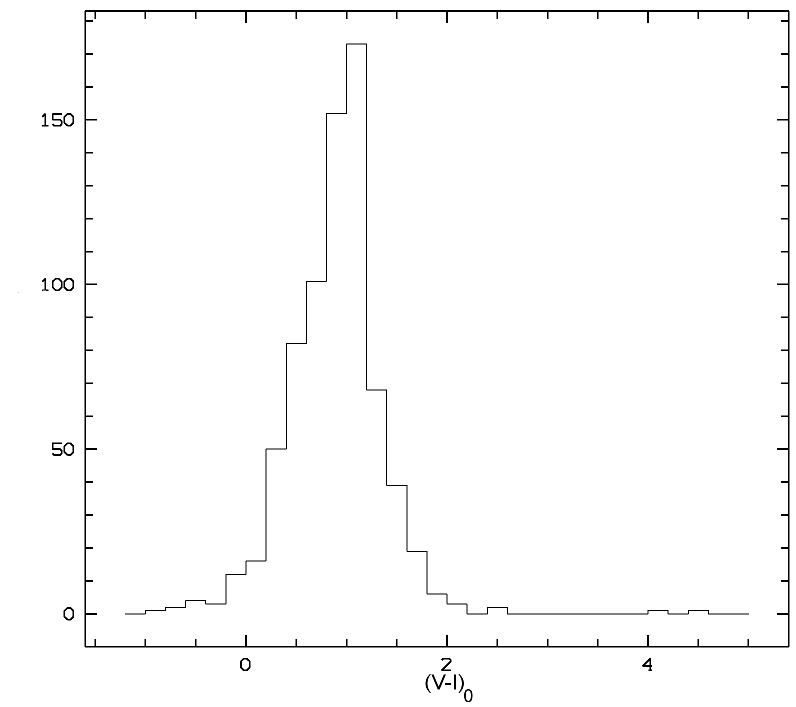
For each X-ray source which correlates with a globular cluster or globular cluster candidate in the optical, we investigated its integrated V-I colour and derived age estimates. Table 22 lists the name of the optical counterpart, its classification according to RBC V.4 (Galleti et al. 2009), the age classification of Caldwell et al. (2009), the V magnitude and V-I colour given in RBC V.4, the dereddened V-I colour, and the age estimate derived by ourselves.
The integrated VI colours of the clusters can be found in RBC V.4 and can be used to provide estimates of the ages of the clusters, in conjunction with reddening values. We have adopted a reddening of E(BV), which is the average of the reddenings of all M~31 clusters in Rich et al. (2005). Using these values, we have derived (VI)o for our clusters. In most cases (VI) suggesting clusters older than 2 Gyr according to Sarajedini et al. (2007). The histogram in Fig. 32 shows the distribution of (VI)o for our clusters, with the approximate age-ranges marked.
In general there is good agreement between the Caldwell et al. (2009) and our age estimates. This result indicates that the great majority of the objects are indeed old globular clusters.
Figure 33 shows the distribution of (VI)o for all confirmed and candidate globular clusters, listed in the RBC V.4, which are located in the XMM LP-total field, and which have V as well as I magnitudes given. A comparison with Fig. 32 again reveals that mainly counterparts of old globular clusters (age 2 Gyr) are detected in X-rays.
10.4.2 Comparing GlC and candidates in XMM-Newton, Chandra and ROSAT catalogues
The combined ROSAT PSPC catalogue (SHP97 and SHL2001) contains 33 sources classified as globular cluster counterparts. Of these sources one is located outside the field observed with XMM-Newton. Another two sources do not have counterparts in the XMM LP-total catalogue. The first one is [SHL2001] 232, which is not visible in any XMM-Newton observation taken before December 2006 as was already reported in Trudolyubov & Priedhorsky (2004). The second source ([SHL2001] 231) correlates with B 164 which is identified as a globular cluster in RBC V3.5. In addition [SHL2001] 231 is listed in PFH2005 as the counterpart of the source [PFH2005] 423. Due to the improved positional accuracy of the X-ray source in the XMM-Newton observations, PFH2005 rejected the correlation with B 164 and instead classified [PFH2005] 423 as a foreground star candidate.
Three ROSAT GlC candidates have more than one counterpart in the XMM LP-total catalogue. [SHL2001] 249 correlates with sources N 1 262 and N 1 267, where the latter is the X-ray counterpart of the globular cluster B 185. [SHL2001] 254 correlates with sources N 1 289 and N 1 293, where the former is the X-ray counterpart of the globular cluster candidate mita 311 (Magnier 1993). [SHL2001] 258 has a 1 positional error of 48′′ and thus correlates with sources N 1 297, N 1 305 and N 1 357.242424In addition [SHL2001] 258 correlates with N 1 275, N 1 289 and N 1 293. However these sources have each an additional ROSAT counterpart. The brightest of these three sources (N 1 305), which is actually located closest to the ROSAT position, correlates with the globular cluster candidate SK 132C (RBC V3.5).
Table 23 gives the variability factors (Cols. 6, 8) and significance of variability (7, 9) for sources classified as GlC candidates in the ROSAT PSPC surveys. For most sources only low variability is detected. The two sources with the highest variability factors found (N 1262, N 1293) belong to ROSAT sources with more than one XMM-Newton counterpart. In these cases the XMM-Newton sources that correlate with the same ROSAT source and the optical globular cluster source show much weaker variability. Interestingly, a few sources show low, but very significant variability. Among these sources is the Z-source identified in Barnard et al. (2003, N 966) and two of the sources discussed in Barnard et al. (2008, N 1 057, N 1 692).
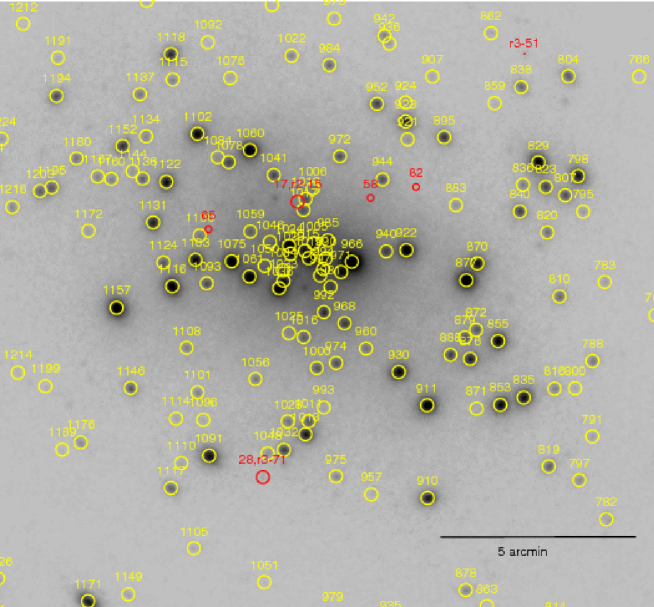
| SRC | SI∗ | SII∗ | XFLUX+ | EXFLUX+ | fv_SI† | sv_SI† | fv_SII† | sv_SII† | type | SIf‡ | SIIf‡ |
|---|---|---|---|---|---|---|---|---|---|---|---|
| (1) | (2) | (3) | (4) | (5) | (6) | (7) | (8) | (9) | (10) | (11) | (12) |
| 383 | 73 | 68 | 1.45E-12 | 1.05E-14 | 1.26 | 11.58 | 1.23 | 9.04 | GlC | * | * |
| 403 | 79 | 74 | 2.55E-14 | 2.36E-15 | 2.61 | 2.09 | 7.57 | 4.92 | Gal | ||
| 422 | 76 | 2.01E-14 | 1.43E-15 | hard | |||||||
| 694 | 122 | 113 | 1.52E-12 | 1.04E-14 | 1.38 | 10.56 | 1.26 | 7.46 | GlC | * | * |
| 793 | 138 | 136 | 4.76E-14 | 2.33E-15 | 1.10 | 0.55 | 1.02 | 0.14 | Gal | * | |
| 841 | 150 | 147 | 1.40E-12 | 1.61E-14 | 1.77 | 19.81 | 2.11 | 26.37 | GlC | * | – |
| 855 | 158 | 154 | 4.21E-13 | 3.70E-15 | 1.01 | 0.14 | 3.54 | 48.75 | GlC | * | |
| 885 | 168 | 163 | 1.56E-14 | 1.60E-15 | 1.70 | 1.54 | GlC | ||||
| 923 | 175 | 175 | 1.47E-13 | 2.07E-15 | 1.87 | 7.68 | 1.30 | 3.44 | GlC | ||
| 933 | 178 | 3.67E-14 | 1.64E-15 | 3.03 | 7.03 | GlC | |||||
| 947 | 180 | 179 | 3.24E-13 | 7.46E-15 | 2.43 | 12.78 | 2.29 | 12.16 | GlC | * | – |
| 966 | 184 | 184 | 3.51E-12 | 9.21E-15 | 1.00 | 0.20 | 2.31 | 151.58 | XRB | ||
| 1 057 | 205 | 199 | 2.67E-12 | 2.05E-14 | 1.72 | 26.26 | 1.79 | 28.48 | GlC | * | * |
| 1 102 | 217 | 211 | 3.23E-13 | 2.93E-15 | 1.06 | 1.04 | 5.51 | 60.80 | GlC | * | |
| 1 109 | 218 | 212 | 3.25E-13 | 9.08E-15 | 1.91 | 9.70 | 2.10 | 10.72 | GlC | * | * |
| 1 118 | 222 | 216 | 1.16E-13 | 2.03E-15 | 1.46 | 3.63 | 1.89 | 7.46 | GlC | ||
| 1 122 | 223 | 217 | 2.48E-13 | 2.72E-15 | 2.08 | 12.02 | 7.03 | 73.27 | GlC | ||
| 1 157 | 228 | 223 | 7.59E-13 | 4.48E-15 | 1.06 | 1.68 | 1.08 | 2.75 | GlC | * | * |
| 1 171 | 229 | 227 | 4.68E-13 | 4.93E-15 | 1.82 | 12.92 | 1.75 | 12.19 | GlC | * | * |
| 1 262 | 247 | 249 | 2.94E-14 | 3.10E-15 | 14.11 | 18.40 | 14.64 | 20.24 | |||
| 1 267 | 247 | 249 | 4.80E-13 | 4.57E-15 | 1.16 | 3.04 | 1.11 | 2.44 | GlC | * | * |
| 1 289 | 250 | 254 | 2.88E-14 | 1.91E-15 | 1.16 | 0.57 | 1.98 | 3.15 | GlC | * | |
| 1 293 | 250 | 254 | 6.70E-15 | 9.42E-16 | 3.73 | 2.80 | 8.53 | 5.72 | AGN | ||
| 1 296 | 253 | 257 | 3.89E-14 | 1.58E-15 | 4.03 | 9.38 | 1.25 | 1.17 | GlC | ||
| 1 297 | 252 | 258 | 5.59E-15 | 9.61E-16 | 4.46 | 2.69 | hard | ||||
| 1 305 | 258 | 1.69E-14 | 9.87E-16 | GlC | |||||||
| 1 340 | 261 | 266 | 6.07E-14 | 3.01E-15 | 1.77 | 4.20 | 1.30 | 1.64 | GlC | * | |
| 1 357 | 258 | 7.04E-15 | 1.18E-15 | hard | |||||||
| 1 449 | 281 | 289 | 2.34E-14 | 1.00E-15 | 3.10 | 5.36 | 1.79 | 2.39 | fg Star | ||
| 1 463 | 282 | 290 | 7.51E-13 | 8.38E-15 | 1.13 | 3.33 | 1.33 | 7.64 | GlC | * | * |
| 1 634 | 302 | 316 | 7.70E-14 | 2.91E-15 | 3.14 | 5.60 | 1.89 | 4.33 | hard | * | * |
| 1 692 | 318 | 336 | 1.15E-12 | 2.00E-14 | 2.86 | 45.59 | 2.62 | 38.63 | GlC | * | |
| 1 803 | 349 | 354 | 8.72E-13 | 9.17E-15 | 1.32 | 7.87 | 1.03 | 0.93 | GlC | * | * |
Notes:
: SI: SHP97, SII: SHL2001
: XID Flux and error in erg cm-2 s-1
: Variability factor and significance of variability, respectively, for comparisons of XMM-Newton XID fluxes to ROSAT fluxes listed in SPH97 and SHL2001, respectively.
: An asterisk indicates that the XID flux is larger than the corresponding ROSAT flux. ROSAT count rates are converted to 0.2–4.5 keV fluxes, using WebPIMMS and assuming a foreground absorption of cm-2 and a photon index of : ECF10-14 erg cm-2 cts-1 and ECF10-14 erg cm-2 cts-1
The 18 X-ray sources correlating with globular clusters which were found in the ROSAT HRI observations (PFJ93) were all re-detected in the XMM-Newton data.
From the numerous studies of X-ray globular cluster counterparts in M~31 based on Chandra observations (Kong et al. 2002b; Di Stefano et al. 2002; Williams et al. 2004; Trudolyubov & Priedhorsky 2004; Voss & Gilfanov 2007), only eight sources are undetected in the present study. One of them ([TP2004] 1) is located far outside the field of M~31 covered by the Deep XMM-Newton Survey. The transient nature of [TP2004] 35, and the fact that it is not observed in any XMM-Newton observation taken before December 2006 was mentioned in Sect. 7.2. The six remaining sources (r2-15, r3-51, r3-71, [VG2007] 58, [VG2007] 65, [VG2007] 82) are located in the central area of M~31 and are also not reported in PFH2005. Figure 34 shows the position of these six sources (in red) and the sources of the XMM LP-total catalogue (in yellow). If the brightness of the six sources had not changed between the Chandra and XMM-Newton observations, they would be in principle bright enough to be detected by XMM-Newton in the merged observations of the central field, which have in total an exposure 100 ks. Two sources (r2-15 and [VG2007] 65) are located next to sources detected by XMM-Newton. Source r2-15 is located within 13′′ of N 1 012 and within 17′′ of N 1 017 and has – in the Chandra observation – a similar luminosity to both XMM-Newton sources. The distance between N 1 012 and N 1 017 is 17′′ and within 20′′ of N 1 012, XMM-Newton detected source N 1 006, which is about a factor 4.6 fainter than N 1 012. Therefore, when in a bright state, source r2-15 should be detectable with XMM-Newton. Source [VG2007] 65 is located within 17′′of N 1 100, which is at least 3.5 times brighter than [VG2007] 65. This may complicate the detection of [VG2007] 65 with XMM-Newton. The variability of [VG2007] 58, [VG2007] 65, and [VG2007] 82 is supported by the fact that these three sources were not detected in any Chandra study, prior to Voss & Gilfanov (2007). Hence, these six sources are likely to be at least highly variable or even transient.
Several sources identified with globular clusters in previous studies have counterparts in the XMM LP-total catalogue but are not classified as GlC sources by us. Source N 403 ([SHL2001] 74) correlates with B 007, which is now identified as a background galaxy (Caldwell et al. 2009; Kim et al. 2007, RBC V3.5). Sources N 793 ([SHL2001] 136, s1-12) and N 796 (s1-11) are the X-ray counterparts of B 042D and B 044D, respectively, which are also suggested as background objects by Caldwell et al. (2009). Source N 948 (s1-83) correlates with B 063D, which is listed as a globular cluster candidate in RBC V3.5, but might be a foreground star (Caldwell et al. 2009). Due to this ambiguity in classification we classified the source as hard. Source N 966 correlates with [SHL2001] 184, which was classified as the counterpart of the globular cluster NB 21 (RBC V3.5) in the ROSAT PSPC survey (SHL2001). In addition, source N 966 also correlates with the Chandra source r2-26 (Kong et al. 2002b). Due to the much better spatial resolution of Chandra compared to ROSAT, Kong et al. (2002b) showed that source r2-26 does not correlate with the globular cluster NB 21. Barnard et al. (2003) identified this source as the first Z-source in M~31. The nature of source N 1 078 is unclear as RBC V3.5 reported that source to be a foreground star, while Caldwell et al. (2009) classified it as an old globular cluster. Due to this ambiguity in the classification and due to the fact that source N 1 078 is resolved into two Chandra sources (r2-9, r2-10), we decided to classify the source as hard. Due to the transient nature (Kong et al. 2002b; Williams et al. 2006b) and the ambiguous classifications reported by RBC V3.5 (GlC) and Caldwell et al. (2009, HII region), we adopt the classification of PFH2005 (XRB) for source N 1 152. SBK2009 classified the source correlating with source N 1 293 as a globular cluster candidate. We are not able to confirm this classification, as none of the globular cluster catalogues used, contains an entry at the position of source N 1 293. Instead we found a radio counterpart in the catalogues of Gelfand et al. (2005), Braun (1990) and NVSS. We therefore classified the source as an AGN candidate, as was also done in PFH2005.
For source N 1 449 ([SHL2001] 289) the situation is more complicated. SHL2001 report [MA94a] 380 as the globular cluster correlating with this X-ray source. Based on the same reference, Fan et al. (2005) included the optical source in their statistical study of globular cluster candidates. However, the paper with the acronym [MA94a] is not available. An intensive literature search of the papers by Magnier did not reveal any work relating to globular clusters in M~31, apart from Magnier (1993) which is cited in Fan et al. (2005) as “MIT”. In addition the source is not included in any other globular cluster catalogues listed in Sect. 3.8. In the X-ray studies of Williams et al. (2004) and PFH2005 and in Magnier et al. (1992) the source is classified as a foreground star (candidate). Hence, we also classified source N 1 449 as a foreground star candidate, but suggest optical follow-up observations of the source to clarify its true nature.
A similar case is source N 422 ([SHL2001] 76), which is classified as a globular cluster by SHL2001, based on a correlation with [MA94a] 16. Here again the source is not listed in any of the globular cluster catalogues used. We found one correlation of source N 422 with an object in the USNO-B1 catalogue, which has no B2 and R2 magnitude. Two faint sources (V mag) of the LGGS catalogue are located within the X-ray positional error circle. Thus source N 422 is classified as hard. While RBC V3.5 classified the optical counterpart of source N 1 634 ([SHL2001] 316) as a globular cluster candidate, Caldwell et al. (2009) regard SK 182C as being a source of unknown nature. Therefore we decided to classify source N 1634 as hard.
11 Conclusions
This paper presents the analysis of a large and deep XMM-Newton survey of the bright Local Group SA(s)b galaxy M~31. The survey observations were taken between June 2006 and February 2008. Together with re-analysed archival observations, they provide for the first time full coverage of the M31 ellipse down to a 0.2 – 4.5 keV luminosity of erg s-1.
The analysis of combined and individual observations allowed the study of faint persistent sources as well as brighter variable sources.
The source catalogue of the Large XMM-Newton Survey of M~31 contains 1 897 sources in total, of which 914 sources were detected for the first time in X-rays. The XID source luminosities range from 4.4 erg s-1 to 2.7 erg s-1. The previously found differences in the spatial distribution of bright ( erg s-1) sources between the northern and southern disc could not be confirmed. The identification and classification of the sources was based on properties in the X-ray wavelength regime: hardness ratios, extent and temporal variability. In addition, information obtained from cross correlations with M~31 catalogues in the radio, infra-red, optical and X-ray wavelength regimes were used.
The source catalogue contains 12 sources with spatial extent between 6 2 and 23 0. From spectral investigation and comparison with optical images, five sources were classified as galaxy cluster candidates.
317 out of 1 407 examined sources showed long term variability with a significance 3 between the XMM-Newton observations. These include 173 sources in the disc that were not covered in the study of the central field (SPH2008). Three sources located in the outskirts of the central field could not have been detected as variable in the study presented in SPH2008, as they only showed variability with a significance 3 between the archival and the “Large Project” observations. For 69 sources the flux varied by more than a factor of five between XMM-Newton observations; ten of these varied by a factor 100.
Discrepancies in source detection between the Large XMM-Newton Survey catalogue and previous XMM-Newton catalogues could be explained by different search strategies, and differences in the processing of the data, in the parameter settings of the detection runs and in the software versions used. Correlations with previous Chandra studies showed that those sources not detected in this study are strongly time variable, transient, or unresolved. This is particularly true for sources located close to the centre of M~31, where Chandra’s higher spatial resolution resolves more sources. Some of the undetected sources from previous ROSAT studies were located outside the field covered with XMM-Newton. However, there were several sources detected by ROSAT that had a ROSAT detection likelihood larger than 15. If these sources were still in a bright state they should have been detected with XMM-Newton. Thus, the fact that these sources are not detected with XMM-Newton implies that they are transient or at least highly variable sources. On the other hand 242 hard XMM-Newton sources were found with XID fluxes larger than erg cm-2 s-1, which were not detected with ROSAT.
To study the properties of the different source populations of M~31, it was necessary to separate foreground stars (40 plus 223 candidates) and background sources (11 AGN and 49 candidates, 4 galaxies and 19 candidates, 1 galaxy cluster and 5 candidates) from the sources of M~31. 1 247 sources could only be classified as hard, while 123 sources remained without identification or classification. The majority (about two-thirds, see Stiele et al. 2011 in preparation) of sources classified as hard are expected to be background objects, especially AGN.
The catalogue of the Large XMM-Newton survey of M~31 contains 30 SSS candidates, with unabsorbed 0.2–1.0 keV luminosities between 2.4 erg s-1 and 2.8 erg s-1. SSSs are concentrated to the centre of M~31, which can be explained by their correlation with optical novae, and by the overall spatial distribution of M~31 late type stars (i. e. enhanced density towards the centre). Of the 14 identifications made of optical novae, four were presented in more detail.
The 25 identified and 31 classified SNRs had XID luminosities between 1.1 erg s-1 and 4.31036 erg s-1. Three of the 25 identified SNRs were detected for the first time in X-rays. For one SNR the ROSAT classification can be confirmed. Six of the SNR candidates were selected from correlations with sources in SNR catalogues from the literature. As these six sources had rather “hard” hardness ratios they are good candidates for “plerions”. An investigation of the spatial distribution showed that most SNRs and candidates are located in regions of enhanced star formation, especially along the 10 kpc dust ring in M~31. This connection between SNRs and star forming regions, implies that most of the remnants are from type II supernovae. Most of the SNR classifications from previous studies have been confirmed. However, in five cases these classifications are doubtful.
The population of “hard” M~31 sources mainly consists of XRBs. These rather bright sources (XID luminosity range: 1.0 erg s-1 to 2.7 erg s-1) were selected from their transient nature or strong long term variability (variability factor 10; 10 identified, 26 classified sources). The spectral properties of three transient sources were presented in more detail.
A sub-class of LMXBs is located in globular clusters. They were selected from correlations with optical sources included in globular cluster catalogues (36 identified, 16 classified sources). The XID luminosity of GlCs ranges from 2.3 erg s-1 to 1.0 erg s-1. The spatial distribution of this source class also showed an enhanced concentration to the centre of M~31.
From optical and X-ray colour-colour diagrams possible HMXB candidates were selected. If the sources were bright enough, an absorbed power-law model was fitted to the source spectra. Two of the candidates had a photon index consistent with the photon index range of NS HMXBs. Hence these two sources were suggested as new HMXB candidates.
Follow-up studies in the optical as well as in radio are in progress or are planned. They will allow us to increase the number of identified sources and help us to classify or identify sources which can up to now only be classified as hard or are without any classification.
This work focused on the overall properties of the source population of individual classes and gave us deeper insights into the long-term variability, spatial and flux distribution of the sources in the field of M~31 and thus helped us to improve our understanding of the X-ray source population of M~31.
Acknowledgements.
This publication makes use of the USNOFS Image and Catalogue Archive operated by the United States Naval Observatory, Flagstaff Station (http://www.nofs.navy.mil/data/fchpix/), of data products from the Two Micron All Sky Survey, which is a joint project of the University of Massachusetts and the Infrared Processing and Analysis Center/California Institute of Technology, funded by the National Aeronautics and Space Administration and the National Science Foundation, of the SIMBAD database, operated at CDS, Strasbourg, France, and of the NASA/IPAC Extragalactic Database (NED) which is operated by the Jet Propulsion Laboratory, California Institute of Technology, under contract with the National Aeronautics and Space Administration. The XMM-Newton project is supported by the Bundesministerium für Wirtschaft und Technologie/Deutsches Zentrum für Luft- und Raumfahrt (BMWI/DLR, FKZ 50 OX 0001) and the Max-Planck Society. HS acknowledges support by the Bundesministerium für Wirtschaft und Technologie/Deutsches Zentrum für Luft- und Raumfahrt (BMWI/DLR, FKZ 50 OR 0405).?refname?
- Antoniou et al. (2010) Antoniou, V., Zezas, A., Hatzidimitriou, D., & Kalogera, V. 2010, ApJ, 716, L140
- Bałucińska-Church & McCammon (1992) Bałucińska-Church, M. & McCammon, D. 1992, ApJ, 400, 699
- Barmby et al. (2007) Barmby, P., McLaughlin, D. E., Harris, W. E., Harris, G. L. H., & Forbes, D. A. 2007, AJ, 133, 2764
- Barnard et al. (2003) Barnard, R., Kolb, U., & Osborne, J. P. 2003, A&A, 411, 553
- Barnard et al. (2008) Barnard, R., Stiele, H., Hatzidimitriou, D., et al. 2008, ApJ, 689, 1215
- Bender et al. (2005) Bender, R., Kormendy, J., Bower, G., et al. 2005, ApJ, 631, 280
- Block et al. (2006) Block, D. L., Bournaud, F., Combes, F., et al. 2006, Nature, 443, 832
- Bonfini et al. (2009) Bonfini, P., Hatzidimitriou, D., Pietsch, W., & Reig, P. 2009, A&A, 507, 705
- Bowyer et al. (1974) Bowyer, S., Margon, B., Lampton, M., & Cruddace, R. 1974, ApJ, 190, 285
- Brandt & Hasinger (2005) Brandt, W. N. & Hasinger, G. 2005, ARA&A, 43, 827
- Braun (1990) Braun, R. 1990, ApJS, 72, 761
- Braun & Walterbos (1993) Braun, R. & Walterbos, R. A. M. 1993, A&AS, 98, 327
- Brusa et al. (2007) Brusa, M., Zamorani, G., Comastri, A., et al. 2007, ApJS, 172, 353
- Caldwell et al. (2009) Caldwell, N., Harding, P., Morrison, H., et al. 2009, AJ, 137, 94
- Cash (1979) Cash, W. 1979, ApJ, 228, 939
- Cavaliere & Fusco-Femiano (1976) Cavaliere, A. & Fusco-Femiano, R. 1976, A&A, 49, 137
- Colbert et al. (2004) Colbert, E. J. M., Heckman, T. M., Ptak, A. F., Strickland, D. K., & Weaver, K. A. 2004, ApJ, 602, 231
- Collura et al. (1990) Collura, A., Reale, F., & Peres, G. 1990, ApJ, 356, 119
- Condon et al. (1998) Condon, J. J., Cotton, W. D., Greisen, E. W., et al. 1998, AJ, 115, 1693
- Cox (2001) Cox, A. 2001, Allen’s astrophysical quantities (Springer)
- Crampton et al. (1984) Crampton, D., Hutchings, J. B., Cowley, A. P., Schade, D. J., & van Speybroeck, L. P. 1984, ApJ, 284, 663
- Di Stefano et al. (2002) Di Stefano, R., Kong, A. K. H., Garcia, M. R., et al. 2002, ApJ, 570, 618
- Di Stefano et al. (2004) Di Stefano, R., Kong, A. K. H., Greiner, J., et al. 2004, ApJ, 610, 247 (DKG2004)
- Dodorico et al. (1980) Dodorico, S., Dopita, M. A., & Benvenuti, P. 1980, A&AS, 40, 67
- Dubath & Grillmair (1997) Dubath, P. & Grillmair, C. J. 1997, A&A, 321, 379
- Eger (2008) Eger, P. 2008, Master’s thesis, TU München
- Fabbiano (2006) Fabbiano, G. 2006, ARA&A, 44, 323
- Fan et al. (2005) Fan, Z., Ma, J., Zhou, X., et al. 2005, PASP, 117, 1236
- Filipović et al. (2008) Filipović, M. D., Haberl, F., Winkler, P. F., et al. 2008, A&A, 485, 63
- Freyberg et al. (2004) Freyberg, M. J., Briel, U. G., Dennerl, K., et al. 2004, in Proceedings of the SPIE, Vol. 5165, X-Ray and Gamma-Ray Instrumentation for Astronomy XIII., ed. K. A. Flanagan & O. H. W. Siegmund, 112
- Gaetz et al. (2007) Gaetz, T. J., Blair, W. P., Hughes, J. P., et al. 2007, ApJ, 663, 234
- Galache et al. (2007) Galache, J. L., Garcia, M. R., Steeghs, D., et al. 2007, The Astronomer’s Telegram, 1147, 1
- Galleti et al. (2009) Galleti, S., Bellazzini, M., Buzzoni, A., Federici, L., & Fusi Pecci, F. 2009, A&A, 508, 1285
- Galleti et al. (2007) Galleti, S., Bellazzini, M., Federici, L., Buzzoni, A., & Fusi Pecci, F. 2007, A&A, 471, 127
- Galleti et al. (2005) Galleti, S., Bellazzini, M., Federici, L., & Fusi Pecci, F. 2005, A&A, 436, 535
- Galleti et al. (2006) Galleti, S., Federici, L., Bellazzini, M., Buzzoni, A., & Fusi Pecci, F. 2006, A&A, 456, 985
- Galleti et al. (2004) Galleti, S., Federici, L., Bellazzini, M., Fusi Pecci, F., & Macrina, S. 2004, A&A, 416, 917
- Garcia et al. (2000) Garcia, M. R., Murray, S. S., Primini, F. A., et al. 2000, ApJ, 537, L23
- Gelfand et al. (2004) Gelfand, J. D., Lazio, T. J. W., & Gaensler, B. M. 2004, ApJS, 155, 89
- Gelfand et al. (2005) Gelfand, J. D., Lazio, T. J. W., & Gaensler, B. M. 2005, ApJS, 159, 242
- Ghavamian et al. (2005) Ghavamian, P., Blair, W. P., Long, K. S., et al. 2005, AJ, 130, 539
- Giacconi et al. (1974) Giacconi, R., Murray, S., Gursky, H., et al. 1974, ApJS, 27, 37
- Green (2009) Green, D. A. 2009, Bulletin of the Astronomical Society of India, 37, 45
- Grimm et al. (2002) Grimm, H., Gilfanov, M., & Sunyaev, R. 2002, A&A, 391, 923
- Haberl & Pietsch (1999) Haberl, F. & Pietsch, W. 1999, A&A, 344, 521
- Hasinger et al. (2001) Hasinger, G., Altieri, B., Arnaud, M., et al. 2001, A&A, 365, L45
- Hatzidimitriou et al. (2006) Hatzidimitriou, D., Pietsch, W., Misanovic, Z., Reig, P., & Haberl, F. 2006, A&A, 451, 835
- Henze et al. (2009a) Henze, M., Pietsch, W., Haberl, F., et al. 2009a, A&A, 500, 769
- Henze et al. (2009b) Henze, M., Pietsch, W., Sala, G., et al. 2009b, A&A, 498, L13
- Hodge et al. (2009) Hodge, P. W., Krienke, O. K., Bellazzini, M., et al. 2009, AJ, 138, 770
- Holland (1998) Holland, S. 1998, AJ, 115, 1916
- Kaaret (2002) Kaaret, P. 2002, ApJ, 578, 114
- Kahabka (1999) Kahabka, P. 1999, A&A, 344, 459
- Kahabka & van den Heuvel (1997) Kahabka, P. & van den Heuvel, E. P. J. 1997, ARA&A, 35, 69
- Kang et al. (2009) Kang, Y., Bianchi, L., & Rey, S. 2009, ApJ, 703, 614
- Kim et al. (2007) Kim, S. C., Lee, M. G., Geisler, D., et al. 2007, AJ, 134, 706
- Kimball & Ivezić (2008) Kimball, A. E. & Ivezić, Ž. 2008, AJ, 136, 684
- Kong et al. (2002a) Kong, A. K. H., Garcia, M. R., Primini, F. A., & Murray, S. S. 2002a, ApJ, 580, L125
- Kong et al. (2002b) Kong, A. K. H., Garcia, M. R., Primini, F. A., et al. 2002b, ApJ, 577, 738
- Kong et al. (2003) Kong, A. K. H., Sjouwerman, L. O., Williams, B. F., Garcia, M. R., & Dickel, J. R. 2003, ApJ, 590, L21
- Kotov et al. (2006) Kotov, O., Trudolyubov, S., & Vestrand, W. T. 2006, ApJ, 641, 756
- Krienke & Hodge (2007) Krienke, O. K. & Hodge, P. W. 2007, PASP, 119, 7
- Krienke & Hodge (2008) Krienke, O. K. & Hodge, P. W. 2008, PASP, 120, 1
- Long et al. (2010) Long, K. S., Blair, W. P., Winkler, P. F., et al. 2010, ApJS, 187, 495
- Maccacaro et al. (1988) Maccacaro, T., Gioia, I. M., Wolter, A., Zamorani, G., & Stocke, J. T. 1988, ApJ, 326, 680
- Magnier (1993) Magnier, E. A. 1993, PhD thesis, Massachusetts Inst. of Tech.
- Magnier et al. (1992) Magnier, E. A., Lewin, W. H. G., van Paradijs, J., et al. 1992, A&AS, 96, 379
- Magnier et al. (1995) Magnier, E. A., Prins, S., van Paradijs, J., et al. 1995, A&AS, 114, 215
- Massey et al. (2007) Massey, P., McNeill, R. T., Olsen, K. A. G., et al. 2007, AJ, 134, 2474
- Massey et al. (2006) Massey, P., Olsen, K. A. G., Hodge, P. W., et al. 2006, AJ, 131, 2478
- McClintock & Remillard (2006) McClintock, J. E. & Remillard, R. A. 2006, Black hole binaries, ed. W. H. G. Lewin & M. van der Klis (Cambridge University Press), 157
- Meusinger et al. (2010) Meusinger, H., Henze, M., Birkle, K., et al. 2010, A&A, 512, A1
- Misanovic et al. (2006) Misanovic, Z., Pietsch, W., Haberl, F., et al. 2006, A&A, 448, 1247
- Monet et al. (2003) Monet, D. G., Levine, S. E., Canzian, B., et al. 2003, AJ, 125, 984
- Mould et al. (2008) Mould, J., Barmby, P., Gordon, K., et al. 2008, ApJ, 687, 230
- Mushotzky et al. (2000) Mushotzky, R. F., Cowie, L. L., Barger, A. J., & Arnaud, K. A. 2000, Nature, 404, 459
- Nedialkov et al. (2002) Nedialkov, P., Orio, M., Birkle, K., et al. 2002, A&A, 389, 439
- Orio (2006) Orio, M. 2006, ApJ, 643, 844
- Orio et al. (2010) Orio, M., Nelson, T., Bianchini, A., Di Mille, F., & Harbeck, D. 2010, ApJ, 717, 739
- Osborne et al. (2001) Osborne, J. P., Borozdin, K. N., Trudolyubov, S. P., et al. 2001, A&A, 378, 800
- Pietsch (2010) Pietsch, W. 2010, Astronomische Nachrichten, 331, 187
- Pietsch et al. (2006) Pietsch, W., Burwitz, V., Greiner, J., et al. 2006, The Astronomer’s Telegram, 850, 1
- Pietsch et al. (2005a) Pietsch, W., Fliri, J., Freyberg, M. J., et al. 2005a, A&A, 442, 879 (PFF2005)
- Pietsch et al. (2005b) Pietsch, W., Freyberg, M., & Haberl, F. 2005b, A&A, 434, 483 (PFH2005)
- Pietsch & Haberl (2005) Pietsch, W. & Haberl, F. 2005, A&A, 430, L45 (PH2005)
- Pietsch et al. (2007) Pietsch, W., Haberl, F., Sala, G., et al. 2007, A&A, 465, 375
- Pietsch et al. (2004) Pietsch, W., Misanovic, Z., Haberl, F., et al. 2004, A&A, 426, 11
- Pooley (1969) Pooley, G. G. 1969, MNRAS, 144, 101
- Primini et al. (1993) Primini, F. A., Forman, W., & Jones, C. 1993, ApJ, 410, 615 (PFJ93)
- Quimby et al. (2005) Quimby, R., Mondol, P., Hoeflich, P., Wheeler, J. C., & Gerardy, C. 2005, The Astronomer’s Telegram, 600, 1
- Quimby (2006) Quimby, R. M. 2006, PhD thesis, University of Texas at Austin
- Read et al. (2006) Read, A. M., Sembay, S. F., Abbey, T. F., & Turner, M. J. L. 2006, in ESA Special Publication, Vol. 604, The X-ray Universe 2005, ed. A. Wilson, 925
- Revnivtsev et al. (2006) Revnivtsev, M., Sazonov, S., Gilfanov, M., Churazov, E., & Sunyaev, R. 2006, A&A, 452, 169
- Rich et al. (2005) Rich, R. M., Corsi, C. E., Cacciari, C., et al. 2005, AJ, 129, 2670
- Sarajedini et al. (2007) Sarajedini, A., Barker, M. K., Geisler, D., Harding, P., & Schommer, R. 2007, AJ, 133, 290
- Schmitt (2000) Schmitt, J. H. M. M. 2000, in Reviews in Modern Astronomy, ed. R. E. Schielicke, Vol. 13, 115
- Sharov & Alksnis (1998) Sharov, A. S. & Alksnis, A. 1998, Astronomy Letters, 24, 641
- Shaw Greening et al. (2009) Shaw Greening, L., Barnard, R., Kolb, U., Tonkin, C., & Osborne, J. P. 2009, A&A, 495, 733 (SBK2009)
- Skrutskie et al. (2006) Skrutskie, M. F., Cutri, R. M., Stiening, R., et al. 2006, AJ, 131, 1163
- Smirnova et al. (2006) Smirnova, O., Alksnis, A., & Zharova, A. V. 2006, Information Bulletin on Variable Stars, 5737, 1
- Stanek & Garnavich (1998) Stanek, K. Z. & Garnavich, P. M. 1998, ApJ, 503, L131
- Stark et al. (1992) Stark, A. A., Gammie, C. F., Wilson, R. W., et al. 1992, ApJS, 79, 77
- Stiele et al. (2010) Stiele, H., Pietsch, W., Haberl, F., et al. 2010, Astronomische Nachrichten, 331, 212
- Stiele et al. (2008) Stiele, H., Pietsch, W., Haberl, F., & Freyberg, M. 2008, A&A, 480, 599 (SPH2008)
- Stiele et al. (2007) Stiele, H., Pietsch, W., Haberl, F., Freyberg, M., & Trigo, M. D. 2007, The Astronomer’s Telegram, 1191, 1
- Supper et al. (2001) Supper, R., Hasinger, G., Lewin, W. H. G., et al. 2001, A&A, 373, 63
- Supper et al. (1997) Supper, R., Hasinger, G., Pietsch, W., et al. 1997, A&A, 317, 328
- Trinchieri & Fabbiano (1991) Trinchieri, G. & Fabbiano, G. 1991, ApJ, 382, 82 (TF91)
- Trudolyubov & Priedhorsky (2004) Trudolyubov, S. & Priedhorsky, W. 2004, ApJ, 616, 821
- Trudolyubov et al. (2002) Trudolyubov, S., Priedhorsky, W., Borozdin, K., Mason, K., & Cordova, F. 2002, IAU Circ., 7798, 2
- Trudolyubov et al. (2006) Trudolyubov, S., Priedhorsky, W., & Cordova, F. 2006, ApJ, 645, 277 (TPC06)
- Trudolyubov & Priedhorsky (2008) Trudolyubov, S. P. & Priedhorsky, W. C. 2008, ApJ, 676, 1218
- Urry & Padovani (1995) Urry, C. M. & Padovani, P. 1995, PASP, 107, 803
- van den Heuvel et al. (1992) van den Heuvel, E. P. J., Bhattacharya, D., Nomoto, K., & Rappaport, S. A. 1992, A&A, 262, 97
- van Speybroeck et al. (1979) van Speybroeck, L., Epstein, A., Forman, W., et al. 1979, ApJ, 234, L45
- Verbunt & van den Heuvel (1995) Verbunt, F. & van den Heuvel, E. P. J. 1995, in X-ray binaries, ed. W. H. G. Lewin, J. van Paradijs, & E. P. J. van den Heuvel (Cambridge University Press), 457
- Voss & Gilfanov (2007) Voss, R. & Gilfanov, M. 2007, A&A, 468, 49
- Voss et al. (2008) Voss, R., Pietsch, W., Haberl, F., et al. 2008, A&A, 489, 707
- Walterbos & Braun (1992) Walterbos, R. A. M. & Braun, R. 1992, A&AS, 92, 625
- Walterbos et al. (1985) Walterbos, R. A. M., Brinks, E., & Shane, W. W. 1985, A&AS, 61, 451
- Watson et al. (2009) Watson, M. G., Schröder, A. C., Fyfe, D., et al. 2009, A&A, 493, 339
- Wheelock et al. (1994) Wheelock, S. L., Gautier, T. N., Chillemi, J., et al. 1994, NASA STI/Recon Technical Report N, 95, 22539
- Williams et al. (2004) Williams, B. F., Garcia, M. R., Kong, A. K. H., et al. 2004, ApJ, 609, 735
- Williams et al. (2005a) Williams, B. F., Garcia, M. R., Kong, A. K. H., Primini, F. A., & Murray, S. S. 2005a, ApJ, 620, 723
- Williams et al. (2005b) Williams, B. F., Garcia, M. R., McClintock, J. E., Primini, F. A., & Murray, S. S. 2005b, ApJ, 632, 1086
- Williams et al. (2006a) Williams, B. F., Garcia, M. R., McClintock, J. E., Primini, F. A., & Murray, S. S. 2006a, ApJ, 637, 479 (WGM06)
- Williams et al. (2006b) Williams, B. F., Naik, S., Garcia, M. R., & Callanan, P. J. 2006b, ApJ, 643, 356
- Wilms et al. (2000) Wilms, J., Allen, A., & McCray, R. 2000, ApJ, 542, 914
- Yan et al. (1998) Yan, M., Sadeghpour, H. R., & Dalgarno, A. 1998, ApJ, 496, 1044
| Source | fvar | svar | fmax‡ | efmax‡ | class+ | Comment† |
|---|---|---|---|---|---|---|
| 523 | 692.64 | 63.33 | 106.61 | 1.68 | XRB | |
| 1 032 | 660.61 | 54.21 | 33.89 | 0.62 | GlC | 1(t, 92.2), 11, 16, 27(831.10) |
| 57 | 644.03 | 96.796 | 147.76 | 1.52 | XRB | |
| 1 131 | 558.48 | 80.18 | 38.93 | 0.48 | XRB | 1(t, 954.2), 2(t, 2163), 19, 20(t), 22, 26, 27(624.05) |
| 944 | 236.47 | 44.74 | 24.24 | 0.54 | XRB | 1(t, 370.5), 14(t, BH-XRN), 20(t), 21(v,t), 26, 27(353.67) |
| 705 | 185.02 | 39.85 | 32.52 | 0.81 | XRB | 3(t), 27(178.79) |
| 1 007 | 161.84 | 42.33 | 44.30 | 1.04 | XRB | 1, 12, 13, 26, 27(12.96) |
| 1 195 | 144.47 | 36.95 | 28.51 | 0.76 | SSS | 2(t, 694), 14(v,t), 20(t), 26, 27(82.68) |
| 1 152 | 123.95 | 55.31 | 31.86 | 0.56 | XRB | 1(t, 96.3), 2(t, 107), 9, 11(v), 12, 13(v), 19, 21(v,t), 26, |
| 27(131.73) | ||||||
| 788 | 117.83 | 20.99 | 12.27 | 0.58 | XRB | 1(t, 20.8), 2(t, 93), 11, 14(t), 20(t), 26, 27(97.89) |
| 1 136 | 87.84 | 25.00 | 9.79 | 0.39 | XRB | 1(t, 46.1), 2(t, 155), 19, 20(t), 23, 26, 27(97.65) |
| 934 | 84.94 | 28.35 | 21.26 | 0.90 | SSS | |
| 949 | 80.16 | 25.55 | 17.75 | 0.68 | XRB | 2(t, 13), 20, 25, 26 |
| 1 194 | 75.22 | 39.69 | 12.79 | 0.31 | SSS | 1, 2(t, 96), 9, 12, 13(v), 14(v), 19(v), 21(v), 26, 27(85.93) |
| 1 416 | 72.25 | 21.00 | 10.51 | 0.49 | SSS | 26, 28 |
| 1 084 | 59.11 | 8.70 | 6.64 | 0.75 | XRB | 1(t, 79.0), 2(t, 260), 14(t), 18, 20(t), 21(v,t), 26, 27(57.41) |
| 985 | 51.66 | 80.00 | 80.46 | 0.97 | XRB | 3(t), 5(t, LMXB), 9, 21(v), 27(76.27) |
| 1 017 | 49.85 | 20.73 | 9.64 | 0.45 | XRB | 1(t, 99.5), 2(t, 158), 21(v,t), 26, 27(38.07) |
| 990 | 48.90 | 61.77 | 82.16 | 1.28 | XRB | 1(t, 468.8), 2(t, 285), 14(v,t, BH-XRT), 18(t), 21(v,t), 26, 27(201.71) |
| 1 059 | 48.10 | 23.64 | 9.16 | 0.37 | XRB | 1(t, 64.6), 27(39.69) |
| 698 | 41.20 | 18.73 | 9.33 | 1.37 | XRB | 13, 23, 26, 27(44.67) |
| 884 | 32.88 | 9.59 | 2.84 | 0.61 | XRB | 1, 27(24.95) |
| 1 153 | 31.06 | 17.96 | 4.22 | 0.22 | XRB | 1(t), 3(t), 6(t, LMXB), 27(30.50) |
| 1 000 | 26.86 | 20.17 | 5.75 | 0.48 | 1(t), 19, 21, 23, 26, 27(34.47) | |
| 1 024 | 25.66 | 78.46 | 144.02 | 1.89 | XRB | 1, 9, 11, 12, 13, 19, 21(v), 26, 27(34.02) |
| 1 177 | 24.00 | 19.31 | 4.59 | 0.22 | XRB | 3(t), 27(27.06) |
| 939 | 22.48 | 10.13 | 2.20 | 0.20 | XRB | 1(t, 65.2), 27(28.02) |
| 960 | 21.56 | 9.497 | 5.51 | 0.55 | fg Star | 1, 12, 13, 19, 21, 23, 26, 27(21.97) |
| 1 180 | 16.48 | 17.16 | 7.53 | 0.40 | XRB | 1, 12, 19, 21(v), 26, 27(13.01) |
| 378 | 16.21 | 9.39 | 6.83 | 0.98 | XRB | 25, 26 |
| 714 | 14.89 | 13.77 | 10.35 | 0.68 | fg Star | |
| 748 | 14.45 | 13.86 | 3.62 | 0.23 | SSS | 25, 26, 27(14.18) |
| 92 | 14.23 | 5.73 | 1.86 | 0.30 | SSS | |
| 814 | 13.66 | 7.98 | 4.94 | 0.56 | XRB | 1, 21(v), 25, 26, 27(15.76) |
| 1 006 | 11.30 | 14.34 | 1.44 | 0.08 | SSS | 2(t, 51), 19, 23, 26, 27(10.70) |
| 542 | 10.90 | 3.26 | 2.50 | 0.69 | XRB | |
| 1 016 | 10.46 | 20.66 | 6.37 | 0.26 | XRB | 1, 11 ,12, 19, 21, 26, 27(11.69) |
| 1 144 | 10.23 | 10.53 | 1.54 | 0.12 | SSS | 2(t, 38), 26, 27(10.05) |
| 1 034 | 10.11 | 28.93 | 9.81 | 0.28 | XRB | 1, 19, 21, 23, 27(10.24) |
| 1 099 | 9.95 | 4.50 | 5.12 | 1.01 | hard | 25, 26 |
| 904 | 9.16 | 8.65 | 8.55 | 0.84 | hard | 12, 26 |
| 872 | 9.13 | 17.16 | 7.31 | 0.38 | GlC | 1, 7, 19 , 21(v), 26, 27(7.48) |
| 1 422 | 9.06 | 2.99 | 1.87 | 0.55 | hard | |
| 1 183 | 7.66 | 11.93 | 8.43 | 0.57 | hard | 12, 13, 26 |
| 422 | 7.23 | 9.65 | 2.10 | 0.16 | hard | 13 |
| 823 | 7.16 | 28.29 | 20.25 | 1.30 | GlC | 1, 4, 11, 14(v), 15, 19, 21(v), 26, 27(6.45) |
| 1 250 | 6.94 | 2.80 | 0.89 | 0.27 | SSS | |
| 398 | 6.79 | 2.93 | 1.79 | 0.52 | hard | 13, 26 |
| 1 266 | 6.67 | 7.54 | 2.37 | 0.24 | GlC | 4, 26, 27(8.27) |
| 975 | 6.58 | 7.98 | 1.76 | 0.35 | GlC | 1, 4, 13, 15, 19, 20, 21(v), 26 |
| 522 | 6.47 | 6.62 | 2.21 | 0.26 | hard | |
| 805 | 6.22 | 3.66 | 0.96 | 0.21 | hard | |
| 916 | 6.21 | 3.73 | 2.00 | 0.44 | hard | |
| 862 | 6.17 | 5.33 | 1.38 | 0.20 | GlC | 1, 4, 15, 21, 26, 27(5.35) |
| 1 124 | 6.04 | 12.93 | 5.73 | 0.23 | GlC | 1, 19, 20, 21(v), 26 |
| 430 | 5.98 | 4.95 | 1.01 | 0.16 | hard | |
| 1 825 | 5.57 | 6.11 | 2.97 | 0.39 | fg Star | 13, 26 |
| 1 494 | 5.55 | 4.06 | 0.95 | 0.18 | hard | 26 |
| 624 | 5.54 | 7.58 | 1.49 | 0.13 | fg Star | |
| 1 167 | 5.44 | 7.69 | 3.22 | 0.57 | hard | 1, 19, 20, 21(v), 26 |
| 1 450 | 5.44 | 6.51 | 2.24 | 0.24 | hard | |
| 66 | 5.39 | 3.80 | 2.31 | 0.49 | hard | |
| 1 655 | 5.34 | 4.72 | 1.50 | 0.24 | hard | |
| 964 | 5.30 | 6.36 | 1.09 | 0.12 | hard | |
| 226 | 5.28 | 3.29 | 0.56 | 0.13 | hard | |
| 244 | 5.27 | 9.08 | 3.33 | 0.28 | hard | 13, 25, 26 |
| 1 361 | 5.21 | 3.12 | 1.36 | 0.34 | hard | 27 |
| 933 | 5.19 | 4.99 | 8.73 | 1.30 | GlC | 4, 11, 12, 25, 26 |
| 1 366 | 5.13 | 3.02 | 1.05 | 0.27 | hard |
Notes:
: maximum flux and error in units of 1 erg cm-2 s-1 or maximum luminosity and error in units of 7.3 erg s-1
: class according to Table 6
: 1: Voss & Gilfanov (2007), 2: Williams et al. (2006b), 3: Trudolyubov et al. (2006), 4: Trudolyubov & Priedhorsky (2004), 5: Williams et al. (2006a), 6: Williams et al. (2005b), 7: Pietsch & Haberl (2005), 8: Kong et al. (2003), 9: Trinchieri & Fabbiano (1991), 10: Collura et al. (1990), 11: Primini et al. (1993), 12: Supper et al. (1997), 13: Supper et al. (2001), 14: Osborne et al. (2001), 15: Di Stefano et al. (2002), 16: Fan et al. (2005), 17: Pietsch et al. (2007), 18: Garcia et al. (2000), 19: Kaaret (2002), 20: Williams et al. (2004), 21: Kong et al. (2002b), 22: Williams et al. (2005a), 23: Di Stefano et al. (2004), 24: Barnard et al. (2003), 25: Shaw Greening et al. (2009), 26: Pietsch et al. (2005b), 27: Stiele et al. (2008), 28: Trudolyubov et al. (2002) ; t: transient, v: variable, sv: spectrally variable, r: recurrent, d: dipping, z: Z-source candidate; BH: black hole, XRN: X-ray nova, XRT: X-ray transient, LMXB: low mass X-ray binary, NS: neutron star; numbers indicate the variability given by the corresponding paper