Imaging of the CCS GHz emission in the Taurus Molecular Cloud complex
Abstract
Thioxoethenylidene (CCS) is an abundant interstellar molecule, and a good tracer of high density and evolutionary stage of dense molecular clouds. It is also a suitable candidate for Zeeman splitting observations for its high splitting factor and narrow thermal linewidths. We report here EVLA GHz observations of three dense molecular cores TMC-1, TMC-1C and L1521B in the Taurus Molecular Cloud complex to image the CCS transition. For all three sources, the clumpy CCS emission is most likely tracing the starless cores. However, these compact structures account for only of the integrated emission detected in single-dish observations, indicating the presence of significant large scale diffuse emission in favorable conditions for producing CCS.
Subject headings:
ISM: general — ISM: individual objects (L1521B, TMC-1, TMC-1C) — ISM: molecules — radio lines: ISM1. Introduction
Understanding the process of star formation is one of the challenging problems of modern astrophysics. In spite of significant progress in both theoretical and observational studies of the subject, there are unsolved questions about the driving and regulatory mechanisms of star formation. To critically test different star formation theories, it is important to have detailed knowledge of physical properties, e.g. structure and kinematics, temperature, density, and chemical abundances of different phases of molecular clouds and star forming cores. A good tracer of high density molecular clouds is the thioxoethenylidene (CCS) molecule, which has transitions with intrinsically narrow thermal linewidths. Therefore, observation of CCS can be utilized to probe physical properties and to better understand the star formation process.
With the m telescope of Nobeyama Radio Observatory, Suzuki et al. (1984) and Kaifu et al. (1987) were the first to detect unknown spectral lines from astronomical sources at and GHz, which were later identified by laboratory microwave spectroscopy to be the CCS and transitions, respectively (Saito et al., 1987). Chemical evolution models (Aikawa et al., 2001, 2005) along with further single-dish observations (e.g. Suzuki et al., 1992; Lai & Crutcher, 2000) of starless cores reveal that CCS is abundant in the initial phase of molecular gas (before the onset of gravitational collapse). For a discussion on the formation pathways of CCS and its impact on astrochemistry, see Sakai et al. (2007, and references therein). CCS transitions have moderate optical depth and very narrow thermal linewidths with no hyperfine splittings. All these characteristics make CCS an ideal probe of the structure and dynamics of dark molecular clouds.
To date, most of the observational studies of CCS were done using single-dish radio telescopes (e.g. Fuente et al., 1990; Suzuki et al., 1992; Scappini & Codella, 1996; Wolkovitch et al., 1997; Benson et al., 1998; Hirota et al., 2002, 2004; Tatematsu et al., 2010), while radio interferometric observation of CCS is sparse. Earlier, Velusamy et al. (1995) and Kuiper et al. (1996) combined single-dish and the Very Large Array (VLA) GHz interferometric data to image CCS in two protostellar cores B335 and L1498. The Berkeley Illinois Maryland Association (BIMA) array was used by Ohashi et al. (1999) to study the CCS GHz transition in the starless core L1544, and by Lai & Crutcher (2000) to observe 11 other molecular cores. The BIMA array was also used by Kuan & Snyder (1994) to observe the CCS GHz emission from Sgr B2. The VLA have been used by De Gregorio-Monsalvo et al. (2005), Hirota et al. (2010) and Devine et al. (2011) to observe the CCS GHz line in the star-forming region B1-IRS, the protostellar core L483, and the infrared dark cloud G, respectively.
2. Observation and Analysis
The EVLA observations were carried out on October 05, 2010 during the move time from DnC to C array configuration (DnC C). The EVLA K-band centered at the CCS 22.3 GHz transition was used with a total bandwidth of MHz and 256 spectral channels. The resulting spectral resolution was kHz ( km s-1). was observed for flux calibration. The calibrator sources J (for TMC-1 and TMC-1C) and J (for L1521B) were used to calibrate the complex gains, and were observed for minute for every minute time on the target source. Total observation time was hours per source resulting in an on-source time of hour for each target.
Data analysis was carried out using the NRAO Astronomical Image Processing System (AIPS). After removing bad data, the flux density scale and instrumental phases were calibrated. Phase only calibration solutions were obtained first, followed by amplitude and phase calibration with longer solution intervals. The target source data were then split after applying the calibration solutions, and were used to make image cubes to check for the CCS emission. No continuum emission was detected in either high or low resolution images of the target fields. Multiscale imaging with natural weighting was used to make final emission line image cubes with restoring beam sizes of , and . From the image cubes, moment maps were made with a flux cutoff. Integrated spectra for the region corresponding to the moment maps were extracted. The channel maps were used to study the structure of the emission regions.
3. Results
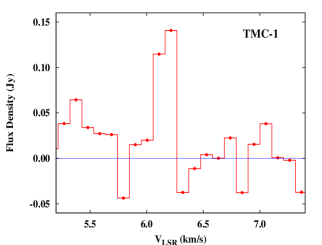
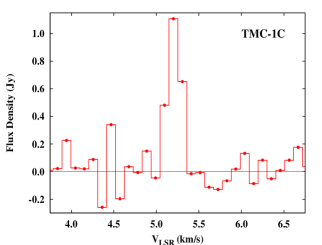
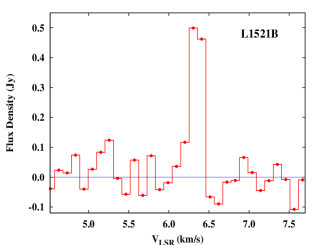
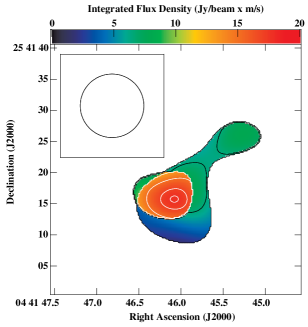
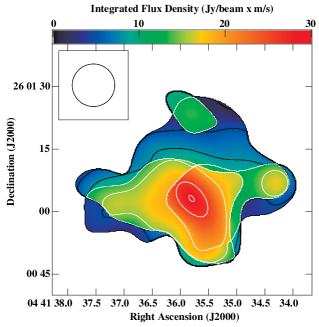
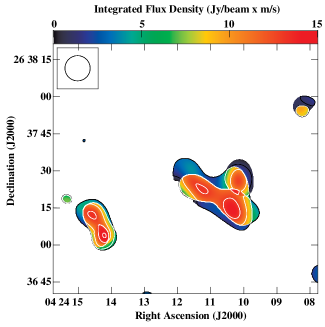
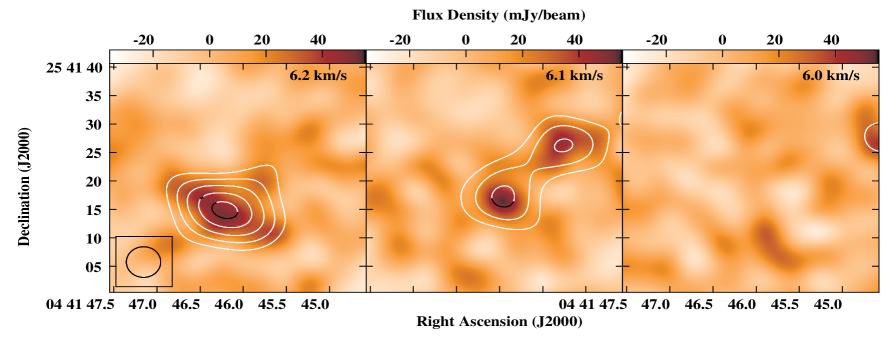
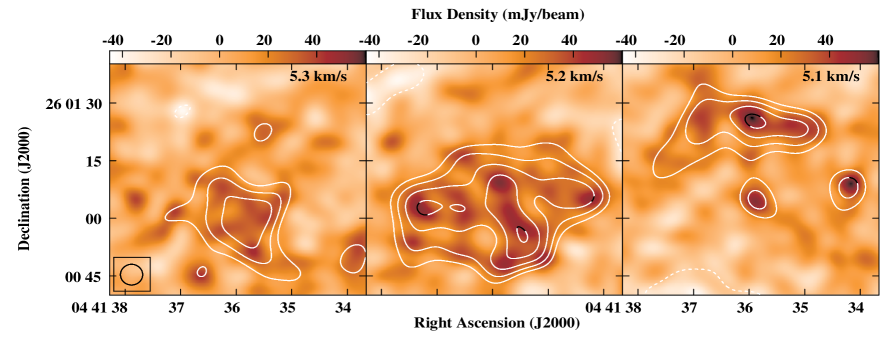
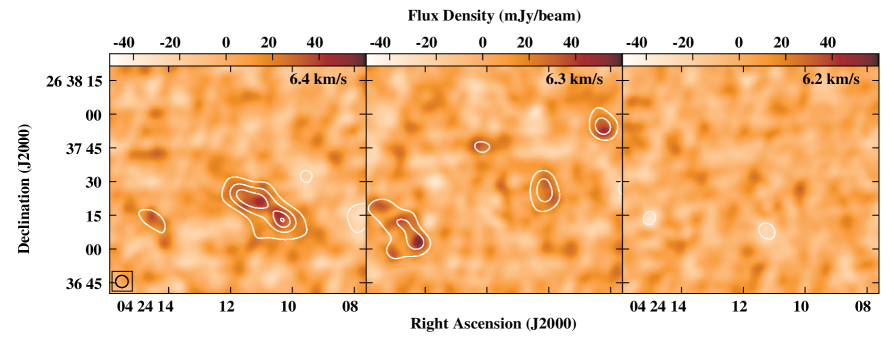
CCS GHz transition is detected in emission for all of these three sources. Their spectra are shown in Figure (1) top panels, and the integrated CCS emission (“moment 0”) maps with a restoring beam size of are shown in bottom panels. The peak line flux densities detected in the EVLA observations are approximately , and Jy for TMC-1, TMC-1C and L1521B, corresponding to , , K respectively. Channel maps showing the CCS emission are presented in Figure (2). The color images are at resolution overlaid on corresponding contours from the resolution images. As expected, the emission is confined within km s-1 velocity width. Both the integrated and channel maps show prominent clumpy emission structures more likely tracing the highest density regions in the molecular cores. These structures are more clearly visible in the resolution images where much of the extended diffuse emission is resolved out. For a typical excitation temperature of K (Suzuki et al., 1992; Devine et al., 2011), the CCS column densities are cm-2. Assuming a fractional abundance of for CCS (Lai & Crutcher, 2000), the resulting H2 column densities are cm-2. If the line of sight extent of the cores are similar to their extent on the plane of the sky, then the corresponding H2 number densities will be cm-3. This is consistent with the fact that CCS is excited at densities in the range of cm-3 (Wolkovitch et al., 1997). We note that the CCS emission may come either the dense starless cores in the early stages of star formation, or the core envelopes in the later stages (Lai & Crutcher, 2000). For these sources, we do not see any envelope or ring-like structures in CCS emission, suggesting that the clumps are actually tracing starless cores.
We also note that, using a conversion factor of Jy K-1 (Takahashi et al., 2010) for the Nobeyama m telescope, the single-dish integrated flux densities of the GHz emission are , and Jy km s-1 for TMC-1, TMC-1C and L1521B respectively (Suzuki et al., 1992). This implies that only of the emission is in the compact structures seen with the EVLA. The rest of the emission that is resolved out by the EVLA is most likely arising from large scale structures greater than (corresponding to the the shortest baseline of k of DnC C array observations). For example, the source L1521B was mapped with a single-dish (Hirota et al., 2004), and found to have large scale emission over an area of , which is several times larger than the shortest spacing of our observation.
4. Discussions
Apart from being a tracer of high density, the CCS molecule is a good indicator of age for dense molecular clouds. It is now well-established that molecular clouds in different stages of the pre-stellar evolution have different molecular abundances. Younger cores are rich in carbon-chain molecules such as CCS and HC3N, while more evolved cores (close to the protostellar formation via gravitational collapse) are rich in late-type molecules such as NH3, N2H+ and CN (Suzuki et al., 1992; Crapsi et al., 2005; Hily-Blant et al., 2010). Therefore, the ratio of the column densities of NH3 and CCS is a good tracer for the age of the dark clouds. Similarly, the C18O to CCS column density ratio indicates the production efficiency of CCS-like carbon-chain molecules in different physical conditions.
Based on the Nobeyama m telescope observations, is , , and for L1521B, TMC-1 and TMC-1C, respectively (Suzuki et al., 1992), showing that they are in different phases between young “dense core” and “core with star formation”. Ordering by the age, L1521B is in an early phase, TMC-1 is moderately old and TMC-1C is in a late phase of the pre-stellar evolution. The C18O to CCS column density ratio is , , for L1521B, TMC-1 and TMC-1C respectively (Benson & Myers, 1983; Suzuki et al., 1992; Hirota et al., 2004). Interestingly, the fraction of CCS single-dish flux detected with EVLA in the clumpy structures increases with increasing ratio for these lines of sight, but it does not correlate with the age of the cores. For high , the CCS emission is slightly clumpy, whereas for low , i.e. in favorable conditions of CCS production, the emission is more diffuse. This may be indicative of the fact that in favorable conditions, CCS is formed on and spread over large diffuse regions. Future observations of more sources with the EVLA, simultaneously covering NH3 and CCS transitions, may be useful to check the statistical significance of this trend.
The other reason that makes CCS an interesting molecule is the high Zeeman splitting factor of its GHz transitions (Shinnaga & Yamamoto, 2000). For example, the Zeeman splitting factor of CCS GHz transition is Hz Gauss-1. This, along with its intrinsically narrow thermal linewidths, make CCS a suitable candidate to determine the line of sight component of the local magnetic field in dense molecular clouds, particularly in preprotostellar cores. Systematic measurement of the magnetic field strengths and the mass-to-flux ratios in molecular clouds at different phases of the star formation process and at different densities may play a crucial role in constraining the theories of star formation. So far, with single-dish observations, Shinnaga et al. (1999) have reported a marginal detection of Zeeman splitting of CCS transition, and Levin et al. (2001) have reported a tentative detection of Zeeman splitting of CCS transition. The improved sensitivity and capabilities of the EVLA at high frequencies have now opened the opportunity of carrying out sensitive interferometric observation for the thermal line Zeeman splitting using CCS transitions. From dust polarization measurements, the magnetic field towards starless cores in the TMC is estimated to be G (Crutcher et al., 2004; Kirk et al., 2006). With the present EVLA sensitivity, the median magnetic field of G would be detected at level in 36 hours of on-source time, whereas only 9 hours is sufficient to detect the strongest magnetic fields (G) for TMC-1C using the Zeeman splitting of the CCS GHz transition. In this context, it is important to first identify suitable lines of sight with strong CCS emission and adequate flux in compact components for Zeeman splitting observations. In the near future, we plan to carry out further observations of candidate sources to identify possible targets for a CCS Zeeman splitting survey with the EVLA.
5. Conclusions
EVLA observations of three dense molecular cores TMC-1, TMC-1C and L1521B in the Taurus Molecular Cloud complex were carried out to image CCS emission from these regions. CCS GHz narrow emission line is detected for all of these three sources. The emission is found to have prominent clumpy structures most likely tracing the high density regions in the starless cores. Only of the integrated emission detected in previous single-dish observations comes from these compact emission structures. This indicates that most of the CCS emission comes from low surface density extended structures. The unresolved fraction of CCS is correlated with ratio for these three lines of sight, suggesting more extended distribution CCS in favorable conditions for producing CCS. Such exploratory observations to image CCS in dense clouds are important to identify suitable target sources for future EVLA Zeeman splitting observations.
Disclaimer: This is an author-created, un-copyedited version of an article accepted for publication in the Astrophysical Journal Letters. IOP Publishing Ltd is not responsible for any errors or omissions in this version of the manuscript or any version derived from it. The definitive publisher authenticated version will be available online at http://iopscience.iop.org/.
References
- Aikawa et al. (2005) Aikawa, Y., Herbst, E., Roberts, H., & Caselli, P. 2005, ApJ, 620, 330
- Aikawa et al. (2001) Aikawa, Y., Ohashi, N., Inutsuka, S., Herbst, E., & Takakuwa, S. 2001, ApJ, 552, 639
- Benson et al. (1998) Benson, P. J., Caselli, P., & Myers, P. C. 1998, ApJ, 506, 743
- Benson & Myers (1983) Benson, P. J., & Myers, P. C. 1983, ApJ, 270, 589
- Crapsi et al. (2005) Crapsi, A., Caselli, P., Walmsley, C. M., Myers, P. C., Tafalla, M., Lee, C. W., & Bourke, T. L. 2005, ApJ, 619, 379
- Crutcher et al. (2004) Crutcher, R. M., Nutter, D. J., Ward-Thompson, D., & Kirk, J. M. 2004, ApJ, 600, 279
- De Gregorio-Monsalvo et al. (2005) De Gregorio-Monsalvo, I., Chandler, C. J., Gómez, J. F., Kuiper, T. B. H., Torrelles, J. M., & Anglada, G. 2005, ApJ, 628, 789
- Devine et al. (2011) Devine, K. E., Chandler, C. J., Brogan, C., Churchwell, E., Indebetouw, R., Shirley, Y., & Borg, K. J. 2011, ApJ, (arXiv1103.0328)
- Elias (1978) Elias, J. H. 1978, ApJ, 224, 857
- Fuente et al. (1990) Fuente, A., Cernicharo, J., Barcia, A., & Gomez-Gonzalez, J. 1990, A&A, 231, 151
- Hily-Blant et al. (2010) Hily-Blant, P., Walmsley, M., Pineau Des Forêts, G., & Flower, D. 2010, A&A, 513, A41
- Hirota et al. (2010) Hirota, T., Sakai, N., & Yamamoto, S. 2010, ApJ, 720, 1370
- Hirota et al. (2004) Hirota, T., Maezawa, H., & Yamamoto, S. 2004, ApJ, 617, 399
- Hirota et al. (2002) Hirota, T, Ito, T., & Yamamoto, S. 2002, ApJ, 565, 359
- Kaifu et al. (1987) Kaifu, N., Suzuki, H., Ohishi, M., Miyaji, T., Ishikawa, S.-I., Kasuga, T., Morimoto, M., & Saito, S. 1987, ApJ, 317, L111
- Kirk et al. (2006) Kirk, J. M., Ward-Thompson, D., & Crutcher, R. M. 2006, MNRAS, 369, 1445
- Kuan & Snyder (1994) Kuan, Y.-J., & Snyder, L. E. 1994, ApJS, 94, 651
- Kuiper et al. (1996) Kuiper, T. B. H., Langer, W. D., & Velusamy, T. 1996, ApJ, 468, 761
- Lai & Crutcher (2000) Lai, S., & Crutcher, R. M. 2000, ApJS, 128, 271
- Levin et al. (2001) Levin, S. M., Langer, W. D., Velusamy, T., Kuiper, T. B. H., & Crutcher, R. M. 2001, ApJ, 555, 850
- Ohashi et al. (1999) Ohashi, N., Lee, S. W., Wilner, D. J., & Hayashi, M. 1999, ApJ, 518, L41
- Perley et al. (2011) Perley, R. A., Chandler, C. J., Butler, B. J., & Wrobel, J. M. 2011, ApJ Letters, in press
- Saito et al. (1987) Saito, S., Kawaguchi, K., Yamamoto, S., Ohishi, M., & Suzuki, H. 1987, ApJ, 317, L115
- Sakai et al. (2007) Sakai, N., Ikeda, M., Morita, M., Sakai, T., Takano, S., Osamura, Y., & Yamamoto, S. 2007, ApJ, 663, 1174
- Scappini & Codella (1996) Scappini, F., & Codella, C. 1996, MNRAS, 282, 587
- Shinnaga & Yamamoto (2000) Shinnaga, H., & Yamamoto, S. 2000, ApJ, 544, 330
- Shinnaga et al. (1999) Shinnaga, H., Tsuboi, H., & Kasuga, T. 1999, Star Formation 1999, ed. T. Nakamoto (Nobeyama: Nobeyama Radio Obs.), 175
- Suzuki et al. (1992) Suzuki, H., Yamamoto, S., Ohishi, M., Kaifu, N., Ishikawa, S.-I., Hirahara, Y. & Takano, S. 1992, ApJ, 392, 551
- Suzuki et al. (1984) Suzuki, H., Kaifu, N., Miyaji, T., Morimoto, M., Ohishi, M., & Saito, S. 1984, ApJ, 282, 197
- Takahashi et al. (2010) Takahashi, S., Deguchi, S., Kuno, N., Shimoikura, T., & Yoshida, F. 2010, PASJ, 62, L17
- Tatematsu et al. (2010) Tatematsu, K., Hirota, T., Kandori, R., & Umemoto, T. 2010, PASJ, 62, 1473
- Velusamy et al. (1995) Velusamy, T., Kuiper, T. B. H., & Langer, W. D. 1995, ApJ, 451, L75
- Wolkovitch et al. (1997) Wolkovitch, D., Langer, W. D., Goldsmith, P. F., & Heyer, M. 1997, ApJ, 477, 241