R. Ogata
Department of Physics, Saga University, Saga, 840-8502 Japan
S. Suzuki
Department of Physics, Saga University, Saga, 840-8502 Japan
J. K. Ahn
Department of Physics, Pusan National University, Busan, 609-735 Republic of Korea
Y. Akune
Department of Physics, Saga University, Saga, 840-8502 Japan
V. Baranov
Laboratory of Nuclear Problems, Joint Institute for Nuclear Research,
Dubna, Moscow Region, 141980 Russia
K. F. Chen
Department of Physics, National Taiwan University, Taipei, Taiwan 10617 Republic of China
J. Comfort
Department of Physics and Astronomy, Arizona State University, Tempe, Arizona, USA
M. Doroshenko
Present address: Laboratory of Nuclear Problems, Joint Institute for Nuclear Research,
Dubna, Moscow Region, 141980 Russia
Department of Particle and Nuclear Research,
The Graduate University for Advanced Science (SOKENDAI), Tsukuba, Ibaraki, 305-0801 Japan
Y. Fujioka
Department of Physics, Saga University, Saga, 840-8502 Japan
Y. B. Hsiung
Department of Physics, National Taiwan University, Taipei, Taiwan 10617 Republic of China
T. Inagaki
Department of Particle and Nuclear Research,
The Graduate University for Advanced Science (SOKENDAI), Tsukuba, Ibaraki, 305-0801 Japan
Institute of Particle and Nuclear Studies,
High Energy Accelerator Research Organization (KEK), Tsukuba, Ibaraki, 305-0801 Japan
S. Ishibashi
Department of Physics, Saga University, Saga, 840-8502 Japan
N. Ishihara
Institute of Particle and Nuclear Studies,
High Energy Accelerator Research Organization (KEK), Tsukuba, Ibaraki, 305-0801 Japan
H. Ishii
Department of Physics, Osaka University, Toyonaka, Osaka, 560-0043 Japan
E. Iwai
Department of Physics, Osaka University, Toyonaka, Osaka, 560-0043 Japan
T. Iwata
Department of Physics, Yamagata University, Yamagata, 990-8560 Japan
I. Kato
Department of Physics, Yamagata University, Yamagata, 990-8560 Japan
S. Kobayashi
Department of Physics, Saga University, Saga, 840-8502 Japan
S. Komatsu
Department of Physics, Osaka University, Toyonaka, Osaka, 560-0043 Japan
T. K. Komatsubara
Institute of Particle and Nuclear Studies,
High Energy Accelerator Research Organization (KEK), Tsukuba, Ibaraki, 305-0801 Japan
A. S. Kurilin
Laboratory of Nuclear Problems, Joint Institute for Nuclear Research,
Dubna, Moscow Region, 141980 Russia
E. Kuzmin
Laboratory of Nuclear Problems, Joint Institute for Nuclear Research,
Dubna, Moscow Region, 141980 Russia
A. Lednev
Institute for High Energy Physics, Protvino, Moscow region, 142281 Russia
Enrico Fermi Institute, University of Chicago, Chicago, Illinois 60637, USA
H. S. Lee
Department of Physics, Pusan National University, Busan, 609-735 Republic of Korea
S. Y. Lee
Department of Physics, Pusan National University, Busan, 609-735 Republic of Korea
G. Y. Lim
Institute of Particle and Nuclear Studies,
High Energy Accelerator Research Organization (KEK), Tsukuba, Ibaraki, 305-0801 Japan
J. Ma
Enrico Fermi Institute, University of Chicago, Chicago, Illinois 60637, USA
T. Matsumura
Department of Applied Physics, National Defense Academy, Yokosuka, Kanagawa, 239-8686 Japan
A. Moisseenko
Laboratory of Nuclear Problems, Joint Institute for Nuclear Research,
Dubna, Moscow Region, 141980 Russia
H. Morii
Present address: Institute of Particle and Nuclear Studies,
High Energy Accelerator Research Organization (KEK), Tsukuba, Ibaraki, 305-0801 Japan
Department of Physics, Kyoto University, Kyoto, 606-8502 Japan
T. Morimoto
Institute of Particle and Nuclear Studies,
High Energy Accelerator Research Organization (KEK), Tsukuba, Ibaraki, 305-0801 Japan
Y. Nakajima
Department of Physics, Kyoto University, Kyoto, 606-8502 Japan
T. Nakano
Research Center of Nuclear Physics, Osaka University, Ibaraki, Osaka, 567-0047 Japan
H. Nanjo
Department of Physics, Kyoto University, Kyoto, 606-8502 Japan
N. Nishi
Department of Physics, Osaka University, Toyonaka, Osaka, 560-0043 Japan
J. Nix
Enrico Fermi Institute, University of Chicago, Chicago, Illinois 60637, USA
T. Nomura
Present address: Institute of Particle and Nuclear Studies,
High Energy Accelerator Research Organization (KEK), Tsukuba, Ibaraki, 305-0801 Japan
Department of Physics, Kyoto University, Kyoto, 606-8502 Japan
M. Nomachi
Department of Physics, Osaka University, Toyonaka, Osaka, 560-0043 Japan
H. Okuno
Institute of Particle and Nuclear Studies,
High Energy Accelerator Research Organization (KEK), Tsukuba, Ibaraki, 305-0801 Japan
K. Omata
Institute of Particle and Nuclear Studies,
High Energy Accelerator Research Organization (KEK), Tsukuba, Ibaraki, 305-0801 Japan
G. N. Perdue
Present address: University of Rochester, Rochester, NY 14627
Enrico Fermi Institute, University of Chicago, Chicago, Illinois 60637, USA
S. Perov
Laboratory of Nuclear Problems, Joint Institute for Nuclear Research,
Dubna, Moscow Region, 141980 Russia
S. Podolsky
Present address: Scarina Gomel’ State University, Gomel’, BY-246699, Belarus
Laboratory of Nuclear Problems, Joint Institute for Nuclear Research,
Dubna, Moscow Region, 141980 Russia
S. Porokhovoy
Laboratory of Nuclear Problems, Joint Institute for Nuclear Research,
Dubna, Moscow Region, 141980 Russia
K. Sakashita
Present address: Institute of Particle and Nuclear Studies,
High Energy Accelerator Research Organization (KEK), Tsukuba, Ibaraki, 305-0801 Japan
Department of Physics, Osaka University, Toyonaka, Osaka, 560-0043 Japan
T. Sasaki
Department of Physics, Yamagata University, Yamagata, 990-8560 Japan
N. Sasao
Department of Physics, Kyoto University, Kyoto, 606-8502 Japan
H. Sato
Department of Physics, Yamagata University, Yamagata, 990-8560 Japan
T. Sato
Institute of Particle and Nuclear Studies,
High Energy Accelerator Research Organization (KEK), Tsukuba, Ibaraki, 305-0801 Japan
M. Sekimoto
Institute of Particle and Nuclear Studies,
High Energy Accelerator Research Organization (KEK), Tsukuba, Ibaraki, 305-0801 Japan
T. Shimogawa
Department of Physics, Saga University, Saga, 840-8502 Japan
T. Shinkawa
Department of Applied Physics, National Defense Academy, Yokosuka, Kanagawa, 239-8686 Japan
Y. Stepanenko
Laboratory of Nuclear Problems, Joint Institute for Nuclear Research,
Dubna, Moscow Region, 141980 Russia
Y. Sugaya
Department of Physics, Osaka University, Toyonaka, Osaka, 560-0043 Japan
A. Sugiyama
Department of Physics, Saga University, Saga, 840-8502 Japan
T. Sumida
Present address: CERN, CH-1211 Genève 23, Switzerland
Department of Physics, Kyoto University, Kyoto, 606-8502 Japan
Y. Tajima
Department of Physics, Yamagata University, Yamagata, 990-8560 Japan
S. Takita
Department of Physics, Yamagata University, Yamagata, 990-8560 Japan
Z. Tsamalaidze
Laboratory of Nuclear Problems, Joint Institute for Nuclear Research,
Dubna, Moscow Region, 141980 Russia
T. Tsukamoto
Deceased.
Department of Physics, Saga University, Saga, 840-8502 Japan
Y. C. Tung
Department of Physics, National Taiwan University, Taipei, Taiwan 10617 Republic of China
Y. W. Wah
Enrico Fermi Institute, University of Chicago, Chicago, Illinois 60637, USA
H. Watanabe
Present address: Institute of Particle and Nuclear Studies,
High Energy Accelerator Research Organization (KEK), Tsukuba, Ibaraki, 305-0801 Japan
Enrico Fermi Institute, University of Chicago, Chicago, Illinois 60637, USA
M. L. Wu
Department of Physics, National Taiwan University, Taipei, Taiwan 10617 Republic of China
M. Yamaga
Present address: RIKEN SPring-8 Center, Sayo, Hyogo, 679-5148 Japan
Institute of Particle and Nuclear Studies,
High Energy Accelerator Research Organization (KEK), Tsukuba, Ibaraki, 305-0801 Japan
T. Yamanaka
Department of Physics, Osaka University, Toyonaka, Osaka, 560-0043 Japan
H. Y. Yoshida
Department of Physics, Yamagata University, Yamagata, 990-8560 Japan
Y. Yoshimura
Institute of Particle and Nuclear Studies,
High Energy Accelerator Research Organization (KEK), Tsukuba, Ibaraki, 305-0801 Japan
Y. Zheng
Enrico Fermi Institute, University of Chicago, Chicago, Illinois 60637, USA
Abstract
The rare decay was studied
with the E391a detector at the KEK 12-GeV proton synchrotron.
Based on decays, an upper limit of
was obtained for the branching fraction
at
90 confidence level.
We also set a limit on the
invisible particles) process;
the limit on the branching fraction
varied from 7.0 to 4.0
for the mass of ranging
from 50 MeV/ to 200 MeV/.
Figure 1: Schematic cross sectional view of the E391a detector. The entrance of the detector is at “0 m.”
I Introduction
In the standard electroweak theory, flavor-changing neutral
current (FCNC) processes are strongly suppressed
and can only occur via higher-order effects.
Hence, these processes will be sensitive
to unknown particles or interactions
that contribute in higher-order loop diagrams.
Such processes are ideal places to look for
signals of new physics beyond the Standard Model (SM).
In the SM, the FCNC decay
is predominantly a CP conserving process.
Its branching fraction is sensitive to the real part of the
transition amplitude, while the related
decays and
sense the imaginary part
and absolute value, respectively.
Like these decays, is
theoretically clean and uncertainties in the hadronic matrix element
can be removed by using the measured branching fraction of its relevant
semileptonic decay .
The SM predicts the branching fraction to be
LV ; ChingGilman .
Although the prediction is solid in the SM,
there is a possibility of enhancements from new physics
contributions.
In fact, phenomenological analyses give constraints
on possible enhancements by up to an order of magnitude
within the allowed range of new physics parameters
from known kaon decays, including the measured branching fraction
of ChingGilman .
In addition,
a new particle which decays into invisible particles,
can also contribute to the three body decay .
There is also a possibility of having new
pseudoscalar particles, as predicted by several
supersymmetry models.
Searches for the or modes
and comparisons with the models have been made Xrefs , and
similar test should also be tried in the final state.
The E391a experiment at the KEK 12-GeV proton synchrotron made the first
search for the decay,
based on the data sample taken in the first stage (Run-I).
An upper limit on the branching fraction of 4.7
at the 90% confidence level (C.L.) for
was obtained
Nix .
Unfortunately the Run-I data were compromised by large neutron
backgrounds from a vacuum membrane that hung in the beam.
This article is based on the E391a data taken in the
periods from February to April in 2005 (Run-II) and from November
to December in 2005 (Run-III), after correcting the problem.
These data had six times more
decays and were analyzed with improved methods.
II E391a detector
The E391a detector was primarily designed to search for
the decay e391paper ; e391paper2 .
It had a CsI calorimeter to detect two photons from a decay
and hermetic veto counters to ensure that no other visible particles
existed in the final state (Fig. 1).
To avoid backgrounds from interactions of the beam particles with air,
most of the detector components were placed in a vacuum vessel.
The CsI calorimeter consisted of 496 blocks of cm3 undoped CsI crystal.
A cm2 beam hole
was
located at the center of the
calorimeter to allow the beam particles to pass through.
The main barrel (MB) and front barrel (FB) counters were sandwiches
of lead plates and plastic-scintillation counters with 13.5
and 17.5 , respectively, and formed cylindrical walls surrounding
the decay volume.
Collar shaped counters (CC00, CC0207) were placed around
the beam line for vetoing photons along the beam axis.
Charged particles that would hit the CsI calorimeter were identified
and rejected by energy deposits in a charge veto (CV)
scintillation-counter hodoscope, located 50 cm upstream; it covered
the front face as well as the outer wall of the beam-hole area.
Beam-hole charge veto (BHCV) and back-anti (BA) counters were
located in the downstream region along the beam axis and outside
of the vacuum vessel. The BHCV consisted of eight 3-mm-thick
plastic-scintillation counters, which were arranged to fully
cover the downstream area of the beam hole.
The BA was made of six superlayers, each consisting of a
lead/scintillator sandwich and quartz blocks for Run-II.
For Run-III the BA had five superlayers, where
the lead/scintillator sandwich part was replaced
by the Lead Tungsten Oxide (PWO) crystals;
this change was the only difference in the E391a detector system
between the Run-II and Run-III periods.
Data acquisition was made with a hardware trigger that required
two or more electromagnetic showers in the CsI calorimeter
with total energy 60 MeV, and no obvious activity
in the CV and other veto counters.
Loose on-line veto requirements
were imposed, which ensured flexibility of setting
energy thresholds consistently for the real data and
the detector simulation during the off-line analysis.
The decay should produce
exactly four showers in the CsI calorimeter
and nothing else in all the other counters.
These hits should also satisfy an in-time requirement
to suppress backgrounds.
III data reduction
The experimental signature of
is four photons in the final states with a non-zero missing mass
and a transverse momentum.
Photons were registered in the CsI calorimeter as
energy deposits in adjacent blocks (clusters).
The most probable hit position of the photon was obtained from
the shower energy distribution among the CsI blocks.
Events with four photon clusters in the CsI were selected
for further off-line processing.
Reconstruction of a pair of photons was made by assuming that
they were from a that decayed on the beam axis (-axis).
Multiple pairings of four photons to reconstruct two s
were eliminated by taking the combination that gave the minimum
value in the difference in vertices.
A cut on the minimum for the common vertex
was effective for good identification.
Also, requiring a large difference in the lowest two
values was effective in reducing the combinatorial error.
We required that the common -decay vertex point
should be in the decay volume 300 cm 500 cm.
The veto conditions on the MB, CV, and collar counters were
carefully tuned.
Among these counters, the MB played a major role in vetoing
photons undetected by the CsI calorimeter.
If too low an energy-threshold was imposed for all of the MB counters,
back-splash from the CsI/CV surface and electromagnetic shower
leakage from the outer part of the CsI calorimeter to the
downstream area of the MB would cause acceptance loss.
Thus, we applied a tighter threshold to the upstream region of the MB
to detect photons with a high efficiency, and
a looser threshold to the downstream region of the MB to keep a large
acceptance for the signal yuchen2 .
Suppression of the fusion cluster (misidentification of two close-by
clusters as one cluster) was made by using the neural
network (NN) technique trained by the stand-alone photons and
the fusion clusters from the Monte Carlo
(MC) simulation sample.
Further suppression was made on the shower shape of the cluster,
and by examining the energy distribution and
its RMS fraction yuchen2 .
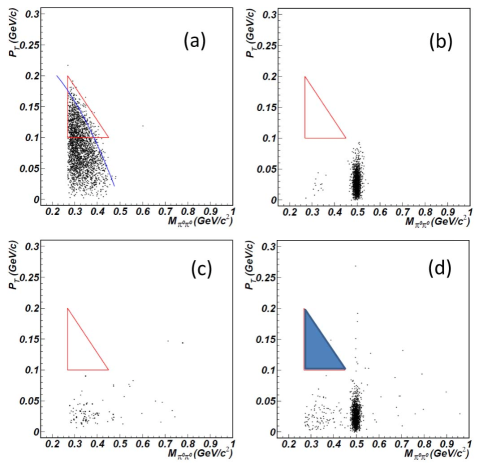
Figure 2: vs. effective mass () plots
of the system from Run-III MC simulations for
(a) ,
(b) , (c) ,
and (d) Run-III real data.
The statistics of the MC events in (b) and (c) are normalized to
those of the real data.
The signal region is defined to be inside of the triangular area
in the plots. A curved
line in (a) indicates the kinematical limit for the
decay.
IV MC simulation
A GEANT3-based geant3 MC simulation was performed
to define the signal region for
and to estimate the acceptance.
The decay
was generated with the V-A interaction, and the events were
processed with the same reconstruction code as the real data.
Among the incoming particles to the detector,
2.66 decay within the fiducial decay volume.
A total of incoming events were generated
for both Run-II and Run-III.
The generated events were overlaid with accidental hits
on the counters accumulated by special triggers
during the data taking.
After applying the selection criteria described above,
a two-dimensional distribution of the effective mass
and the transverse momentum
for the accepted events was examined.
The result
of the simulation for
in the Run-III condition is shown in Fig. 2(a).
The signal region was defined as a right triangular area shown
in Fig. 2.
The vertical edge of the triangle is located at the lower bound of
the effective mass (0.268 GeV/), and spanned the
values between 0.1 to 0.2 GeV/.
The horizontal
edge defined the lower bound of (0.1 GeV/)
to avoid contamination from the decay;
it spanned the values between 0.268 to 0.450 GeV/.
The detector acceptance was calculated by taking the ratio of the number
of events in the signal region to the number of
particles that decayed in the fiducial vertex region.
A list of the reduction factors that contributed to the acceptance
after the s decayed in the fiducial volume are summarized in
Table 1.
The acceptances obtained for Run-II and Run-III were consistent, and
the result was for each run period.
Table 1: Reduction factors
and resultant acceptances in each data reduction step (signal Monte Carlo).
Cuts
Reduction
Resultant
factor
acceptance
decay in the fiducial volume
1.00
+ hardware trigger & four-cluster-
candidate in the CsI calorimeter
0.0499
+ tighter CsI fiducial
0.616
+ rejection of fused cluster
0.361
+ req. good cluster
0.295
+ cut for two vertex matching
0.606
+ other misc. requirements on CsI
0.829
+ MB and upstream Vetoes
0.621
+ downstream Vetoes
0.853
+ req. signal box (after all the cuts)
0.346
To study the dominant backgrounds, MC events of
the decay with the statistics equivalent to
11.2 and 11.9 times the Run-II and Run-III data,
and the decay equivalent to 0.80 and 2.52
times the Run-II and Run-III data, respectively,
were generated with the same detector conditions as the real data.
Within these statistics,
no MC events of these processes were found
in the signal region for both
the Run-II and Run-III conditions.
The MC results
of the and decays
for the Run-III condition, with the same statistics as the real data,
are shown in Figs. 2(b) and (c), respectively,
together with the Run-III real data (Fig. 2(d)).
The plot of vs.
showed clear clustering well removed from the signal region of
(Fig. 2(b)).
Events from the decay were spread
over the vs. plot
without having clear boundaries (Fig. 2(c)).
The data plot (Fig. 2(d)) outside of the
masked signal region was characterized by the sum of
Fig. 2(b) and (c),
except for a small number of events that extended to higher
from the cluster region.
These latter events are considered to be due to regeneration
in the detector, and are not simulated in the MC. They will
be discussed in Sec. VI.
The MC study showed that most events stayed
close to the signal region except that those for
were from
and decays.
The main background source was .
V Sensitivity
The number of particles that decayed in the fiducial
vertex region was estimated by detecting
with the same selection criteria in the CsI calorimeter
as for .
Comparison with the MC simulation
of , with the
same selection criteria as the real data,
along with overlaid accidental events,
gave the number of decays as
for Run-II and
for Run-III, respectively.
To estimate the systematic uncertainties, the fractional
difference between the data and the MC simulation in each
selection criteria was examined, and the quadratic sum
weighted by the effectiveness of each of the acceptance
determinations e391paper2 was taken.
The calculated values were 5.6% and 5.5%
for Run-II and Run-III, respectively.
The same values of the systematic uncertainty were
adopted to the decay.
Based on the acceptance
for the decay
obtained from the MC simulation,
and the number of decays in the data-taking runs,
the single event sensitivity (S.E.S) was defined as
The S.E.S. was derived as
for Run-II and
for Run-III.
The combined S.E.S. was
.
The sensitivity reported here is considerably improved from
that of our previous analysis Nix .
In addition to the six-times larger statistics, the acceptance
factor was improved for several selection criteria.
Examples include the adoption of a looser cut for
in the two- vertex matching, and optimizing the criteria
used to select good photon clusters in the CsI calorimeter,
both of which were possible in a
cleaner environment with less neutron background
in Run-II and Run-III.
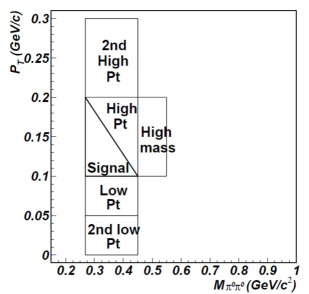
Figure 3: Kinematic boundaries of vs. for
the bifurcation analysis.
Table 2: Numbers of the events in the real data
(Run-II and Run-III combined) selected by the combinations
of two cut sets, A and B, at various regions defined
in Fig. 3.
They were used for the estimations of in the bifurcation
method. is the observed number of events in those regions.
Region
Est.
Signal
3
381
2508
0.460.26
–
Low
136
6330
41418
20.81.8
21
2nd low
1151
17525
105455
191.35.9
229
High
0
110
604
0.0
1
2nd high
1
5
41
0.120.13
0
High Mass
6
283
1086
1.560.65
12
VI Background Estimation
A “blind analysis” technique was used to
minimize the contribution from backgrounds without
examining the candidate events in the signal region.
Among the background sources,
was fully reconstructed and rejected primarily
by kinematic variables (, ) of the
system. However, would become a background
if two photons were missed due to finite photon-veto inefficiencies
in the detector.
The kinematic cuts could not be applicable to this dominant
background source, and suppression depended strongly
on the photon veto conditions.
To avoid the difficulty of having enough statistics
in the MC simulation of the
background in the signal region, we adopted
the “bifurcation method” to estimate the number of background
events in the signal region from the real data Nix ; BNL .
We imposed several selection criteria (cuts) to identify
the signal from backgrounds,
and the roles of these cuts were categorized in two groups,
namely cut and cut .
The cut consisted of “veto” requirements to ensure
no particles other than from the CsI-calorimeter region,
and the cut consisted of the
cuts to select well-reconstructed s from pairs of photon
clusters in the calorimeter.
If the two categories of cuts are uncorrelated,
the number of events that passed both of the cuts and
would be described as
where is the number of events after the basic “setup cuts”
are imposed prior to the cuts and , and
, and are the probability of passing the
conditions , , and , respectively.
The number of estimated background events is derived as
where the symbols and are the inverse
logic of and , respectively.
Thus in the signal region
after imposing all of the cuts and
could be estimated from the number of events obtained by
the combination of , , and .
The kinematic region defined by and of
the system was further divided into six
as shown in Fig. 3.
For each region, was estimated by the formula above.
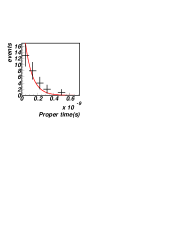
Figure 4: Proper-time distribution of the
system for the events with 0.1 GeV/
and 0.55 GeV/ with a loose
requirement for for the Run-II and Run-III, assuming
the production point was on the downstream edge of CC02.
The solid line is an expectation from the
decay.
Table 2 summarizes the background estimates
for the Run-II and Run-III data combined.
Various kinematic regions were tabulated
to cross-check the validity of this method.
The numbers of events of the real data
are consistent with the estimated values , and also
agree reasonably with the MC results of dominant backgrounds
(sum of and decays),
after imposing the cuts and (Table 3)
in most of the regions around the signal region.
The real data (12 events) in the “High mass” region exceeded
the estimated number of events ( events).
These events are seen in Fig. 2(d)
with around , extending to
the higher region (0.1 GeV/).
Fig. 4 shows the proper-time distribution
of the system with 0.1 GeV/,
0.55 GeV/, and a looser
requirement for the Run-II and Run-III combined,
assuming that the production point was the downstream
edge of the CC02 counter.
The proper-time distribution (Fig. 4) is
consistent with that of expected from the
decay, implying that the events
are from regeneration of in the upstream materials
and subsequent decay.
Because the final state of the process
was fully reconstructed, these events were insensitive to the
photon-veto cuts (cuts ) and also to the CsI cluster shape cuts
(cuts ).
Hence the bifurcation method was not applicable for estimating
the backgrounds from this process.
Nevertheless, these events might occur in the signal region
by a mis-pairing of the photons from the s.
Assuming that the mis-pairing rate for
decays was equal to that for decays shown
in Fig. 2(b), the contribution of events
in the “High mass” region to the signal region was
negligibly small ( 0.03 events).
The number of background events in the signal region
was estimated to be 0.460.26 for
the Run-II and Run-III combined (Table 2).
Table 3: Comparison of MC events
of background processes
( and )
after imposing cuts and
and real data in the kinematic regions given in
table 2.
The MC results
are normalized to the flux for the real data.
Sum of
Real
Region
(MC)
(MC)
the two MC
data
Signal
0.0
0.0
0.0
–
Low
0.5
15.6
16.1
21
2nd low
11.9
203.1
215.0
229
High
0.1
0.0
0.1
1
2nd high
0.0
0.0
0.0
0
High Mass
0.2
0.0
0.2
12
In the discussions above, we assumed that
the cut sets and were uncorrelated.
A measure of the correlation was given
by the parameter ,
as the difference of the probability of satisfying the cut
for the events that passed the cut , and
for the events that passed the cut .
Corrections to the due to the correlation are given by
to first order of Nix ; Nix2 .
In the “Low ” region, which was closest to the signal region,
was .
Applying this value to the signal region, the correction to be made
to the was events.
The magnitude of the correction is small compared with
the quoted error for the , and this effect was not
taken into account in deriving the final result.
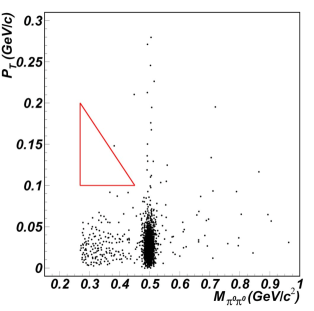
Figure 5: vs. distribution for
Run-II and Run-III combined.
VII Results
After all of these studies, the candidate events
in the signal region were examined.
Figure 5 shows the combined
results of the Run-II and Run-III;
no events are observed in the signal region.
By using Poisson statistics
with zero background events in the signal region,
we set an upper limit on the branching fraction of
to be
8.1 at the 90% C.L.
The systematic uncertainty in the S.E.S.
is not taken into account in the limit.
From the same data sample,
we also derived the upper limit on the
( invisible particles) decay
assuming three-body phase space.
Because the acceptance depended on
the mass of , the upper limit
was obtained as a function of the assumed mass of
as summarized in Table 4.
Table 4: Summary of the acceptance, S.E.S., and
90 C.L. upper limit on the branching fraction
with several assumptions of the mass of X in the
( invisible particles) decay.
accep-
Br upper limit
(MeV/c2)
tance
S.E.S.
with 90% C.L.
50
3.52
3.04
7.0
75
3.50
3.05
7.0
100
3.45
3.10
7.1
125
2.91
3.67
8.5
150
2.07
5.16
1.2
175
9.18
1.16
2.7
200
6.21
1.72
4.0
There are prospects of further improving the limit.
A new experiment E14 is now in preparation at J-PARC koto ,
aiming at studying the decay
with three orders-of-magnitude higher sensitivity than E391a
by utilizing higher beam flux, longer beam time, and an
upgraded detector with CsI calorimeter of higher efficiency and
granularity. Further increases of the beam flux are planned in
the upgrade.
In the case of , improving
the photon cluster detection in the CsI calorimeter
is essential to improving the sensitivity.
Hence we are hopeful to have significant progress on this
process in the near future.
Acknowledgements.
We are grateful to the operating crew of the KEK 12-GeV proton
synchrotron for the successful beam operation during the experiment.
This work has been partly supported by a Grant-in-Aid from the MEXT
and JSPS in Japan, a grant from NSC and Ministry of Education in Taiwan,
from the U.S. Department of Energy and from the Korea Research
Foundation.
References
(1)
L.S. Littenberg and G. Valencia, Phys. Lett. B385, 379 (1996).
(3)
Y.C. Tung et al.,
Phys. Rev. Lett. 102, 051802 (2009);
H.J. Hyun et al.,
Phys. Rev. Lett. 105, 0091801 (2010);
E. Abouzaid et al.,
e-print: arXiv:1105.4800[hep-ex].
(4)
J. Nix et al.,
Phys. Rev. D76, 011101(R) (2007).
(5)
J.K. Ahn et al., Phys. Rev. D74,
051105(R) (2006) ; Phys. Rev. Lett. 100, 201802 (2008).
(6)
J.K. Ahn et al., Phys. Rev. D81,
072004 (2010).
(7)
Y.C. Tung et al.,
Phys. Rev. D83, 031101(R) (2010).
(8)
R. Brun, F. Bruyant, M. Maire, A.C. McPherson, P. Zanarini,
CERN-DD-EE-84-1, Sep 1987. Revised version.
(9)
S. Adler et al., Phys. Rev. Lett. 79, 2204 (1997),
Phys. Rev. D77, 052003 (2008).
(10)
J. Nix et al.,
Nucl. Instr. and Methods A615, 223 (2010).
(11)
J. Comfort et al., (J-PARC E14 Collaboration)),
“Proposal for Experiment at J-Parc” (2006).