Disorder-dependent superconducting phase-diagram at high magnetic fields in Fe1+ySexTe1-x ()
Abstract
We compare the superconducting phase-diagram under high magnetic fields (up to T) of Fe1+ySe0.4Te0.6 single crystals originally grown by the Bridgman-Stockbarger (BRST) technique, which were annealed to display narrow superconducting transitions and the optimal transition temperature K, with the diagram for samples of similar stoichiometry grown by the traveling-solvent floating-zone technique as well as with the phase-diagram reported for crystals grown by a self-flux method. We find that the so-annealed samples tend to display higher ratios , particularly for fields applied along the inter-planar direction, where the upper critical field exhibits a pronounced downward curvature followed by saturation at lower temperatures . This last observation is consistent with previous studies indicating that this system is Pauli limited. An analysis of our data using a multiband theory suggests the emergence of the Fulde-Ferrel-Larkin-Ovchnikov state at low temperatures. A detailed structural x-ray analysis, reveals no impurity phases but an appreciable degree of mosaicity in as-grown BRST single-crystals which remains unaffected by the annealing process. Energy-dispersive x-ray analysis showed that the annealed samples have a more homogeneous stoichiometric distribution of both Fe and Se with virtually the same content of interstitial Fe as the non-annealed ones. Thus, we conclude that the excess of Fe, in contrast to structural disorder, contributes to decrease the superconducting upper-critical fields of this series. Finally, a scaling analysis of the fluctuation conductivity in the superconducting critical regime, suggests that the superconducting fluctuations have a two-dimensional character in this system.
pacs:
74.70.Xa, 74.25.Dw, 74.62.Dh, 74.25.fcI Introduction
The Fe1+y(Te,Se) series is a quite unique superconducting system: its end member, FeSe is a superconductor with a superconducting transition temperature K, hsu which can be increased up to K with the partial substitution of Se for Te, fang1 ; yeh or increased all the way up to 36.7 K by the application of hydrostatic pressure.medvedev The other end member of this series Fe1+yTe is not superconducting and instead exhibits a simultaneous structural and magnetic phase transition from tetragonal to monoclinic lattice accompanied by antiferromagnetism (AFM) near to K (Refs. fruchart, ; bao, ; li, ). This AFM structure is distinct from those seen in the undoped FeAs based compounds.cruz ; huang ; zhao The AFM order in Fe1+yTe propagates along the diagonal direction of the original undistorted Fe square lattice fruchart ; li , while in FeAs the wave-vector of the spin density wave (SDW) propagates along the nearest neighbor direction of the original Fe square lattice. cruz ; huang ; zhao
Density functional theory (DFT) calculations indicate that the Fermi surfaces (FS) of both FeSe and FeTe are similar to those of the other FeAs based compounds, consequently they should satisfy the nesting condition for the wavevector . subedi This apparent lack of universality would seem to question the exclusive role of the interband pairing via magnetic fluctuations in the pairing mechanism for all the iron-based superconductors. However, the observation of a spin resonance below together with an enhancement of the spin fluctuations near it, indeed suggests a spin-fluctuations mediated superconducting pairing mechanism for this system.qiu ; imai Initial angle resolved photoemission (ARPES) measurements in the Fe1+yTe revealed a pair of nearly compensated electron-hole FS pockets, with no evidence for the FS nesting instability associated with . hasan This could suggest the possibility of a distinct mechanism for the superconductivity and the magnetic-order in the Fe chalcogenides when compared to the Fe arsenides. But a recent ARPES study on superconducting Fe1.03Te0.7Se0.3 reveals a holelike and an electronlike FS located at the center and the corner of the Brillouin zone, respectively. These FSs are nearly nested for . nakayama The same study reports an isotropic superconducting gap along the holelike FS with a gap of meV , thus providing evidence for strong-coupling superconductivity. But, this is in contrast with a recent angle-dependent heat capacity study in Fe1+ySe0.45Te0.55 which finds evidence for a significant gap anisotropy on the electron pockets. wen Superconductivity in Fe1+ySe was shown to be extremely sensitive to stoichiometry. mcqueen In the Fe1+y(Te,Se) series, the crystal structure resembles that of the iron arsenides hsu with the Fe square planar sheets forming from the edge-sharing iron chalcogen tetrahedral network. But it also allows the partial occupation of iron in the interstitial sites of the (Te, Se) layers, resulting in a nonstoichiometric composition for the Fe1+y(Te,Se) series, where represents the excess Fe at the interstitial sites. fruchart ; bao It remains unclear how the geometry of the FS evolves with the incorporation of interstitial Fe, but it is claimed to suppress superconductivity. mao
One remarkable feature of these compounds is their extremely large upper critical fields . For instance, according to Ref. petrovic, for a Fe1.05Te0.89Se0.11 single-crystal with a middle point of just 11 K, one observes an of T. Or for a single-crystal of Fe1.11Te0.6Se0.4 with a close to its optimum value of 14 K one obtains of to 45 T. fang2 Compare these values with those of, for instance, MgB2 single crystals: K with T and T, for fields along the c-axis and along a planar direction, respectively. kwok In fact, to achieve in MgB2 upper-critical fields as large as those observed in the Fe1+y(Te,Se) series, strong impurity scattering is introduced to optimize the relative strengths of intraband scattering in and bands of MgB2. gurevich ; ag The significant differences between these two multi-band superconducting families are attributable to the fact that the Fe1+y(Te,Se) superconductors are mostly Pauli limited petrovic while the s in MgB2 are mostly determined by the orbital pair-breaking effect. However, the shape of the curves for Fe1+y(Te,Se) series measured in Refs. fang2, and petrovic, are quite distinct, with the former presenting a nearly linear dependence of for and the second displaying a pronounced concave down curvature followed by saturation at lower temperatures (as expected for the Pauli limiting effect). Such a curvature has also been reported in Ref. khkim, .
The Pauli-limited behavior of for Fe-chalcogenides results from the fact that they are semi-metals with rather low carrier density and low Fermi energies meV for different FS pockets hasan ; nakayama , unlike the conventional metallic superconductor MgB2. As a result, chalcogenides have very short coherence lengths 1 nm and thus extremely high orbitally-limited where is the Fermi velocity in the ab plane, and is the flux quantum. This in turn greatly enhances the Pauli effects quantified by the Maki parameter where is the Clogston paramagnetic limit fflo . Chalcogenides typically have above the critical value at which the FFLO instability develops. Moreover, because of their very short values of , chalcogenides are naturally in the clean limit which is one of the conditions of the FFLO instability, where is the mean free path due to elastic impurity scattering fflo . These features of chalcogenides make them good candidates to study exotic effects at high magnetic fields, in particular, the interplay of orbital and paramagnetic pairbreaking for multiband pairing and the FFLO state at low temperatures. The small Fermi energies also make superconducting properties very sensitive to the doping level, allowing one to tune by small shifts of the chemical potential.
In contrast to other reports emphasizing on the details concerning the synthesis of single crystals lin , in this work we compare the high-field phase-diagram of the Fe1+y(Te,Se) series, particularly the diagram for the optimally doped compound Fe1+yTe1-x≈0.6Sex≈0.4 synthesized by two methods. The first one is based on a traveling-solvent floating zone growth technique (TSFZ), which leads to crystals of acceptable crystallinity displaying “non-metallic” resistivity, optimal s, and transition widths to 3 K. We compare their behavior with crystals resulting from the Bridgman-Stockbarger (BRST) technique which in our case leads to crystals of poorer crystallinity (i.e. larger mosaicity), wider transitions and frequently to non-optimal s in as grown crystals, as previously reported by other groups. mizuguchi These last single-crystals were subjected to an annealing procedure which lead to metallic resistivity, considerably sharper resistive transitions K, and to superconducting transitions comparable to those reported in the literature for high quality BRST-grown single crystals as measured by SQUID magnetometry. sales The annealed crystals having a clear metallic behavior preceding superconductivity, display considerably higher upper-critical fields when compared to those showing a poor metallicity, particularly for magnetic-fields applied along the inter-layer direction. This increase leads to a distinct shape of the , i.e. from a approximately linear in behavior as reported in Ref. fang2, , to the marked concave-down curvature followed by saturation at lower temperatures as seen in Ref. khkim, .The analysis of our experimental data using a multiband theory of Gurevich2010 shows that is indeed strongly Pauli limited , predicting the FFLO state below K. A detailed single crystal x-ray analysis reveals that the annealing process does not affect the crystallinity or the degree of mosaicity of our single crystals. Nevertheless, our dispersive x-ray analysis indicates that the annealing process leads to a more uniform distribution of interstitial Fe. Annealing yields a considerably more isotropic phase diagram which combined with the enhancement in , suggests that the variations in the content of interstitial Fe contributes to the suppression of superconductivity. Finally, we show, through a scaling analysis of the fluctuation conductivity in the neighborhood of the superconducting transition, that the superconducting fluctuations in this system are two-dimensional in character.
II Sample preparation
Single crystals of Fe1+xTe1-ySey, and were grown by using the traveling-solvent floating-zone growth technique (TSFZ) and the Bridgman-Stockbarger (BRST) techniques. Starting materials with nominal purities of 4N for Fe and 5N for Te and Se were used. These were handled in an argon-filled glove box which kept the oxygen content below 1ppm. Mixtures of Fe, Te, and Se were ground and pelletized and sealed in quartz ampoules under vacuum and heated at 400 ∘C for 24 h. The reacted material was reground and doubly sealed in two quartz ampoules. For samples grown through the TSFZ technique, the doubly sealed quartz ampoules were loaded into an optical floating-zone furnace (NEC Nichiden Machinery 15HD), equipped with two 1500 W halogen lamps. The ampoule was rotated at 20 rpm, and translated at a rate of 1 to 2 mm/h. The as-grown samples were annealed by heating to 800 ∘C for 48 h, and then cooled at a rate of 100 ∘C/h to 420 ∘C and held at this temperature for additional 30 h, followed by the cooling of the furnace to room temperature.
A double wall quartz ampoule was also used in the case of crystals grown by the BRST technique. The inner ampoule was narrowly tipped at its bottom and sealed at the top. This Bridgman ampoule was inserting into a three-zone temperature gradient vertical furnace and lowered at a speed of 4 mm/h. The growth temperature was decreased at a rate of 3 ∘C/h down to 440 ∘C and subsequently quenched to room temperature. Some of the crystals as well as Se powder were placed into two different quartz crucibles, and both placed inside an evacuated quartz ampoule which was sealed under vacuum and heated slowly to 400 ∘C and then annealed for ten days.

The so-obtained crystals were checked by both single-crystal and powder x-ray diffraction (XRD) techniques. From as-grown single crystals, shards were cleaved to obtain suitable samples of approximately 0.3 mm 0.3 mm 0.03 mm. An Oxford-Diffraction Xcalibur-2 CCD diffractometer with Mo Kα source was used to collect reflections. CrysAlis Pro 171.33.55 software (Oxford Diffraction) was used for the unit cell refinement and analytical absorption correction. Final structure refinements were conducted using SHELXTL. For the powder diffraction runs, the single-crystals were ground by hand for approximately 1 minute using an agate mortar and pestle. Patterns were detected by a Huber-Guinier 620 camera with a Rigaku Ultrax Cu Kα direct drive rotating anode source. WinPow software was used for unit cell parameter least-squares calculations and peak fitting. Further details are provided in Ref. ICSD, .
Scanning electron-microscope energy-dispersive x-ray analysis (SEM-EDX) was performed by using a JEOL 5900 scanning electron microscope (30 kV accelerating voltage) equipped with IXRF energy dispersion spectroscopy software (IXRF Systems, Inc.) in order to determine the elemental compositions of the single crystals. We found that this EDX set-up would show a tendency to underestimate by nearly 3 % the overall fraction of Fe when comparing with detailed single-crystal x-ray refinements. We must clarify that the EDX set-up was not calibrated against an absolute standard.
Longitudinal resistivity was measured using a conventional four-contact method in continuous magnetic fields up to 45 T by using either a PPMS or the hybrid magnet of the National High Magnetic Field Laboratory in Tallahassee.
III Sample Characterization
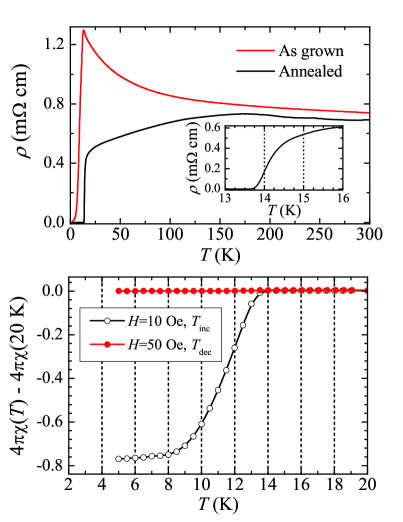
Figure 1 shows a typical trace of resistivity as a function of the temperature for a single crystal grown by the traveling-solvent floating-zone method described above, whose stoichiometry was extracted by a detailed single crystal x-ray analysis refinement. Although the width K of the superconducting transition (see inset) is relatively narrow when compared with the width of the transitions shown for instance in Ref. petrovic , the behavior of the metallic state shows the typical negative slope or logarithmic divergence of the resistivity, which was attributed to the high content of interstitial Fe and which leads to weak localization. mao The same characteristic temperature dependent resistive behavior is observed also in as-grown samples synthesized by the Bridgman-Stockbarger method (red line), as seen in the top panel of Fig. 2. As seen, the as-grown samples tend to exhibit lower superconducting transition temperatures and broader transitions. The annealing procedure described above leads to a slightly smaller resistivity at room temperature (black line) but most importantly to a quite distinct temperature dependence for the resistivity, which below K exhibits a clear metallic dependence with . The magnetic susceptibility on the other hand, shows a very clear diamagnetic signal (black markers) below the onset of at K, as seen in the lower panel of Fig. 2. At higher temperatures, the magnetic susceptibility is virtually temperature independent, as reported in Ref. yang, , and only at low temperatures one observes a very mild upturn in the susceptibility suggesting the presence of a small amount of localized magnetic moments. Although none of the susceptibility traces in Ref. yang, show a clear diamagnetic signal below K but below K.
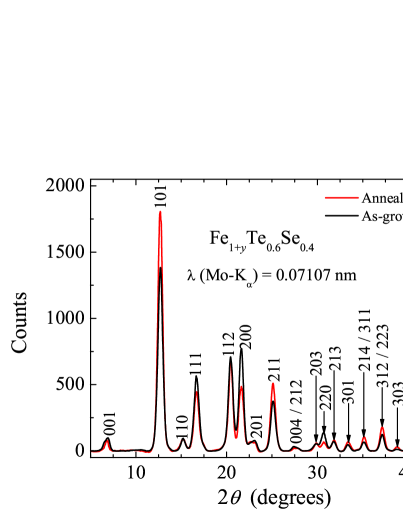
We also characterized our single crystals through single-crystal and powder x-ray diffraction measurements. Figure 3 shows two typical powder x-ray spectrum for one as-grown BRST crystal (black line) with a nominal stoichiometry Fe1.11Se0.4Te0.6, and for one annealed BRST single crystal (red line) from the same batch. These “powder” patterns were produced from integrating the intensities from single-crystal x-ray diffraction measurements using an area detector. This powder like pattern was obtained on the same single crystals used for the magnetic and transport measurements shown throughout this manuscript, by superimposing several of the to scans along the different crystallographic orientations. As clearly seen, for both crystals we observe the same set of well-defined Bragg peaks, where all peaks can be indexed within the tetragonal unit cell having the space group symmetry P4/nmm. Most importantly, we do not detect the presence of any impurity phase in either crystal, concluding that the annealing process preserves the original crystallographic structure and therefore the stoichiometry of the crystals. From this first analysis it would seem that both crystals are equivalent in structural quality despite their marked differences in physical behavior as seen in the top panel of Fig. 2.
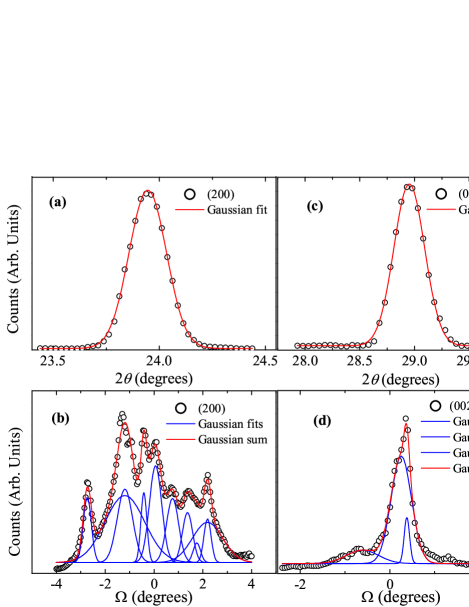
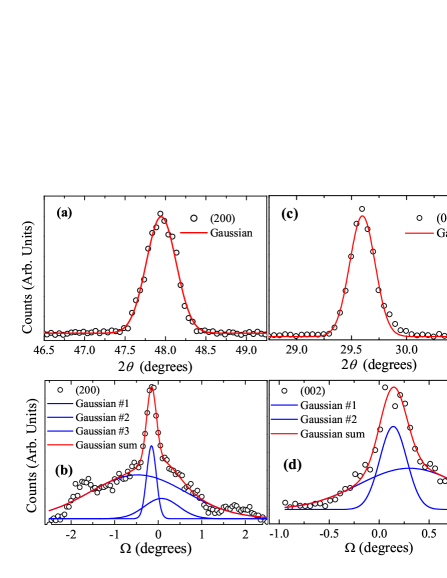
To clarify if disorder and mosaicity is at the origin of these differences in physical behavior, we performed a detailed x-ray rocking curve analysis in both single crystals around specific Bragg peaks. Figure 4 (a) shows the (200) Bragg reflection. By fitting the intensity as a function of to a Gaussian distribution, one obtains a full width at half maximum (FWHM) of , suggesting at first glance a modest but sizeable mosaic spread among crystallites. However, an exploration of the width of this peak along an arc whose orientation is nearly perpendicular to reveals a very broad feature as seen in Fig. 4 (b). This broad maximum can be adjusted (red line) to 3 Gaussian distributions (blue lines), with one of them showing a FWHM as large as . Each Gaussian would represent an ensemble or distribution of crystallites having a similar relative orientation. The observation of several distributions with varying widths indicates a large degree of mosaicity around the (200) position, or within the planes. A similar study around the (002) position shown respectively in Figs. 4 (c) and 4 (d), reveals seemingly a smaller degree of mosaicity among crystallites within distinct planes.
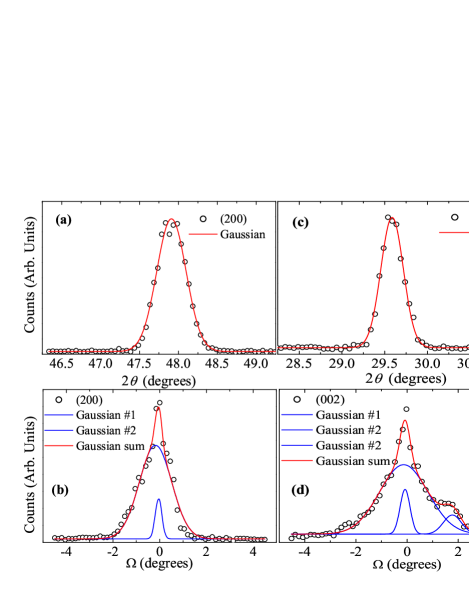
To clarify if the annealing process affects the structural degrees of freedom, for instance, by releasing strain induced in the single-crystals by the synthesis process, we have attempted a similar detailed structural analysis in an annealed single crystal of Fe1+yTe0.6Se0.4. Figure 5 (a) shows the intensity of the Bragg peak located along the (200) direction as a function of the angle , while Fig. 5 (b) shows the intensity of the same peak as function of the angle . The first measurement leads to a Gaussian peak (red line) having a FWHM of while the second one can be adjusted to two Gaussian distributions (blue lines) with the widest distribution having a FWHM of . Fig. 5 (c) shows the intensity of the Bragg peak observed as the angle is scanned around the (002) direction. One extracts a FWHM of by fitting its intensity to a Gaussian distribution (red line). Finally, Fig. 5 (d) shows the intensity of the Bragg peak observed at the (002) position as a function of the angle . As shown in the figure, to reproduce the observed broad feature one would need to fit it to at least three Gaussian distributions with the widest one having a FWHM of .
From this detailed comparison between the as-grown and the annealed BRST Fe1+yTe0.6Se0.4 single crystals, we can firmly conclude that the annealing process has no or perhaps just a marginal effect on the degree of crystallinity of the BRST grown samples. Although as seen in Fig. 2 (a), the behavior of the metallic state, and even the width of the superconducting transition is affected by this treatment and as we shall see below, it also affects . In Figs. 6 (a) through (d) we show a similar rocking curve analysis for a typical TSFZ Fe1+yTe0.55Se0.45 single-crystal, and as can clearly be seen in Figs. 6 (b) and (c) the degree of mosaicity in this single crystal, is higher (spans over ) than what we found for the BRST crystals. Nevertheless, the width of the superconducting transition (see Fig. 1) is considerably sharper than the width of the transition in as grown BRST crystals (see Fig. 2(a)) Therefore, from our study we can state that the mosaicity, or the relative orientation between stacked planes in a single-crystal, has virtually no effect on the superconducting properties (such as the width of the transition) of the 11 series.
Nevertheless, by comparing the EDX data taken on several annealed and non-annealed BRST-grown single-crystals, on approximately a dozen of collection sites in each crystal, one notices marked differences between annealed and non-annealed crystals: in average the non-annealed crystals displayed a variability of % in the fraction of interstitial Fe and a % in the fraction of Se, when compared respectively to % and % for the annealed samples ( is the average of the fluctuations with respect to the average value of ). EDX indicates that the annealing process has virtually no effect on the average value of either or , so it just homogenizes both values (specially ) throughout the sample.
However, this observation does not address the origin of for instance, the “non-metallic” like resistivity observed in the TSFZ-grown crystals when compared to the metallic response seen in annealed BRST-grown crystals. For the first ones, we were able to observe clear Bragg peaks and proceed with single-crystal x-ray refinements in shards taken from them, indicating relatively large values for ranging from 0.07 to 0.12. The crystallographic information file for one of our single-crystals is available as supplemental material cif_file . We also performed EDX analysis on the TSFZ single crystals, finding similar amounts of excess interstitial Fe, and typical values for %. Remarkably, for the second ones and despite the physical characterization shown above suggesting relatively high-quality single-crystals, we were unable to extract well-defined integrated intensities to proceed with single-crystal x-ray refinements. For these crystals, EDX indicates nearly stoichiometric values for , i.e. although, as previously mentioned, it tends to underestimate the content of Fe when compared to single-crystal x-ray refinements. These observations indicate that the physical properties of the 11 Fe-chalcogenides are nearly oblivious to their degree of mosaicity but depend on the amount of interstitial Fe and on how evenly distributed it is throughout the sample.
IV Superconducting phase diagram at high fields
In this section we compare the high-field superconducting phase-diagrams of several crystals synthesized by either the floating zone or the Bridgman-Stockbarger technique. In each case, only the crystals displaying the sharpest superconducting transitions K (where and are the values of the resistivity at respectively, the onset of the resistive transition or 90 % of , and the foot or 10 % of at the transition) were chosen for the electrical transport measurements under high fields. As indicated by Fig. 2, for the crystals grown by BRST the method, only the annealed samples showed the optimum and the sharpest superconducting transitions among all of the measured samples.
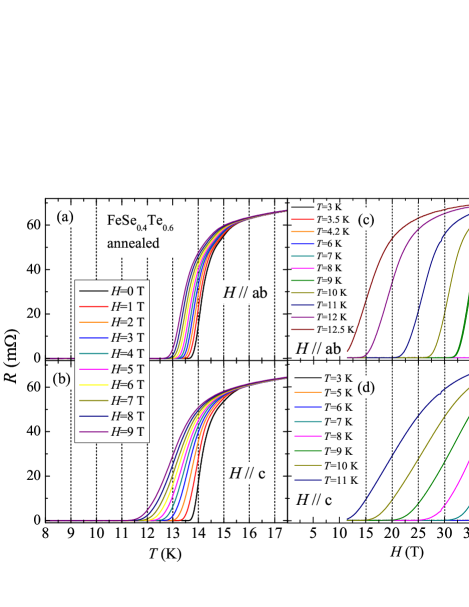
Figures 7 (a) and (b) show the resistance as a function of temperature for an annealed Fe1+yTe0.6Se0.4 single crystal for different fields and , respectively. Clearly, fields along the c-axis produce broader transitions as a function of temperature. Figures 7 (c) and (d) show the resistance as a function of magnetic fields and (up to T) for the same single crystal for different temperatures. The transitions become progressively sharper in field as the temperature decreases, consistent with the reduction of vortex fluctuations at lower . We have also collected similar data-sets for several single-crystals grown by the TSFZ-method with different Se and Fe contents but the corresponding raw data is not shown here. The stoichiometric fractions of Fe and Se were determined through a detailed single-crystal x-ray diffraction refinement of small shards cleaved off from each single-crystal. For these TSFZ samples the measured superconducting transition temperatures ranged from K (, or fraction of Se = 0.16) to the optimal value K ( and ).
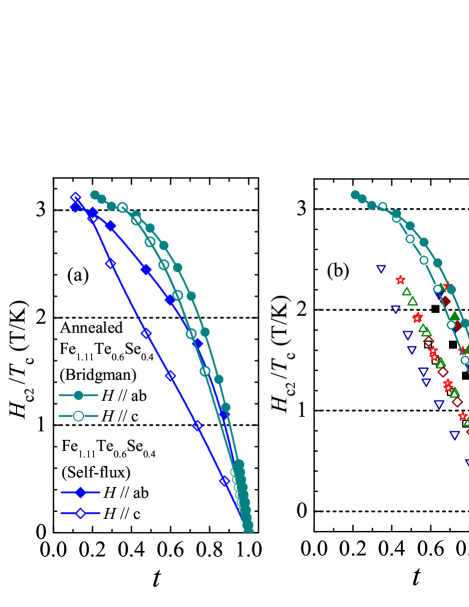
In Fig. 8 (a) we compare the superconducting phase-diagram at high-fields for our annealed BRST Fe1+yTe0.6Se0.4 single-crystal (circles) with the results of Ref. fang2, (squares), and in Fig. 8 (b) with the phase-diagram obtained for several TSFZ single-crystals (various markers excluding circles). Here, all points correspond to the middle point of the resistive transition. In either graph, both the field- and the temperature-axis are re-scaled with the zero-field of each sample (corresponding to the middle point of the zero-field resistive transition).
Here, we use this scaling for comparative purposes only, and not to indicate that these compounds are placed within the dirty limit. The plot in Fig. 7 (a) leads to a similar scaling quality when compared with a as a function of plot, previously observed in some of the Fe arsenide compounds jaroszynski and which was deemed to be consistent with an effective clean limit scenario due to the small superconducting coherence lengths of the Fe-pnictide compounds. As clearly seen in both figures, the annealed BRST-grown crystal has considerably larger upper-critical fields than all the other crystals, particularly for fields along the -axis and at intermediary reduced temperatures, i.e. from to % larger s for . For , the upper-critical field still is % larger than the value reported in Ref. fang2, . On the other hand, the anisotropy parameter for is slightly smaller than the values reported in Ref. fang2, ( for ), Ref. khkim, ( for ), and Ref. klein, ( for ). Given that the level of structural disorder (i.e. mosaicity) seen in crystals showing quite broad transitions and lower s (as-grown BRST crystals) is very similar to the level of mosaicity seen in the annealed crystals which display relatively sharp transitions, optimum , and higher , one is lead to conclude that the superconducting phase diagram of the Fe1+yTe1-xSex series for a given value of is mostly controlled by and respectively the overall fluctuation on the value of the fraction of interstitial Fe and in the value of the fraction of Se.
Another intriguing observation is that the superconducting phase-diagram for the more Fe stoichiometric samples shows a pronounced downward curvature as is lowered which was attributed by several authors to the Pauli limiting effect klein ; petrovic , in contrast with for example, the linear dependence seen in Ref. fang2, ) for . Indeed, all ratios shown in Fig. 7 are above the BCS paramagnetic limit, , indicating that the Pauli pairbreaking is very essential.
IV.1 Two-band analysis of the data
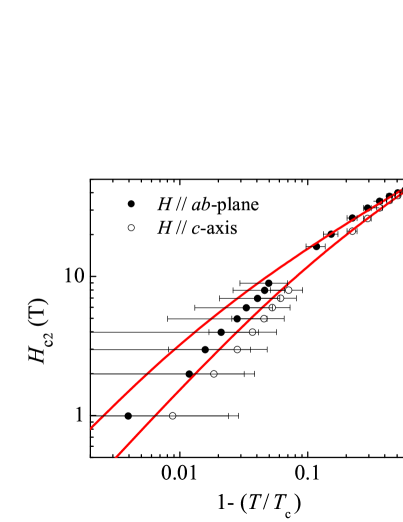
In order to evaluate the contributions of both orbital and Pauli pairbreaking effects for either field orientation, and to compare the results with those extracted from heat capacity measurements, we first analyze our data at temperatures close to where the Ginzburg-Landau theory yields Ref. klein ; Gurevich2010 :
| (1) |
Very close to the critical temperature, , the first paramagnetic term in the left hand side is negligible and Eq. (1) yields the orbital linear GL temperature dependence, . At lower temperatures, , the Pauli limiting field dominates the shape of even in the GL domain if . The latter inequality is equivalent to the condition that the Maki parameter is large enough, assuring that the paramagnetic effects are essential. Shown in Fig. 9 are the log-log plot of our as a function of where the red lines are fits to Eq. (1). These fits are excellent for the high-field region (excluding the highest fields), but less so very close to , probably due to the relatively large errors in determining temperatures ( mK) which are inherent to transport measurements, or perhaps due to broadening of the resistive transition due to local inhomogeneities. The fit yields T and T for the Pauli limiting field, respectively for fields along the c-axis and along the ab-plane, and T and T for the orbital limiting fields which are in very good agreement with those reported in Ref. klein, . Defining the effective GL coherence lengths, and , we obtain a rather small in-plane value of Å and an even smaller c-axis value of Å, which is shorter than the inter-planar distance Å tegel , in agreement with Ref. klein, .
The phenomenological Eq. (1) only describes the range , but does not take into account the possibility of the FFLO state which occurs if is large enough ( for a single parabolic band fflo ). To analyze our data at all temperatures and to reveal the microscopic meaning of the scaling fields and , we use a two-band generalization of the WHH theory Gurevich2010 in the clean limit, taking into account both orbital and paramagnetic pair-breaking, and the possibility of the FFLO with the wave vector . In this case the equation for is given by
| (2) | |||
| (3) |
The FFLO wave vector is determined self-consistently by the condition that the solution of Eq. (2) is maximum, , , , , , , and
| (4) | |||
| (5) |
Here is the in-plane Fermi velocity in band , is the mass anisotropy ratio, is the magnetic moment of a quasiparticle, and are the intraband pairing constants, and and are the interband pairing constants, and . The factors and describe the strong coupling Eliashberg corrections. For the sake of simplicity, we consider here the case of for which , and is defined by Eqs. (2) and (3) with and rescaled , and in and in Gurevich2010 .
Equation (2), which describes at all temperatures, simplifies close to where it reduces to Eq. (1) with
| (6) | |||
| (7) |
where . The slope is maximum at where Eqs. (2) and (6) yield
| (8) |
For identical bands, (, , ), Eq. (8) reduces to the single-band GL expression, , where is the GL coherence length in the clean limit Gurevich2010 . For the pairing , the dependence of on the materials parameters resembles the behavior of in the dirty limit: for strong band asymmetry ( or ), in Eq. (8) is limited by the band with larger Fermi velocity, similar to mostly limited by the band with larger diffusivity for the case ag . Paramagnetic effects decrease the slope of and reduce the effect of band asymmetry.
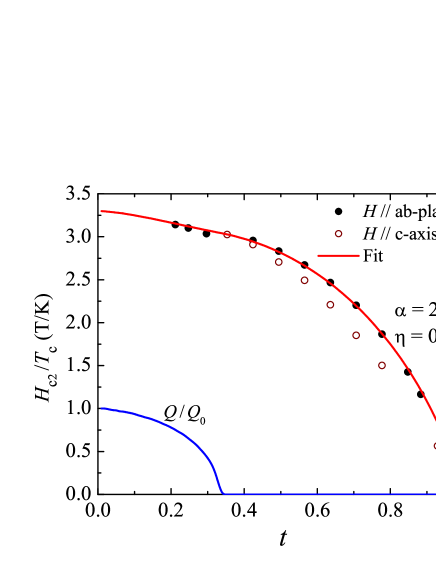
Figure 10 shows the fit of the measured to Eq. (2) for . For this field orientation, the resistive transitions in Fig. 7 (c) are considerably sharper than for . This allowed us to clearly define the middle point of the resistive transition for the traces taken at lower temperatures, increasing the number of the data points. For the sake of simplicity, we consider here the case of for which , and is defined by Eqs. (2) and (3) with rescaled , and in and in Gurevich2010 . The fit in Fig. 10 was done for pairing with , , , , . Equation (2) describes , and where is the solutions of Eq. (2) for very well.
To see if the observed values of are at least qualitatively consistent with Eq. (8) and the materials parameters of chalcogenides, we use the ARPES data arpes2 ; arpes3 ; arpes4 which give meV. Taking meV in Eq. (8) yields [T/K] , so the observed T/K and corresponds to the value of consistent with the ARPES data of = 3-20 for different FS pockets arpes2 . These estimates show that the paramagnetic effects for Fe-11 chalcogenides are indeed essential, and the parameter defined by Eq. (4) is greater than 1. For meV and K, we obtain , giving . The values of indicate that paramagnetic pair-breaking becomes so strong that it can trigger the FFLO instability at lower temperatures.
As follows from the results shown in Fig. 10, the anisotropy parameter decreases as decreases. This behavior reflects the significant role of the Zeeman pair-breaking in FeSeTe given that for is well above the single-band FFLO instability threshold, Gurevich2010 . In this case near is determined by the orbital pairbreaking and the mass anisotropy , but as decreases, the contribution of the isotropic Zeeman pairbreaking increases, resulting in the decrease of .
The fit to our experimental data based on the solution of Eq. (2) predicts the FFLO transition for . In this case Fig. 10 shows that the FFLO wave vector appears spontaneously at K, corresponding in optimally doped samples to magnetic fields T. Here increases from zero at to the maximum at , where . In addition to the strong Pauli pairbreaking , the FFLO transition requires weak impurity scattering in the clean limit where is the mean free path due to elastic scattering on impurities fflo . The latter condition is likely satisfied in the crystals studied in this work, given the very short coherence lengths Å and Å extracted from the fit described above. Thus, the chalcogenides are very good candidates to study the FFLO transition by magneto-transport, specific heat, magnetic torque or NMR measurements.
V Analysis of the critical region
Recent heat-capacity measurements on FeSe0.5Te0.5 under field serafin found that it strongly resembles behavior previously observed in the much more anisotropic high- cuprates, where strong fluctuation effects have been found to wipe out the phase transition at . In FeSe0.5Te0.5 these fluctuations were found to be strongly anisotropic serafin . Here, we proceed to study the critical regime preceding the superconducting transition in our annealed BRST-grown single-crystals. In the critical region of the metal to superconducting transition, and in the limit of strong magnetic fields, one expects a scaling form for the thermodynamic functions. At very high fields if the quasiparticles are confined within the lowest Landau level, the transport of charge carriers becomes nearly one-dimensional along the direction of the applied field. Fluctuation effects close to the superconducting transition are expected to be enhanced by the lower effective dimensionality of the system. In the critical regime the fluctuation conductivity was calculated in Ref. ullah, by including a quartic term in the free energy within the Hartree approximation, and obtained a scaling law for the fluctuation conductivity in magnetic fields, in terms of unspecified scaling functions and , valid for two-dimensional and three-dimensional superconductors, ullah respectively:
| (9) |
| (10) |
Where and are characteristic constants of a specific material. Presumably, these functionals remain valid even if the quasiparticles are not confined to just the lowest Landau level, but are placed in a few higher Landau levels, as long as the interaction between quasiparticles in distinct Landau levels remains negligible. zlatko ; zlatko1 In the cuprates, either type of scaling has been observed in materials having distinct degrees of electronic/superconducting anisotropies. cuprates
We define the contribution of the fluctuations to the conductivity as the difference between the normal state conductivity ( is the normal state resistivity) and the measured conductivity . Here is obtained from a polynomial fit of the resistivity in a temperature interval above , where the contribution of the fluctuations to should become negligible. Here, is defined as the middle point of the resistive transition, or the 50 %
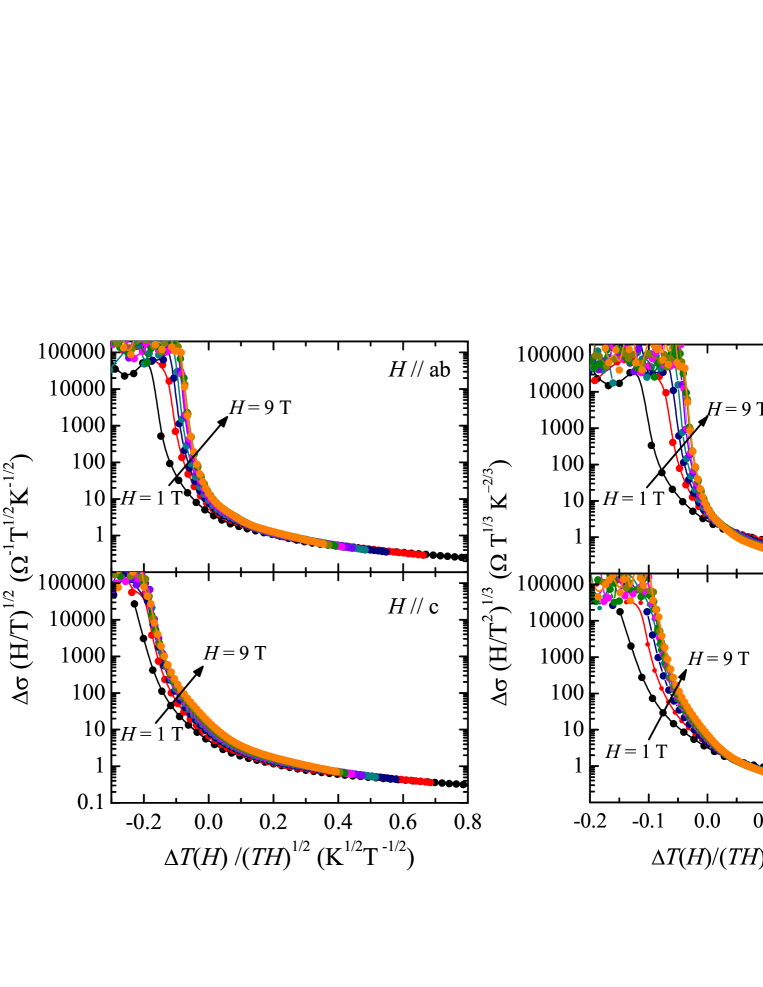
In the left panel of Fig. 11, we plot versus for the annealed BRST single-crystal for both field orientations, as expected for the two-dimensional scaling relation in Eq. (9). For fields above a relatively small value of just 4 T, and for both orientations, this two-dimensional scaling clearly succeeds in collapsing all the curves over an extended temperature range particularly above . We checked that this statement is still valid if the onset of the resistive transition (90 % of the resistance of the normal state) is used as the criteria to define . Given that the high field resistive transitions shown in Fig. 7 are remarkably broad, it is not possible to unambiguously define the functional form of in order to also collapse those curves in Fig. 11. To compare this two-dimensional scaling relation with the three-dimensional one, in the right panel of Fig. 11, we plot versus as expected for the three-dimensional case described by Eq. (10). Clearly, the two-dimensional relationship provides a better scaling of the data both above and below . Indeed, in the three-dimensional case, the curves at different fields open like a fan above and also tend to separate from each other below this critical temperature. On the other hand, in the 2D case, the curves above 4 T basically overlap over the entire range. The 2D behavior of fluctuation conductivity, already observed in the Fe arsenides, pallecchi ; marina implies that the inter-plane coherence length is smaller or in the order of the inter-plane spacing as found above, or, equivalently, that the coupling between adjacent superconducting planes is smaller than the intra-plane condensation energy. Notice, that our scaling analysis is consistent with the report of very anisotropic superconducting fluctuations according to heat capacity measurements serafin . Two-dimensional scaling also suggests that such fluctuations contribute to the broad transitions seen in Fig. 7, which become considerably sharper at lower temperatures.
VI discussion
There are several puzzling aspects in the Fe1+yTe1-xSex family that have yet to be understood and/or conciliated. For instance, optical spectroscopy measurements in Fe1.06Te0.88S0.14 indicates the absence of a Drude peak in optical conductivity, suggesting the absence of well-defined coherent quasi-particles in this material optical . Although, for FeSe0.42Te0.58 the in-plane optical conductivity is found to be indeed describable within a Drude-Lorentz model homes but with an incoherent response along the inter-planar direction moon . Therefore, one could even ask if the concept of Fermi surface would be applicable to these compounds. In sharp contrast, a recent angle resolved photoemission study on FeSe0.42Te0.58 tamai reveals a Fermi surface which is in relative good qualitative agreement with the generic Fermi surface proposed for the family of Fe pnictides. Namely, composed by two concentric hole-like cylindrical surfaces at the point and two electron-like cylinders at the M point of the Brillouin zone, which are characterized by a large, FS-sheet dependent, effective-mass enhancement. This indicates that correlations are particularly relevant for these materials which is consistent with the size of the anomaly observed in the heat capacity at the superconducting transition maohc or the large reported here and by other groups fang2 ; khkim ; klein . This geometry would be consistent with the observation of a resonance mode characterized by a wave-vector connecting both types of cylindrical Fermi surfaces qiu pointing towards an itinerant, nesting-like mechanism for the origin of the spin-fluctuations in these systems. Although, this scenario seems difficult to conciliate with the rather large magnetic moment of 1.6 to 1.8 for the non-interstitial Fe(I) ion as extracted from careful magnetic susceptibility measurements in superconducting samples yoshimura , and does not explain the observation of short-range magnetic-order in (superconducting samples) for the same wave-vector as the one extracted for the magnetically ordered state of Fe1+yTe bao . The interstitial Fe(II) is presumably characterized by an even larger moment of 2.5 bao ; yoshimura and from the superconducting perspective it should act as a magnetic impurity.
A recent DFT + DMFT study suggests that a combination of Hund’s rule and structural degrees of freedom, such as the pnictogen height and the bond angle between Fe and the pnictide element, are the key parameters defining the role of correlations, i.e. the degree of localization and therefore the concomitant size of the magnetic moment of Fe in iron pnictide compounds kotliar . For instance, the larger the size of the pnictogen atom or equivalently the larger the distance between Fe and this element, or the greater the deviation with respect to the ideal tetrahedral angle of 109.5∘, the larger the degree of localization in the Fe site. Or equivalently, the stronger the correlations on those Fermi surface sheets having a marked character which would favor the development of a magnetic instability. It is therefore easy to speculate on the role played by the interstitial Fe(II): it should favor local lattice distortions that are likely to further distort the Fe-pnictogen angle away from 109.5∘ favoring local magnetism in detriment of superconductivity. The larger the content in Fe(II) the stronger this detrimental effect, while larger fluctuations in could create randomly distributed nearly magnetic patches having a stronger Fe(II) content which could lead to pair-breaking effects. This rather simple scenario would explain why the annealed BRST-grown samples display clearer and sharper superconducting transitions when compared to the non-annealed ones despite a similarly poor crystallinity.
As for the presence of the FFLO state fflo , it is presumably sensitive to impurities being difficult to conciliate with the presence of magnetic Fe(II) atoms. However, our results suggest that our BRST-grown samples (annealed as well as non-annealed) are closer to having a nearly stoichiometric Fe content. Furthermore, the low- upturn in indicative of the FFLO instability as observed in this work, was also observed by other groups, see for example, Ref. khkim, . Finally, the interplay between magnetism and the FFLO-state is still poorly understood kenzelmann , so its existence in the Fe1+yTe1-xSex will only be clarified by future calorimetric, magnetic torque or NMR measurements at high fields.
Finally, given that the inter-plane coherence length is in the order of the inter-planar distance it is relatively easy to understand why the mosaic spread associated with relative orientation among Fe[Se,Te] planes has little effect on the superconducting properties of these materials. Although the superconducting anisotropy is small, the size of implies that the Cooper pairs are virtually localized within the planes thus remaining almost oblivious to the potential pair-breaking effects imposed by the grain boundaries located between the planes.
VII Conclusion
In conclusion, we find that the Fe[Te,Se] planes are well stacked along the c-axis, forming domains with well aligned planes spanning a certain coherence length along the c-axis. These domains display a small twist to each other, in the order of a degree or less relative, defining grain boundaries. Our study strongly indicates that these domain boundaries have little or no effect on the superconducting properties of the Fe1+yTe1-xSex series. However, a relatively weak disorder in the distribution of interstitial Fe is found to be detrimental to the superconducting properties of the Fe1+yTe1-xSex series, broadening the width of the superconducting transition and suppressing the diamagnetic response. We attribute this to local lattice distortions associated with the interstitial Fe(II) which are likely to locally increase the electronic correlations leading to a higher degree of carrier localization favoring magnetism in detriment of superconductivity. In samples displaying the sharpest superconducting transitions and a very clear diamagnetic signal, we observe a mild upturn in the upper critical field at lower temperatures consistent with the Fulde-Ferrel-Larkin-Ovchinnikov instability. These samples display metallic resistivity suggesting also the formation of coherent quasi-particles at lower temperatures in contrast to previous reports optical , and implying that a relatively mild excess of randomly distributed Fe(II) atoms may be enough to suppress the phase coherence. Finally, our estimates of the inter-plane coherence length Å where 6 Å is the inter-planar lattice constant, is consistent with the quasi-two-dimensional superconducting fluctuations in the critical region (also observed by other groupspallecchi ; marina ).
VIII Acknowledgements
The NHMFL is supported by NSF through NSF-DMR-0084173 and the State of Florida. L. B. is supported by DOE-BES through award DE-SC0002613. JW, TG and TS acknowledge support from FSU.
References
- (1) F. C. Hsu, J. Y. Luo, K. W. Yeh, T. K. Chen, T. W. Huang, P. M. Wu, Y. C. Lee, Y. L. Huang, Y. Y. Chu, D. C. Yan, and M. K. Wu, Proc. Natl. Acad. Sci. U.S.A. 105, 14262 (2008).
- (2) M. H. Fang, H. M. Pham, B. Qian, T. J. Liu, E. K. Vehstedt, Y. Liu, L. Spinu, and Z. Q. Mao, Phys. Rev. B 78, 224503 (2008).
- (3) K. W. Yeh, T. W. Huang, Y. L. Huang, T. K. Chen, F. C. Hsu, P. M. Wu, Y. C. Lee, Y. Y. Chu, C. L. Chen, J. Y. Luo, D. C. Yan, and M. K. Wu, EPL 84, 37002 (2008).
- (4) Y. Mizuguchi, F. Tomioka, S. Tsuda, T. Yamaguchi, and Y. Takano, Appl. Phys. Lett. 93, 152505 (2008); S. Margadonna, Y. Takabayashi, Y. Ohishi, Y. Mizuguchi, Y. Takano, T. Kagayama, T. Nakagawa, M. Takata, and K. Prassides, Phys. Rev. B 80, 064506 (2009); G. Garbarino, A. Sow, P. Lejay, A. Sulpice, P. Toulemonde, M. Mezouar, and M. Nunez-Regueiro, Europhys. Lett. 86, 27001 (2009); S. Medvedev, T. M. McQueen, I. A. Troyan, T. Palasyuk, M. I. Eremets, R. J. Cava, S. Naghavi, F. Casper, V. Ksenofontov, G. Wortmann and C. Felser, Nat. Mater. 8, 630 (2010).
- (5) D. Fruchart, P. Convert, P. Wolfers, R. Madar, J. P. Senateur, and R. Fruchart, Mater. Res. Bull. 10, 169 (1975).
- (6) W. Bao, Y. Qiu, Q. Huang, M. A. Green, P. Zajdel, M. R. Fitzsimmons, M. Zhernenkov, S. Chang, M. Fang, B. Qian, E. K. Vehstedt, J. Yang, H. M. Pham, L. Spinu, and Z. Q. Mao, Phys. Rev. Lett. 102, 247001 (2009).
- (7) S. L. Li, C. de la Cruz, Q. Huang, Y. Chen, J. W. Lynn, J. P. Hu, Y. L. Huang, F. C. Hsu, K. W. Yeh, M. K. Wu, and P. C. Dai, Phys. Rev. B 79, 054503 (2009).
- (8) C. de la Cruz, Q. Huang, J. W. Lynn, J. Li, W. R. Ii, J. L. Zarestky, H. A. Mook, G. F. Chen, J. L. Luo, N. L. Wang, and P. C. Dai, Nature (London) 453, 899 (2008).
- (9) Q. Huang, Y. Qiu, W. Bao, M. A. Green, J. W. Lynn, Y. C. Gasparovic, T. Wu, G. Wu, and X. H. Chen, Phys. Revs. Lett. 101, 257003 (2008).
- (10) J. Zhao, D. -X. Yao, S. Li, T. Hong, Y. Chen, S. Chang, W. Ratcliff II, J. W. Lynn, H. A. Mook, G. F. Chen, J. L. Luo, N. L. Wang, E. W. Carlson, J. Hu, and P. C. Dai, Phys. Rev. Lett. 101, 167203 (2008).
- (11) A. Subedi, L. J. Zhang, D. J. Singh, and M. H. Du, Phys. Rev. B 78, 134514 (2008).
- (12) Y. M. Qiu, W. Bao, Y. Zhao, C. Broholm, V. Stanev, Z. Tesanovic, Y. C. Gasparovic, S. Chang, J. Hu, B. Qian, M. H. Fang, and Z. Q. Mao, Phys. Rev. Lett. 103, 067008 (2009).
- (13) T. Imai, K. Ahilan, F. L. Ning, T. M. McQueen, and R. J. Cava, Phys. Rev. Lett. 102, 177005 (2009).
- (14) Y. Xia, D. Qian, L. Wray, D. Hsieh, G. F. Chen, J. L. Luo, N. L. Wang, and M. Z. Hasan, Phys. Rev. Lett. 103, 037002 (2009).
- (15) K. Nakayama, T. Sato, P. Richard, T. Kawahara, Y. Sekiba, T. Qian, G. F. Chen, J. L. Luo, N. L. Wang, H. Ding, and T. Takahashi, Phys. Rev. Lett. 105, 197001 (2010).
- (16) B. Zeng, G. Mu, H. Q. Luo, T. Xiang, H. Yang, L. Shan, C. Ren, I. I. Mazin, P. C. Dai, and H. -H. Wen, Nat. Commun. 1, 112 (2010).
- (17) T. M. McQueen, Q. Huang, V. Ksenofontov, C. Felser, Q. Xu, H. Zandbergen, Y. S. Hor, J. Allred, A. J. Williams, D. Qu, J. Checkelsky, N. P. Ong, and R. J. Cava, Phys. Rev. B 79, 014522 (2009).
- (18) T. J. Liu, X. Ke, B. Qian, J. Hu, D. Fobes, E. K. Vehstedt, H. Pham, J. H. Yang, M. H. Fang, L. Spinu, P. Schiffer, Y. Liu, and Z. Q. Mao, Phys. Rev. B 80, 174509 (2009).
- (19) H. Lei, R. Hu, E. S. Choi, J. B. Warren, and C. Petrovic, Phys. Rev. B 81, 094518 (2010).
- (20) M. Fang, J. Yang, F. F. Balakirev, Y. Kohama, J. Singleton, B. Qian, Z. Q. Mao, H. Wang, and H. Q. Yuan, Phys. Rev. B 81, 020509(R) (2010).
- (21) L. Lyard, P. Samuely, P. Szabo, C. Marcenat, T. Klein, K. H. P. Kim, C. U. Jung, H. -S. Lee, B. Kang, S. Choi, S. -I. Lee, L. Paulius, J. Marcus, S. Blanchard, A. G. M. Jansen, U Welp, G. Karapetrov and W. K. Kwok, Supercond. Sci. Technol. 16, 193 (2003).
- (22) A. Gurevich, S. Patnaik, V. Braccini, K. H. Kim, C. Mielke, X. Song, L. D. Cooley, S. D. Bu, D. M. Kim, J. H. Choi, L. J. Belenky, J. Giencke, M. K. Lee, W. Tian, X. Q. Pan, A. Siri, E. E. Hellstrom, C. B. Eom and D. C. Larbalestier, Supercond. Sci. Technol. 17, 278 (2004).
- (23) A. Gurevich, Phys. Rev. B 67, 184515 (2003); Physica C 456, 160 (2007).
- (24) S. Khim, J. W. Kim, E. S. Choi, Y. Bang, M. Nohara, H. Takagi, and K. H. Kim, Phys. Rev. B 81, 184511 (2010).
- (25) P. Fulde and R. A. Ferrell, Phys. Rev. 135, A550 (1964); A. I. Larkin and Yu. N. Ovchinnikov, Sov. Phys. JETP 20, 762 (1965). Y. Matsuda and H. Shimahara, J. Phys. Soc. Jpn. 76, 051005 (2007).
- (26) Y. Liu and C. T. Lin, J. Supercond. Nov. Magn. 24, 183 (2011).
- (27) Y. Mizuguchi and Y. Takano, J. Phys. Soc. Jpn. 79, 102001 (2010).
- (28) B. C. Sales, A. S. Sefat, M. A. McGuire, R. Y. Jin, D. Mandrus, Y. Mozharivskyj, Phys. Rev. B 79, 094521 (2009).
- (29) A. Gurevich, Phys. Rev. B 82, 184504 (2010).
- (30) The detailed crystallographic information file (CIF) for a typical TSFZ single crystal x-ray refinement with CSD # 423463 is available at: http://www.fiz-karlsruhe.de.
- (31) J. Yang, M. Matsui, M. Kawa, H. Ohta, C. Michioka, C. Dong, H. Wang, H. Yuan, M. Fang and K. Yoshimura, J. Phys. Soc. Jpn. 79, 074704 (2010).
- (32) See supplemental material at http://link.aps.org/supplemental/
- (33) T. Klein, D. Braithwaite, A. Demuer, W. Knafo, G. Lapertot, C. Marcenat, P. Rodière, I. Sheikin, P. Strobel, A. Sulpice, and P. Toulemonde, Phys. Rev. B 82, 184506 (2010).
- (34) M. Tegel, C. Löhnert, and D. Johrendt, Solid State Commun. 150, 383 (2010).
- (35) J. Jaroszynski, S. C. Riggs, F. Hunte, A. Gurevich, D. C. Larbalestier, G. S. Boebinger, F. F. Balakirev, A. Migliori, Z. A. Ren, W. Lu, J. Yang, X. L. Shen, X. L. Dong, Z. X. Zha, R. Jin, A. S. Sefat, M. A. McGuire, B. C. Sales, D. K. Christen, and D. Mandrus, Phys. Rev. B 78, 064511 (2008).
- (36) A. Serafin, A. I. Coldea, A. Y. Ganin, M. J. Rosseinsky, K. Prassides, D. Vignolles, and A. Carrington, Phys. Rev. B 82, 104514 (2010).
- (37) S. Ullah and A. T. Dorsey, Phys. Rev. Lett. 65, 2066 (1990); S. Ullah and A. T. Dorsey, Phys. Rev. B 44, 262 (1991).
- (38) Z. Tešanovic and A. V. Andreev, Phys. Rev. B 49, 4064 (1994).
- (39) Z. Tešanovic, L. Xing, L. Bulaevskii, Q. Li, and M. Suenaga, Phys. Rev. Lett. 69, 3563 (1992).
- (40) M. Roulin, A. Junod, and E. Walker, Physica C 260, 257 (1996); D. H. Kim, K. E. Gray, and M. D. Trochet, Phys. Rev. B 45, 10801 (1992); U. Welp, S. Fleshler, W. K. Kwok, R. A. Klemm, V. M. Vinokur, J. Downey, B. Veal, and G. W. Crabtree, Phys. Rev. Lett. 67, 3180 (1991); N. Overend, M. A. Howson, I. D. Lawrie, S. Abell, P. J. Hirst, C. Changkang, S. Chowdhury, J. W. Hodby, S. E. Inderhees, and M. B. Salamon, Phys. Rev. B 54, 9499 (1996); M. Costa, P. Pureur, L. Ghivelder, J. A. Campá, and I. Rasines, Phys. Rev. B 56, 10836 (1997); S. W. Pierson, T. M. Katona, Z. Tešanovic, and O. T. Valls, Phys. Rev. B 53, 8638 (1996); M. Costa, P. Pureur, M. Gusmão, S. Senoussi, and K. Behnia, Phys. Rev. B 64, 214513 (2001).
- (41) I. Pallecchi, C. Fanciulli, M. Tropeano, A. Palenzona, M. Ferretti, A. Malagoli, A. Martinelli, I. Sheikin, M. Putti, and C. Ferdeghini, Phys. Rev. B 79, 104515 (2009).
- (42) M. Putti, I. Pallecchi, E. Bellinger, M. Tropeano, C. Ferdeghini, A. Palenzona, C. Tarantini, A. Yamamoto, J. Jiang, J. Jaroszysnki, F. Kametani, D. Abraimov, A. Polyanskii, J. D. Weiss, E. E. Hellstrom, A. Gurevich, D. C. Larbalestier, R. Jin, B. C. Sales, A. S. Sefat, M. A. McGuire, D. Mandrus, P. Cheng, Y. Jia, H. H. Wen, S. Lee, and C. B. Eom, Supercond. Sci. Technol. 23, 034003 (2010).
- (43) K. Nakayama, T. Sato, P. Richard, T. Kawahara, Y. Sekiba, T. Qian, G. F. Chen, J. L. Luo, N. L. Wang, H. Ding, and T. Takahashi, Phys. Rev. Lett. 105 197001 (2010)
- (44) F. Chen, B. Zhou, Y. Zhang, J. Wei, H.W. Ou, J.F. Zhao, C. He, Q.Q. Ge, M. Arita, K. Shimada, H. Namatame, M. Taniguchi, Z.-Y. Lu, J. Hu, X.-Y. Cui, and D. L. Feng Phys. Rev. B 81, 014526 (2010).
- (45) A. Tamai, A. Y. Ganin, E. Rozbicki, J. Bacsa, W. Meevasana, P. D. C. King, M. Caffio, R. Schaub, S. Margadonna, K. Prassides, M. J. Rosseinsky, and F. Baumberger, Phys. Rev. Lett. 104 097002 (2010).
- (46) N. Stojilovic, A. Koncz, L. W. Kohlman, Rongwei Hu, C. Petrovic, and S. V. Dordevic, Phys. Rev. B 81, 174518 (2010).
- (47) C. C. Homes, A. Akrap, J. S. Wen, Z. J. Xu, Z. W. Lin, Q. Li, and G. D. Gu, Phys. Rev. B 81, 180508 (2010).
- (48) S. J. Moon, C. C. Homes, A. Akrap, Z. J. Xu, J. S. Wen, Z. W. Lin, Q. Li, G. D. Gu, and D. N. Basov, Phys. Rev. Lett. 106, 217001 (2011).
- (49) A. Tamai, A. Y. Ganin, E. Rozbicki, J. Bacsa, W. Meevasana, P. D. C. King, M. Caffio, R. Schaub, S. Margadonna, K. Prassides, M. J. Rosseinsky, and F. Baumberger, Phys. Rev. Lett. 104, 097002 (2010).
- (50) J. Hu, T. J. Liu, B. Qian, A. Rotaru, L. Spinu, and Z. Q. Mao, Phys. Rev. B 83, 134521 (2011).
- (51) J. Yang, M. Matsu, M. Kawa, H. Ohta, C. Michioka, C. Dong, H. Wang, H. Yuan, M. Fang, and K. Yoshimura, J. Phys. Soc. Jpn. 79, 074704 (2010).
- (52) Z. P. Yin, K. Haule, and G. Kotliar, arXiv:1104.3454v1 (2011).
- (53) M. Kenzelmann, T. Strassle, C. Niedermayer, M. Sigrist, B. Padmanabhan, M. Zolliker, A. D. Bianchi, R. Movshovich, E. D. Bauer, J. L. Sarrao, J. D. Thompson, Science 321, 1652 (2008).