Sizing up Lyman-alpha and Lyman Break Galaxies
Abstract
We show that populations of high redshift galaxies grow more luminous as they grow in linear size. This is because the brightness per unit area has a distinct upper limit due to the self-regulating nature of star-formation. As a corollary, we show that the observed increase in characteristic luminosity of Lyman Break Galaxies (L∗) with time can be explained by their increase in size, which scales as . In contrast, Lyman- selected galaxies have a characteristic, constant, small size between redshift and 6.5. Coupled with a characteristic surface brightness, this can explain their non-evolving ultraviolet continuum luminosity function. This compact physical size seems to be a critical determining factor in whether a galaxy will show Lyman- emission. We base these conclusions on new size measurements for a sample of about 170 Lyman- selected galaxies with Hubble Space Telescope broad band imaging, over the redshift range . We combine these with a similar number of Lyman- selected galaxies with half-light radii from the literature, and derive surface brightnesses for the entire combined sample.
1 Introduction
The observed properties of high redshift galaxies provide crucial constraints on galaxy formation scenarios. For these constraints to be most useful, they should be based on more than one class of object, identified in more than one way. At present, optical astronomy provides the most sensitive searches for high redshift galaxies. The two major ways of finding galaxies at high redshift using optical data are the Lyman Break method (e.g., Steidel et al 1996) and the Lyman- method (e.g., Hu, Cowie, & McMahon 1998, Rhoads et al 2000).
Samples of galaxies selected by these two methods have been compared in past using broad band spectral energy distributions. While both selection methods identify actively star forming galaxies, there are clear quantitative differences. The Lyman- selected objects are seen in most cases to be young, relatively less massive, and less evolved chemically than Lyman-break selected galaxies (Gawiser et al. 2007, Pirzkal et al. 2007, Finkelstein et al. 2009, 2010a).
We now wish to know if the differences between Lyman- and Lyman break samples are due only to the difference in their average continuum magnitudes, or if the presence of Lyman- in emission tells us something significant about the nature of the galaxy. To address this, we here perform the first systematic study of the sizes and surface brightnesses of Lyman- selected galaxy samples over a wide range of redshift, and compare our result to previous studies of both size evolution and surface brightness evolution in Lyman break samples.
Size evolution of the Lyman break galaxy population has been investigated both for color-selected samples (Ferguson et al. 2004, Bouwens et al. 2004), and for spectroscopically selected samples (Hathi, Malhotra, & Rhoads 2008). The sizes of typical LBGs increase from redshift 6 to redshift 1.5. “Typical LBGs” here means those galaxies with luminosities about or brighter. The observed size evolution of LBGs is well described by , as expected for samples of disk galaxies selected by fixed circular speed.
Despite their smaller characteristic sizes, high redshift LBGs are similar to low redshift () starbursts in one particular aspect: their star formation intensity (SFI), measured in luminosity per unit area, shows a distinct upper limit that does not change from redshift zero to 6.5 (Hathi et al. 2008, Meurer et al. 1997). The upper limit of SFI corresponds to the maximum pressure that can be supported by the interstellar medium (ISM), beyond which galaxy scale winds become prevelant and inhibit further star formation by heating cold ISM and/or removing cold ISM with winds (Meurer et al. 1997, Heckman et al. 1990, Thompson et al. 2005).
In section 2, we describe the Lyman- samples used in the study, together with the size measurements. We present new size measurements for about half of the galaxies in the overall sample, while we adopt previously published size measurements for the other half. In section 3, we describe our calculations of the surface luminosity and star formation intensity in the full sample. We discuss our results in section 4. Finally in section 5 we summarize the implications of our findings for galaxy formation and evolution.
2 Samples and Size Measurements
We measured the sizes of known Lyman-alpha emitters from several surveys spanning this range of redshifts (see table 1). We select surveys in fields where images from the Hubble Space Telescope (HST) exist, since Lyman- galaxies are unresolved in ground-based imaging.111Here we exclude the Lyman-alpha blobs (e.g. Steidel et al 2000, Matsuda et al. 2004, Yang et al 2009, 2010), which come in a variety of sizes, appear to be associated with only the most overdense regions, and may be powered by some mechanism besides star formation. We measure the sizes of the Lyman- galaxies from broad-band imaging around the wavelength 1500Å, to facilitate comparison with the sizes measured for LBGs.
The most common measure of size is the half-light radius , defined as radius of a circle enclosing half the total projected light of the galaxy, and is calculated using the program SExtractor (Bertin & Arnouts 1996) in most cases. The errors in the measurements range from 10% to 25% depending on the signal to noise of the detection (Bond et al. 2009). We measured the half light radii of Lyman- emitters at (a sample from Nilsson et al 2009), (sample from McLinden et al. 2011), and (sample from Finkelstein et al 2009), after excluding sources identified as active galactic nuclei (AGN) (Nilsson et al 2009, McLinden et al 2010b). We used the SExtractor half light radius parameter, based on publically available HST images. In the and samples, the HST images are from the COSMOS survey (Scoville et al 2007; Capak et al 2007), using the Advanced Camera for Surveys/Wide Field Camera with the F814W filter. This corresponds to near-UV rest wavelengths of 2000Å at and 2500Å at . In the sample, the HST images are from the GOODS survey (Giavalisco et al 2004), F775W images provide a rest wavelength of 1420Å at . In addition, we compile other size measurements made using HST images for other Lyman-alpha galaxies up to redshift (Pirzkal et al. 2007, Bond et al. 2009, Overzier et al. 2006, 2008, Venemans et al. 2005, Taniguchi et al. 2009).
In table 1, we summarize the different samples for which we have measured the sizes of the Lyman-alpha galaxies, including the number of objects and redshift for each sample, and the continuum rest wavelength used for size meaurements. The measured sizes of galaxies are not very sensitive to the wavelength used, given the modest wavelength differences among the samples we use (Ferguson et al. 2004). In all, our samples comprise 368 galaxies, among which we are reporting the first size measurements for 171.
About 15-30% of Lyman- galaxies are also reported to be “clumpy”, where the size of individual clumps is small but the separation between the clumps is large, kpc (Pirzkal et al. 2007, Rhoads et al. 2005, Taniguchi et al. 2009, Bond et al. 2009). These galaxies are included in the analysis, taking the interclump distance as the size. Being a minority, they do not affect the average size greatly.
3 Surface Luminosity Measurements
We calculate the surface luminosity following the method described by Hathi et al. 2008, for deriving dust corrected UV flux at rest-frame 2300 Å. We assume that the UV continuum is well represented by a power law of the form , where is the flux density per unit wavelength (ergs s-1 cm-2 Å-1).
The UV spectral slope () is then derived from a power law fit to the UV colors using two filters. In cases where we did not have the color information, we assume that the UV slope , which is a typical slope among well studied Lyman- galaxies (Pirzkal et al. 2007, Gawiser et al. 2007, Nilsson et al. 2009, Rhoads et al. 2009).
A dust free stellar population is expected to have a slope of for a wide range of young stellar populations, so observed deviations from this slope give us an estimate of reddening by dust. This reddening estimate is then used along with the Calzetti extinction law (Calzetti, Kinney, & Storchi-Bergmann 1994) to correct for dust extinction. We next k-correct the UV flux at the observed wavelength to that at rest-frame 2300Å. Finally, we apply a correction factor to convert the extinction corrected UV luminosity into a bolometric luminosity: . We have checked this ratio against detailed stellar population synthesis models (Bruzual & Charlot 2003), and find good agreement, with the models giving (Hathi et al. 2008).
The Star-Formation Intensity is then defined using the luminosity and size.
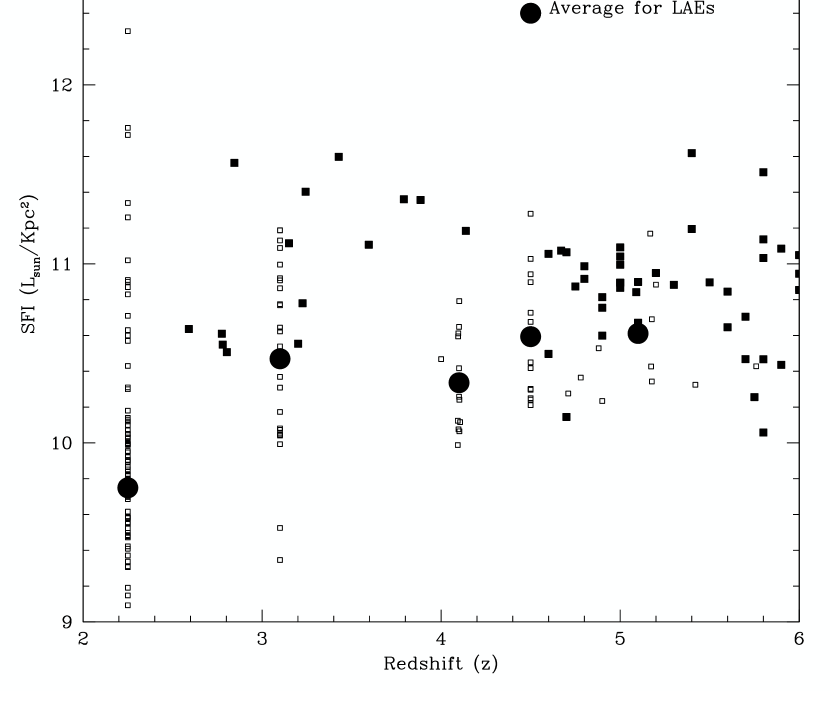
The SFI vs redshift is plotted in Figure 1, for LBGs (Hathi et al. 2008) as well as Lyman- emitters.
| z | rest wave- | sample | mean | Sample | Size | |
|---|---|---|---|---|---|---|
| length (Å) | size | reference | reference | |||
| 2.25 | 2500 | 142 | 0.15 | 0.04 | Nilsson et al. 2009 | This work |
| 3.13 | 2000 | 13 | 0.11 | 0.03 | Venemans et al. 2005 | Venemans et al 2005 |
| 3.12 | 2000 | 15 | 0.14 | 0.06 | McLinden et al. 2010 | This work |
| 3.1 | … | 110 | 0.145 | 0.07 | Bond et al. 2009 | Bond et al 2009 |
| 4.1 | 1670 | 12 | 0.135 | 0.05 | Overzier et al. 2008 | Overzier et al 2008 |
| 4.45 | 1420 | 14 | 0.12 | 0.02 | Finkelstein et al. 2009 | This work |
| 5.2 | 1370 | 4 | 0.125 | 0.03 | Overzier et al. 2006 | Overzier et al 2006 |
| 5.7 | 1220 | 49 | 0.16 | 0.06 | Taniguchi et al. 2009 | Taniguchi et al 2009 |
| 4–5.7 | … | 9 | 0.16 | 0.08 | Pirzkal et al. 2007 | Pirzkal et al 2007 |
4 Results
1. Star-formation Intensity Hathi et al. (2008) showed that the upper limit for star formation intensity (SFI) seems to hold for Lyman-break Galaxies up to redshifts . In figure 1 we see that the SFI for the Lyman- emitters also stays within that upper envelope. The lower envelope of the SFI distribution is of course set by incompleteness, so we concentrate on the upper envelope in our studies.
The typical SFI for Lyman- galaxies is smaller than that of LBGs by about a factor of 2.5. This is still above the threshold required to drive galaxy-scale winds (Lehnert & Heckman 1996; Heckman 2001), and such winds may play a significant role in Lyman- photon escape (e.g. Verhamme, Schaerer, & Maselli 2006; Steidel et al 2010). A Kolmogorov-Smirnov test shows that the SFI is different at 5- level between Lyman- and Lyman break samples.
The reason for the smaller SFI in Lyman- galaxies compared to LBGs is not immediately clear. It could be due to an overestimate of the sizes of Lyman- galaxies, which are only marginally resolved with HST. An overestimate of sizes by 50% can largely explain the discrepancy between the surface luminosity of Lyman- and LBGs. This effect should, however, be important for LBGs as well, since they are also barely resolved by HST.
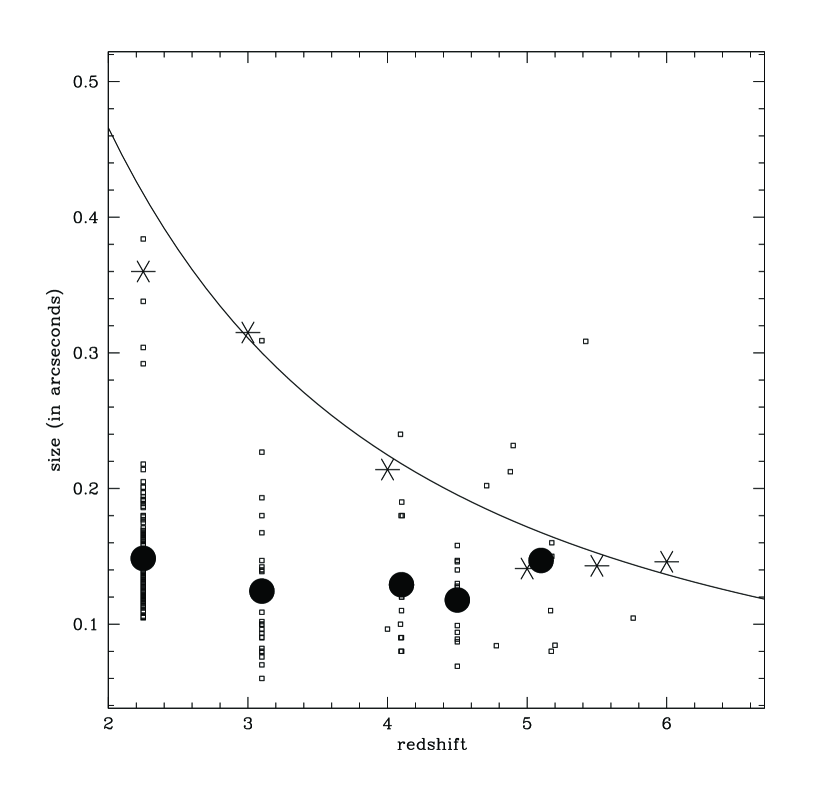
2. Sizes Figure 2 shows the sizes of Lyman- and Lyman-Break galaxies, as represented by half-light radii. The size of both the Lyman- galaxies and LBGs are measured in the UV continuum, and not in the line emission. We see from Figure 2 that the median size of Lyman- galaxies is small and does not change with redshift over the range . Given that nearly all of the Lyman- galaxies studied here were identified in ground-based surveys with typical seeing of , it seems unlikely that the typical observed size of is due to observational selection against larger objects. In contrast, the LBGs at lower redshifts are larger than the LBGs at high redshifts (Ferguson et al. 2004, Bouwens et al. 2004, Hathi et al. 2008). The average size of LBGs follows closely the relation , where is the Hubble parameter at redshift z. This is not to say that it is the same set of Lyman- galaxies that stay unevolved from redshift 2 to 6. It just means that whenever we identify galaxies by means of strong Lyman- emission, we find them to be compact in size, independent of the redshift. It is very likely that Lyman- emitting phase in a galaxy is short with a duty cycle of about 10% – 15% (e.g. Malhotra & Rhoads 2002, Kovač et al. 2007, Tilvi et al. 2009, Nagamine et al 2010).
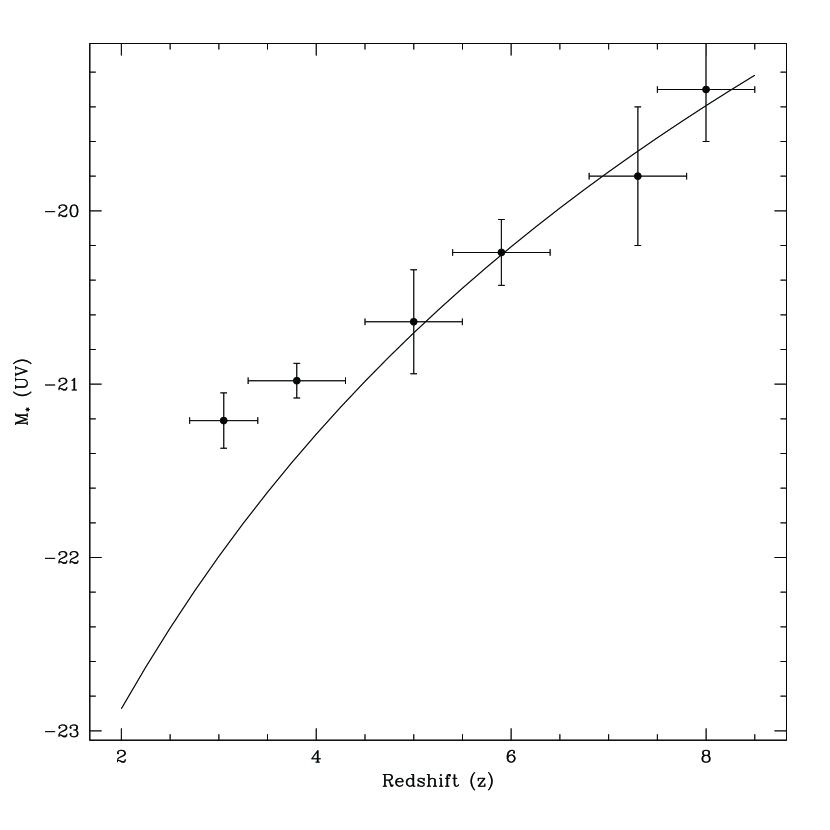
3. Luminosity Putting together the evolution in size and the constancy of surface luminosity for both the LBGs and LAEs, we can reproduce the observed evolution of in LBGs and LAEs. The UV luminosity function of Lyman- galaxies does not evolve measurably for redshifts (Ouchi et al. 2008). On the other hand the luminosity function of LBGs does evolve, with getting brighter at lower redshifts (e.g. Bouwens et al. 2008). In figure 3, we plot our prediction for the redshift evolution of — based on the observed size evolution and constant characteristic surface brightness of LBGs— and plot for comparison the observed evolution in . We see that the observed evolution is reproduced well by our model, except for the lowest redshift points, where corrections for dust extinction become important. In deriving the constant upper envelope to star formation intensity, both Meurer et al (1997) and Hathi et al (2008) applied dust extinction corrections based upon the observed spectral slope . However, the characteristic luminosity and corresponding magnitude , as plotted in figure 3, are uncorrected for dust. At , the measured falls on the model curve. At , Hathi et al (2008) report a value of that is redder by in power law slope, corresponding to an mag increase in Å dust extinction, while the observed is mag fainter than the model. At , the is redder by 0.5 units, the predicted extinction becomes 1 magnitude (relative to ), and the observed offset is about mag. Thus, within the uncertainties, our treatment provides a good explanation for the evolution of , and dust extinction effects can account for the most significant deviations between the model and the observations.
A full calculation of the luminosity function would depend on the bivariate probability distribution of galaxy size and galaxy surface brightness. However, by restricting our attention to , we avoid much of this complexity. Since is a “knee” in the luminosity function, above which the number of galaxies drops exponentially, we expect that galaxies will correspond roughly to the upper envelope of star formation intensity.
5 Discussion
At this point the alert reader will note that of the three quantities radius, luminosity, and surface luminosity, only two are independent. So once we have determined the size evolution with redshift and know that the upper envelope of the surface brightness stays constant, we can then predict the redshift evolution of (fig. 3). The relevant question then becomes: of these three properties, which two are the independent variables, and which one is the dependent property? For that, we will rely on which two quantities seem more physically fundamental.
The upper limit to the surface luminosity is a natural candidate. The upper limit for LBGs and low-redshift starbursts observed by Meurer et al 1997, Hathi et al. 2008, and here, corresponds to the maximum pressure measured in starburst galaxies driving winds (Heckman, Armus & Miley (1990). The LBGs also show evidence for strong winds in the line profiles and relative velocities between absorption and emission lines (e.g. Steidel et al. 2010).
The observed size evolution of LBGs can be understood in terms of growth of disks. If LBG selection identifies galaxies with a particular rotation speed at all redshifts, we should expect their typical size to grow with redshift as (Fall & Efstathiou 1980). Of course, it is not entirely clear that the LBGs, or Lyman- galaxies, are disks in formation. Ravindranath et al. 2006 find that only 40% of LBGs at have exponential profiles. Similar results are seen for Lyman- galaxies at z=3.1 (Gronwall et al. 2010).
It could well be that Lyman- galaxies show us a very early stage of galaxy formation, as initially suggested by Partridge & Peebles (1967). This is supported by the small physical sizes, smaller dust extinction, younger stellar ages and lower stellar masses seen for most (though not all) Lyman- galaxies (Pirzkal et al. 2007, Gawiser et a. 2007, Finkelstein et al. 2007, 2008, 2009, Pentricci et al. 2008). The first observational demonstration of the extreme youth of the stellar populations in these galaxies came from the high equivalent widths of the Lyman- line, which arises most naturally from stellar populations younger than 30 Myr (Malhotra & Rhoads 2002). Studies of correlation functions of Lyman- galaxies also indicate that the duty cycle of Lyman- emitting phase is about 15% (e.g., Kovač et al 2007). The bias inferred from the correlation function matches that of low redshift galaxies, further supporting the idea that Lyman- emitters may be building blocks of typical present-day galaxies (e.g. Gawiser et al 2007). On the other hand, there is some controversy whether those Lyman break-selected galaxies showing Lyman- line emission are older or younger than their counterparts without line emission (Kornei et al. 2010, Pentericci et al 2008). Perhaps size is the crucial property that determines whether or not a galaxy shows Lyman- emission.
So far, we have discussed the sizes of galaxies as seen in the UV continuum. This allows us to compare the LBGs and Lyman- galaxies on an equal basis. The Lyman- galaxies may show a different size in line emission: larger, if the resonant scattering of Lyman- photons to escape from the galaxy is important; and smaller if the Lyman- comes from an active nucleus. Rhoads et al (2009) examined the sizes of galaxies in the Lyman- line and the adjoining continuum using data from slitless spectroscopy, and found no significant difference in FWHM in the line and continuum. HST imaging in narrow bandpass dominated by the Lyman- line flux also exists for a few cases (Bond et al. 2010, Finkelstein et al. 2010b). Bond et al (2010) found no measurable difference in sizes using narrow and broad-band images. Finkelstein et al. (2010b) examined three z=4.4 LAEs in HST narrowband imaging and found them to belarger in Lyman- than in their rest-frame UV continuum light, with rh = 1.20 0.03 and rh = 0.80 0.02 kpc for the Lyman- and UV light, respectively. This implies that resonant scattering plays a role in LAEs, as it is altering the escape path of Lyman- photons. A similar result has recently been obtained by stacking LBGs, which shows that extended low surface brightness Lyman- emission may be a common feature of LBGs (Steidel et la 2011).
6 Conclusions
We have shown that the growth in characteristic luminosity of high redshift star-forming galaxies proceeds in step with their growth in size, due to their observed maximum surface brightness (which in turn may be explained by galactic wind feedback).
We have also shown that a compact physical size is a key factor in whether or not a galaxy is a Lyman- emitter. This is true for all redshifts in the range , and Lyman- galaxies are faint at these redshifts because of their small sizes. The more fundamental question, then, is why do we see the same size for galaxies with Lyman- emission across the redshift range 2–7? The Lyman- line is resonantly scattered, which increases its path length in neutral gas and therefore the chance of its being absorbed by dust— although in a clumpy medium it can escape (Neufeld 1990, Finkelstein et al. 2008, 2009). Galactic winds also help in the escape of Lyman- photons by shifting the photons away from the resonant frequency (Santos 2004, Verhamme et al 2006, McLinden et al. 2010). It seems likely that larger galaxies have larger optical depths, so that Lyman- photons are resonantly scattered and we no longer see the line in emission. It could also be that larger galaxies contain multiple starbursting regions, resulting in incoherent flows on a galaxy-wide scale. This in turn could hamper Lyman- escape, since any particular line of sight would be likely to sample gas at a wide range of velocities. Larger, more massive galaxies also tend to have more metals from previous generations of star-formation, leading to more dust and fewer Lyman- photons escaping. While we do not completely understand the relative importance of all the mechanisms that aid in Lyman- escape, the small sizes of these galaxies give us a crucial clue to their nature.
References
- Bertin & Arnouts (1996) Bertin, E., & Arnouts, S. 1996, A&AS, 117, 393
- Bond et al. (2009) Bond, N. A., Gawiser, E., Gronwall, C., Ciardullo, R., Altmann, M.,& Schawinski, K. 2009, ApJ 705, 639
- Bond et al. (2010) Bond, N. A., Feldmeier, J. J., Matković, A., Gronwall, C., Ciardullo, R., & Gawiser, E. 2010, Astrophys. J. 716, L200
- Bouwens et al. (2004) Bouwens, R. J., Illingworth, G. D., Blakeslee, J. P., Broadhurst, T. J., & Franx, M. 2004, Astrophys. J. 611, L1
- Bouwens et al. (2006) Bouwens, R. J., Illingworth, G. D., Blakeslee, J. P., & Franx, M. 2006, Astrophys. J. 653, 53
- Bouwens et al. (2007) Bouwens, R. J., Illingworth, G. D., Franx, M., & Ford, H. 2007, Astrophys. J. 670, 928
- Bruzual & Charlot (2003) Bruzual, G., & Charlot, S. 2003, Mon. Not. R. Astron. Soc., 344, 1000
- Calzettiet al. (1994) Calzetti, D., Kinney, A. L., & Storchi-Bergmann T. 1994, Astrophys. J. 429, 582.
- Capaket al. (2007) Capak, P., et al 2007, ApJS 172, 99
- Cowie&Hu (1998) Cowie, L. L., & Hu, E. M. 1998, Astron. J. 115, 1319
- Fall&Efstathiou (1980) fall80 Fall, S. M., & Efstathiou, G. 1980, Mon. Not. R. Astron. Soc. 193, 189
- Fergusonet al. (2004) Ferguson04 Ferguson, H. C., et al. 2004, Astrophys. J. 600, L107
- Finkelsteinet al. (2007) Finkelstein, S. L., Rhoads, J. E., Malhotra, S., Pirzkal, N., Wang, J. X. 2007, Astrophys. J. 660, 1023
- Finkelsteinet al. (2008) Finkelstein, S. L., Rhoads, J. E., Malhotra, S., Grogin, N., & Wang, J. X. 2008, Astrophys. J. 678, 655
- Finkelsteinet al. (2009) Finkelstein, S. L., Rhoads, J. E., Malhotra, S., & Grogin, N. 2009, Astrophys. J. 691, 465
- Finkelsteinet al. (2010a) Finkelstein, S. L., Hill, G. J., Gebhardt, K., Adams, J., Blanc, G. A., Papovich, C., Ciardullo, R., Drory, N., Gawiser, E., Gronwall, C., Schneider, D. P., & Tran, K.-V. 2010a, Astrophys. J. 729, 140
- Finkelsteinet al. (2010b) Finkelstein, S. et al. 2010b, submitted to Astrophys. J., arXiv:/1008.0634
- Gawiseret al. (2006) Gawiser, E. et al. 2007, Astrophys. J. 671, 278
- Giavaliscoet al. (2004) Giavalisco, M., et al 2004, ApJ 600, L93
- Hathiet al. (2008) Hathi, N. P., Malhotra, S., & Rhoads, J. E. 2008, Astrophys. J. 673, 686
- Heckmanet al. (1990) Heckman, T. M., Armus, L., & Miley, G. K. 1990, Astrophys. J. Supp. 74, 833
- Huet al. (1998) Hu, E. M., Cowie, L. L., & McMahon, R. G. 1998, Astrophys. J. 502, L99
- Korneiet al. (2010) Kornei, K. A., Shapley, A. E., Erb, D. K., Steidel, C. C., Reddy, N. A., Pettini, M., & Bogosavljević, M. 2010, Astrophys. J. 711, 693
- Kovacet al. (2007) Kovač, K., Somerville, R. S., Rhoads, J. E., Malhotra, S., & Wang, J. X. 2007, Astrophys. J. 668, 15
- Lehnert&Heckman (1996) Lehnert, M. D., & Heckman, T. 1996, Astrophys. J. 472, 546
- Malhotra&Rhoads (2002) Malhotra, S. & Rhoads, J. E. 2002, Astrophys. J. 565, L71
- Matsudaet al. (2004) Matsuda, Y. et al. 2004, Astron. J. 128, 569
- Mclindenet al (2010) McLinden, E. M., Finkelstein, S. L., Rhoads, J. E., Malhotra, S., Hibon, P., Richardson, M. L. A., Cresci, G., Quirrenbach, A., Pasquali, A., Bian, F., Fan, X., & Woodward, C. E. 2010, Astrophys. J. 730, 136
- Meureret al. (1997) Meurer, G. R., Heckman, T. M., Lehnert, M. D., Leitherer, C., & Lowenthal, J. 1997, Astron. J. 114, 54
- Nagamineet al (2010) Nagamine, K., Ouchi, M., Springel, V., & Hernquist, L. 2010, PASJ 62, 1455
- Nilssonet al (2009) nilsson09 Nilsson, K. K., et al 2009, Astron. Astrophys. 498, 13.
- Nilssonet al. (2009b) nilsson09b Nilson et al. 2009b, Mon. Not. R. Astron. Soc., 400, 232.
- Ouchiet al. (2008) Ouchi, M., et al 2008, Astrophys. J. Supp. 176, 301-330.
- Overzieret al (2006) Overzier, R. A., et al. 2006, Astrophys. J. 637, 58
- Partridge&Peebles (1967) Partridge, B., & Peebles, P. J. E. 1967, Astrophys. J. 147, 868
- Pentericciet al. (2007) Pentericci, L., Grazian, A., Fontana, A., Salimbeni, S., Santini, P., De Santis, C., Gallozzi, S., & Giallongo, E. 2007, Astron. Astrophys. 471, 433
- Pirzkalet al (2007) Pirzkal07 Pirzkal, N, Malhotra, S., Rhoads, J., & Xu, C. 2007, Astrophys. J. 667, 49
- Rhoadset al. (2009) Rhoads, J. E. et al. 2009, Astrophys. J. 697, 942
- Santos (2004) Santos, M.R., 2004, MNRAS, 349, 1137.
- Scovilleet al. (2007) Scoville, N., et al 2007, ApJS 172, 46
- Steidelet al (2000) Steidel, C. C., Adelberger, K. L., Shapley, A. E., Pettini, M., Dickinson, M., & Giavalisco, M. 2000, Astrophys. J. 532, 170.
- Steidelet al. (2010) Steidel, C. C., Erb, D. K., Shapley, A. E., Pettini, M., Reddy, N., Bogosavljević, M., Rudie, G. C., & Rakic, O. 2010, Astrophys. J. 717, 289
- Steidelet al. (2011) Steidel, C. C., Bogosavljević, M., Shapley, A. E., Kollmeier, J. A., Reddy, N. A., Erb, D. K., & Pettini, M. 2011, arXiv:1011.2204v2
- Taniguchiet al (2009) Taniguchi, Y., et al 2009, Astrophys. J. 701, 915
- Thompsonet al (2005) Thompson, T. A., Quataert, E., & Murray, N. 2005, Astrophys. J. 630, 167
- Tilviet al. (2009) Tilvi, V., et al. 2009, Astrophys. J. 704, 724
- Venemanset al. (2005) Venemans, B. P., et al. 2005, Astron. Astrophys. 431, 793
- Verhammeet al. (2006) Verhamme, A., Schaerer, D., & Maseli, A. 2006, Astron. Astrophys. 460, 397