X-ray Constraints on the Ly Escape Fraction
Abstract
We have coadded the X-ray flux of all known Ly emitters in the 4 Msec Chandra Deep Field South (CDF-S) region, achieving the tightest upper limits yet on the X-ray to Ly ratio. We use the X-ray data to place sensitive upper limits on the average unobscured star-formation rate (SFRX) in these galaxies. A very small fraction of Ly galaxies in the field are individually detected in the X-rays, implying a low fraction of AGN activity. After excluding the few X-ray detected Lyman alpha emitters (LAEs), we stack the undetected LAEs located in the 4 Ms CDF-S data and 250 ks Extended CDF-S (ECDFS) data, and compute a 1- upper limit on SFRX 1.6, 14, 28, 28, 140, 440, 880 M⊙ yr-1 for LAEs located at z 0.3 and z = 2.1, 3.1, 3.2, 4.5, 5.7 and 6.5, respectively. The upper limit of SFRX in LAEs can be then be compared to SFRLyα derived from Ly line and thus can constrain on the Ly escape fraction (). The from X-ray at z 0.3 is substantially larger than that from UV or H. Three X-ray detected LAE galaxies at z 0.3 show 3-22%, and the average Ly escape fraction from stacking the X-ray undetected LAEs show 28% at 3 significance level at the same redshift. We derive a lower limit on 14% (84 % confidence level, 1 lower limit) for LAEs at redshift z 2.1 and z 3.1-3.2. At z 4, the current LAE samples are not of sufficient size to constrain SFRX well. By averaging all the LAEs at z 2, the X-ray non-detection constrains 17% (84 % confidence level, 1 lower limit), and rejects 5.7% at the 99.87% confidence level from 2.1 6.5.
1 INTRODUCTION
Ly emission, the 1216 Å (n = 21) transition of hydrogen in emission, is a prominent tracer of ionizing photons produced by young stars. This line can carry up to 6% of the bolometric luminosity of a star forming galaxy (Partridge & Peebles 1967), therefore it is an easy handle for detection of both star forming galaxies and active galactic nuclei (AGN, where Ly emission is powered by the ionizing photons produced at the accretion disk around the central massive black hole) at redshifts 2. The Ly line-search technique has been used successfully to identify samples of high redshift galaxies for over a decade, using narrowband images (e.g., Cowie & Hu 1998; Rhoads et al. 2000, 2003; Malhotra & Rhoads 2002, Gawiser et al. 2007; Finkelstein et al. 2008, 2009; Guaita et al. 2010) and spectroscopic surveys (e.g., Pirzkal et al. 2004, Deharveng et al. 2008, Martin et al. 2008, Rhoads et al. 2009, and Blanc et al. 2010). There are thousands of photometrically selected Ly emitters (hereafter LAEs), with hundreds of spectroscopic confirmations (e.g., Hu et al. 2004, Dawson et al. 2007, Wang et al. 2009) at redshifts ranging from 0.3 (Deharveng et al. 2008) to 7 (Iye et al. 2006).
Since Ly line searches have achieved notable success in identifying high redshift star-forming galaxies, it is very important to understand the radiation transfer of the Ly emission line. However, interpreting the Ly line is not trivial, because Ly photons are resonantly scattered when they interact with the surrounding neutral hydrogen in the inter-stellar medium (ISM). These radiative transfer effects can be quite complex when considering the presence of dust in a multiphase and moving interstellar medium (Neufeld 1991, Hansen & Oh 2006; Finkelstein et al. 2009c), and require empirical study of the fraction of Ly photons of which can escape the ISM. Indeed, empirical results on the Ly escape fraction offer one of the better tools for probing the physics of Ly escape, which is determined on spatial scales that are usually unresolved in distant or nearby galaxies. On the theory side, semi-analytical models of LAE populations by Le Delliou et al. (2005) assume a constant escape fraction of fesc = 0.02, and hydrodynamical models of LAEs at z 3 predict fesc = 0.05-0.1 (Nagamine et al. 2010, Shimizu et al. 2011).
On the observational side, to measure the fraction of Ly photons escaping the ISM (hereafter the Ly escape fraction), we often require a flux measurement in ultraviolet (UV) continuum or a non-resonant recombination line, such as H, and a dust extinction value. The dust corrected UV luminosity or H luminosity, like the intrinsic Ly luminosity, are mainly contributed by young stars, thus connected to the intrinsic star formation rate (SFR). Recent constraints at z 0.3 (Atek et al. 2009) and at z 2.25 (Hayes et al. 2010) are based on the line ratio between H and Ly. With the optical spectroscopic observation of GALEX selected LAEs, Atek et al. (2009) showed that the Ly escape fractions span a wide range (from fesc 0.5 to 100 %) and decrease with increasing dust extinction. Hayes et al. (2010) estimated an average Ly escape fraction of 5% with a double blind survey targeting Ly and H at z = 2.25. With the dust-corrected UV emission of 98 LAEs at z 1.9-3.8 detected through integral-field spectroscopy survey, Blanc et al. (2010) got a median Ly escape fraction of 29%. However, the escape fractions estimated from both of these methods are sensitive to the dust extinction law. For example, under the case B recombination, if we ignore the resonant scattering and velocity field in the gas or ISM geometry, the Ly escape fraction is presented as fesc = 10 (Atek et al. 2009), and the extinction coefficient at Ly wavelength goes from 9.9 to 12.8 for Cardelli et al. (1989) and Calzetti et al. (2000) laws, respectively. This will lead to a factor of two difference in the inferred fesc when E(B-V) 0.3. Meanwhile, the escape fractions estimated here also depend on the selection methods of LAEs. At z 0.3, the LAEs are selected from a spectroscopic followup of FUV dropouts (Atek et al. 2009), so the escape fractions here refer to a subsample of dropout galaxies at that redshift. At z 2.25, the average Ly escape fraction is estimated from 18 LAEs and 55 H emitters, and only 6 have both Ly and H detection (Hayes et al. 2010). So the escape fraction at z 2.25 estimated by Hayes et al. (2010) is a global Ly escape fraction for all galaxies at that redshift. The narrowband surveys for high-z LAEs can be designed to use the same criteria, e.g., the threshold equivalent width of EW 20 Å and the Ly line flux limit estimated from narrowband and broadband images, however, we should note that the Ly escape fraction is dependent on the choice of the threshold equivalent width, and the narrowband exposure depth. Shallower narrowband surveys tend to select bright LAEs, which may have smaller Ly EWs (e.g., Ando et al. 2006), and a decrease in the value of threshold equivalent width will contain more objects with little-to-no Ly fluxes as well as interlopers.
X-ray photons, especially hard X-ray photons, can give an extinction-free measurement of star formation in galaxies. First, the X-ray emission of high-redshift star-forming galaxies are mainly from supernovae (SNe), hot interstellar gas (i.e., K), and high-mass X-ray binaries (HMXBs), all of which trace star formation ongoing in the last few million years. Nandra et al. 2002, Grimm et al. 2003, Ranalli et al. 2003, and Gilfanov, Grimm & Sunyaev (2004) have shown a linear correlation between LX and SFR. Calibration with the total SFR from far-infrared (FIR) and ultraviolet (UV) bands for local and high-z (z 1 and z 3) star-forming galaxies (in the Chandra Deep Field North and South, CDF-N and CDF-S, where the deepest X-ray observations exist) show relations consistent with Ranalli et al. (2003)111Ranalli et al. (2003) had calibrated the relations between X-ray luminosities and radio/FIR luminosities, and converted to global SFR (refereed to stars with 5 M☉ and Salpeter’s Initial Mass Function (IMF)) following Condon (1992, radio luminosities) and Kennicutt (1998, FIR luminosities). :
| (1) |
Second, X-rays penetrate a typically dusty interstellar medium much more easily than UV light. For example, a column density of cm-2 is required to attenuate 2 keV X-rays by a factor of 2. The corresponding reddening would be mag, corresponding to mag and mag, or a factor of , based on ratios of dust to gas from either our Galaxy ( mag cm2 atoms-1) or from a set of three gravitationally lensed galaxies at high redshift ( = (1.4 0.5) 10-22 mag cm2 atoms-1; Dai et al 2006).
In this paper, we present an independent analysis of the Ly escape fraction at 0.3, 1, and 2 6.5, using X-ray emission as a tracer of the intrinsic SFR. We use the new 4 Msec Chandra X-ray image in the CDF-S, which include LAEs at z 0.3 and 1.0 selected by GALEX, and ground-based narrowband selected LAEs at z = 2.1, 3.1, 3.15, 4.5, 5.7, and 6.5. By comparing the ratio of derived SFRs from observed Ly line flux and X-ray, we will perform an independent measurement of the Ly escape fraction for LAEs. The optical samples and X-ray data are presented in §2, and the X-ray detection and stacking results on LAEs are presented in §3. The results and discussion on X-ray constrained Ly escape fraction are presented in §4 and §5, respectively.
2 OPTICAL AND X-RAY DATA
In the Chandra Deep Field South region, samples of Ly emitters have been observed at various redshifts, including Ly emitters at z = 0.195-0.44 and z = 0.65-1.25 through GALEX grism spectroscopy (Deharveng et al. 2008, Cowie et al. 2010, Cowie et al. 2011), and ground-based narrowband imaging selected Ly emitters at z = 2.1 (Guaita et al. 2010), z = 3.1 (Gronwall et al. 2007, Ciardullo et al. 2011 in prep.), z = 3.15 (Nilsson et al. 2007), z = 4.5 (Finkelstein et al. 2009), z = 5.7 (Wang et al 2005) and z = 6.5 (Rhoads et al in prep.). The GALEX LAEs were confirmed by ground based optical spectroscopy (Cowie et al. 2010, 2011). At higher redshift (z 2), all the narrowband selected samples typically have a spectroscopic confirmation fraction greater than 70% (Dawson et al. 2007, Gawiser et al. 2007, Wang et al. 2009). In this paper we focus on LAEs covered in the CDF-S proper region. The number of LAEs at each redshift and their stacked X-ray properties are presented in Tables 1 and 2.
The 4 Ms Chandra Advanced CCD Imaging Spectrometer (ACIS) exposure of the CDF-S is composed of 52 individual ACIS-I observations, 9 of which were obtained in 2000, 12 from September to November 2007, and 31 from March to July 2010. The event-2 file and exposure-map files are available at the Chandra website (http://cxc.harvard.edu/cdo/cdfs.html). To search for potential X-ray counterparts for our LAEs, we use the 4-Ms CDF-S catalog published by Xue et al. (2011) for the following source cross-match and source-masking processes.
3 X-RAY INDIVIDUAL DETECTION AND STACKING PROCEDURE
3.1 Individual detections in Chandra images
We search for X-ray counterparts for individual LAEs within a 2 radius. Among LAEs selected in the 4 Msec CDF-S region using the GALEX FUV channel (which covers Ly at ), 3 of 6 (found at ) are detected in X-rays. These three have relatively modest luminosities L2-10keV 1042 ergs s-1, and have been classified as galaxies from their optical spectra (Cowie et al. 2010, 2011). Their UV and X-ray properties are presented in Table 1. Note that all three detected galaxies show a soft-band X-ray detection, while their hard-band luminosities are upper limits, but remain consistent with their soft band luminosities under the = 2 assumption. For Ly galaxies selected in the GALEX NUV channel (which covers Ly at ), the corresponding number is 4 X-ray detections out of 5 objects in the 4 Msec Chandra coverage. These four objects have X-ray luminosities L2-10keV 61043 ergs s-1, and can be classified as AGNs.
X-ray counterparts have previously been detected for a small fraction ( 5%) of the LAEs at higher redshifts. Guaita et al. (2010) detected X-rays from 10 of their 216 = 2.1 LAEs in the ECDF-S region, using the 2Msec Chandra image for those LAEs in the central CDF-S (Luo et al. 2008), and the 250 ksec Chandra image (Lehmer et al. 2005) for those in the wider ECDFS. Gronwall et al. (2007) and Ciardullo et al (in prep.) selected 278 LAE candidates at z = 3.1, and only 5 were X-ray detected. At z = 4.5, only 1 of 113 LAE candidates show X-ray detection in ECDF-S field (Zheng et al. 2010) and is classified as an AGN at the same redshift, and no X-ray detections were found for 24 LAE candidates at z = 3.15 (Nilsson et al. 2007), 25 LAE candidates at z = 5.7 (Wang et al. 2005), or 11 LAE candidates at z = 6.5 (Rhoads et al. in prep.). In this paper, these previous X-ray detections are excluded, and we find no new X-ray detection with the 4 Ms Chandra exposure.
We calculate the X-ray signal-to-noise ratio for the X-ray non-detected LAEs, all of which show S/N 3. The S/N ratios were calculated as (Gehrels 1986), where and are the net counts and total counts extracted from their 50% Chandra ACIS PSF circles222 The background counts () were estimated from an annulus with 1.2R95%PSF R 2.4R95%PSF (after masking out nearby X-ray sources). in 0.5-2, 2-7 and 0.5-7 keV band respectively. To convert from X-ray counts to fluxes, we have assumed a powerlaw spectrum with photon index of = 2 (except where explicitly stated otherwise), which generally represents the X-ray spectra of both starburst galaxies (e.g., Lehmer et al. 2008) and type 1 AGNs. When converted from PSF-corrected count-rate to flux, the full and hard bands were extrapolated to the standard upper limit of 10 keV. All X-ray fluxes and luminosities presented in this paper have been corrected for Galactic absorption (Dickey & Lockman 1990). The 4 Ms CDF-S data reaches on-axis sensitivity limits of X-ray luminosity Lg [39.6, 40.9, 41.5, 41.9, 41.9, 42.3, 42.5, 42.6] at z = [0.3, 1.0, 2.1, 3.1, 3.2, 4.5, 5.7, 6.5] (with the on-axis soft band flux limit of 9.1 10-18 erg cm-2 s-1, Xue et al. 2011), which means that we may find all the AGNs (including type 2 AGNs) hidden in the z0.3 and z1 LAEs located in the CDF-S region.
3.2 Stacking analysis
We stacked the X-ray data at the positions of the non-detections at each redshift, following Zheng et al. (2010). After masking out the X-ray detected sources with 95% PSF circles, we co-added the net and background counts of the X-ray non-detected LAEs in each sample. The stacked net and background counts in the soft, hard and 0.5-7 keV band, as well as the summed effective Chandra exposure time are presented in Table 2. We used the 95% PSF region for bright source extraction, and 50% PSF region for upper limit estimate333PSF radii at various flux fractions were based on a polynomial approximation of the off-axis ACIS-I PSF, as discussed in http://cxc.harvard.edu/chandra-users/0192.html.. The results are about 0.2 dex lower than upper limit from 95% PSF extraction.
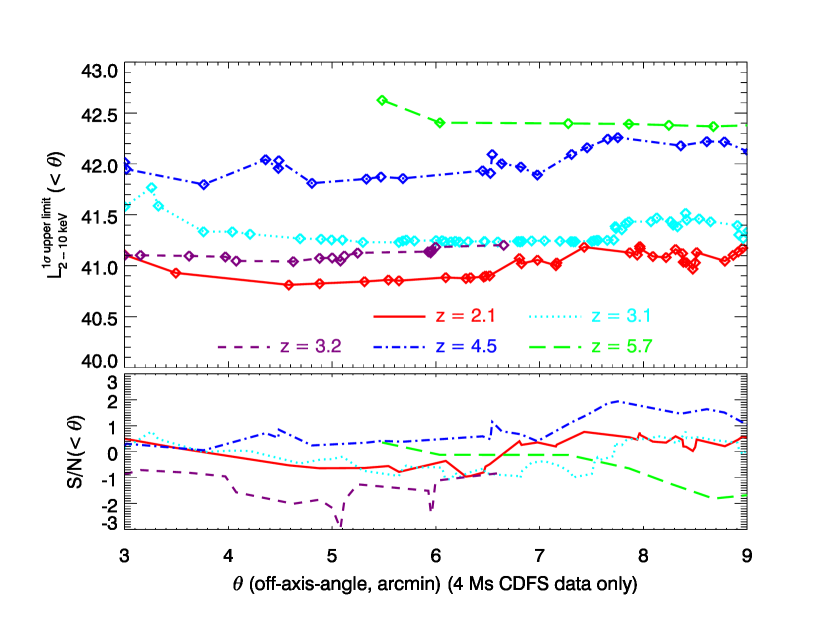
In Figure 1 we plot the 1 upper limits (upper plot) on the mean X-ray luminosity for each studied redshift in the selection region (parameterized by the maximum off-axis angle for inclusion in the sample), and the S/N ratios of the stacked signals are also plotted in the lower part. From Figure 1 we can see than the mean luminosity can be better constrained by excluding LAEs with larger off-axis angles. This is mainly because the Chandra ACIS has much larger PSF and much lower collection area at larger off-axis angles, so that including those LAEs with large off-axis angles would bring strong fluctuations to the signal without necessarily increasing the S/N. In the following study, we exclude those LAEs with ACIS off-axis angle above 6, and the number of LAEs used for stacking and their stacked results at relative redshifts are presented in Table 2.
4 RESULTS AND DISCUSSION
4.1 SFR-Luminosity Correlation
We adopted the relations established at z = 0 to convert luminosities to SFRs for our LAE samples: Kennicutt (1998) for conversion of the Ly luminosity (assuming Case-B conditions and Salpeter’s IMF with mass limits 0.1 and 100 ), and Ranalli et al. (2003) for the X-ray luminosities:
| (2) |
Note that these relations might give uncertainties as well as the factor of 2 dispersion (e.g., dust extinction, burst age and IMF) when applied to individual sources. However, previous X-ray stacking works (e.g., Nandra et al. 2002, Seibert et al. 2002, Lehmer et al. 2005, and Reddy & Steidel 2004) have proved reasonable LX-SFRX connection on local starburst galaxies and 1 z 3 LBGs.
Table 1 shows the SFR estimates based on the Ly (“SFRLyα”) luminosity and 2-10 keV (“SFRX”) luminosity for three z0.3 GALEX selected LAEs. Table 2 shows the SFRX estimates from the stacking signal of the X-ray undetected LAEs at z 0.3, 1.0, 2.1, 3.1, 3.2, 4.5, 5.7 and 6.5. It can be seen that at z 4.5, the SFRX limits are weaker due to a larger luminosity distance, and comparatively smaller Ly sample size.
Note that low-mass X-ray binaries (LMXBs) can also contribute to X-ray emission from galaxies, but they have longer evolutionary time scales (on the order of the Hubble time), and therefore track the integrated star-formation history of galaxies (i.e., the total stellar mass). Where LMXBs are important, e.g. for nearby normal galaxies (Colbert et al. 2004) and luminous infrared galaxies (Lehmer et al. 2010), the X-ray luminosity can be fitted as a function of both galaxy galaxy stellar mass and SFR:
| (3) |
Here Lx , M∗, and SFRX have units of ergs s-1 , M⊙ , and M⊙ yr-1, respectively, and constants ergs s-1 M = 1.51 and 0.91, and ergs s-1 (M⊙ yr-1) = 0.81 and 1.62 for Colbert et al. (2004) and Lehmer et al. (2010), respectively. The differences in the parameters might be introduced by the high obscuration in luminous infrared galaxies. We can see from these relations, the contribution of X-ray emission from LMXBs can be ignored in actively star-forming galaxies, which often have low dust extinction (0 E(B-V) 3), lower stellar mass (M∗ 109 M⊙), and more active star formation (SFRX 1 M⊙ yr-1) than local galaxies (e.g., Guaita et al. 2011). In terms of the specific star formation rate (SSFR), which is defined as the ratio of star formation rate to stellar mass, we can neglect the LMXB term whenever , so that , i.e., whenever the typical stellar ages are much below 1 Gyr.
The SFRX of high redshift star-forming galaxies was measured by Nandra et al. (2002), who detected a stacked X-ray signal of 3 Lyman Break Galaxies (LBGs) in the Hubble Deep Field North. The average X-ray luminosity of 3 LBGs is L2-10 = 3.4 1041 ergs s-1 (6- significance), implying a SFRX = 6413 M☉ , in excellent agreement with the extinction-corrected UV estimates. In the same field, Laird et al. (2006) found the average SFRX of 42.47.8 M⊙ yr-1 for z 3 LBGs. Additionally, Lehmer et al. (2005) reported the average SFRX of 30 M⊙ yr-1 for z 3 LBGs in CDF-S (old 1 Ms Chandra exposure). Lehmer et al. also stacked LBGs in CDF-S at z4, 5, and 6, and did not obtain significant detections (3 ), deriving rest-frame 2.0-8.0 keV luminosity upper limits (3 ) of 0.9, 2.8, and 7.1 1041 ergs s-1, corresponding to SFRX upper limits of 18, 56 and 142 M⊙ yr-1, respectively. Note also that a 3 stacking signal of the optically bright subset (brightest 25%) of LBGs at z4 was detected, corresponding to an average SFRX of 28 M⊙ yr-1. Reddy & Steidel (2004) examined the stacked radio and X-ray emission from UV-selected spectroscopically confirmed galaxies in the redshift range 1.5 3.0. Their sample showed SFRX 50 M⊙ yr-1, and found a consistent SFRX/SFRUV,uncorr 4.5-5.0 for galaxies over the redshift range 1.5 3.0. These studies demonstrate the value of stacking the deepest X-ray observations to measure star formation activity, with little sensitivity to dust.
The LAEs’ X-ray emission should be directly connected to the intrinsic SFR, since LAEs are thought to be less massive and much younger than LBGs at high-redshift (e.g., Venemans et al 2005; Pirzkal et al 2007; Finkelstein et al 2008, 2009c), and the AGN fraction in LAEs is also very small ( 5%, e.g., Zheng et al. 2010). An X-ray detection could give us a more accurate unbiased SFR estimate, or more properly an upper limit, since faint AGN may contribute to the X-ray flux. The first X-ray observations of high–redshift LAEs were presented in Malhotra et al. (2003) and Wang et al. (2004) at z4.5 with two 170 ks Chandra exposures. No individual LAEs were detected, and a 3- upper limit on the X–ray luminosity (L2-8keV 2.8 1042 ergs s-1) was derived by an X-ray stacking method (Wang et al. 2004). From a stacking analysis of the non-detected LAEs in the much deeper 2 Ms CDF-S field and a larger 250 ks ECDFS field, Guaita et al. (2010), Gronwall et al. (2007) and Zheng et al. (2010) found a smaller 3- upper limit on the luminosity of 1.9 1041 ergs s-1, 3.1 1041 ergs s-1 ,2.4 1042 ergs s-1 at z = 2.1, z = 3.1 and z = 4.5, respectively. These imply upper limits of unobscured average SFRX 43, 70 and 290 M⊙ yr-1, respectively . The above results are not surprising, since we would expect that LAEs have lower SFR rates than LBGs.
4.2 f from X-rays
The average calculated using SFRLyα and SFRX for LAEs at different redshifts are presented in Table 3. The sample selection limits are also presented in Table 3. We should note that the LAEs at z 0.3 and 1 are selected among the GALEX FUV and NUV band drop-out galaxies with 20Å from their follow-up GALEX spectra. So the LAE samples at z 1 are quite different compared to the LAE samples at z 2, which are selected from narrowband excess over broadband with nearly same criteria on the equivalent width (estimated from the broad band to narrowband ratio). In the following discussion, we treat them separately. We only take the soft band upper limits for z 2 LAEs, because soft band flux are more sensitive than the total band and hard band, and at z 2, the observed soft band X-ray photons are closer to rest-frame hard photons, and therefore more robust to a change in photon index (see Figure 2 of Wang et al. 2007) assumed when converting X-ray count-rate to flux.
At 0.3, we only have L0.5-2keV for the three Ly selected galaxies. Although they are not detected in the hard X-ray band, their 3 upper limit on L2-10keV show good consistency with their L0.5-2keV (See table 1). Here we use the SFRX-L0.5-2keV relation from Ranalli et al. (2003), since our detections are in the soft band. We find SFRX 1, 11, and 22 M☉ yr-1, implying Ly escape fractions of 22, 3, and 9%, respectively. Finkelstein et al. (2009b) also derived the dust extinction of A1200 = 0.92 from the SED fitting, corresponding to = SFRLyα/(SFR) = 2-5% (see table 3), which is systematically lower than the from X-ray. X-ray stacking of the undetected z 0.3 LAEs shows a 3 upper limit of SFR 3.2 M☉ yr-1, implying an average Ly escape fraction of 28% at 3 significance level. These X-ray constraints may tell us that at z 0.3, the Ly escape fraction is substantially larger than we thought from the UV or H view.
There are only 2 star-formation dominated LAE galaxies at z 1 in the ECDFS region (excluding the four AGN with individual X-ray detections), so at z 1 the escape fraction is poorly constrained (with () 7%).
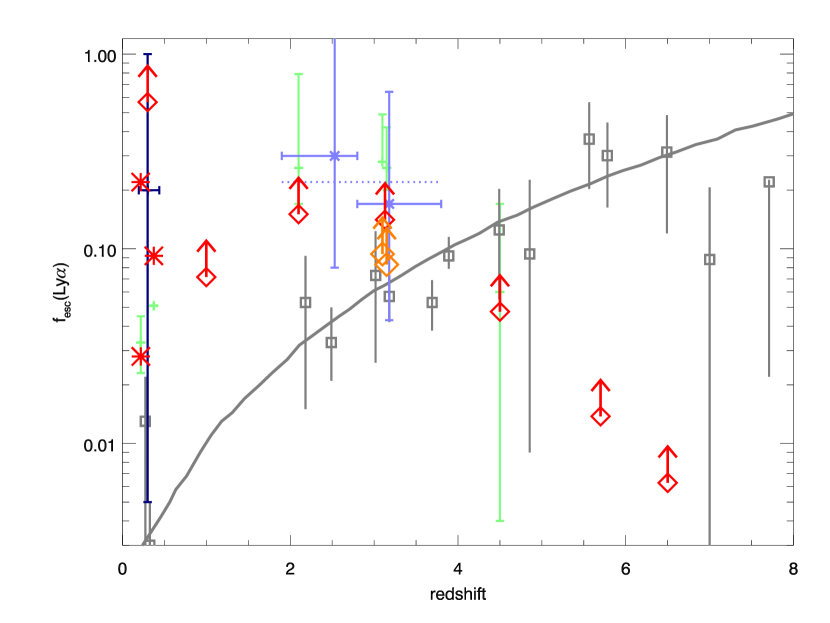
At 2, we do not obtain an X-ray detection after stacking the 69 star-formation dominated LAEs in the central CDF-S field, or after stacking the 351 LAEs in the ECDFS field (see Table 2). We get the 1- upper limits (same as below) on the intrinsic (dust-free) SFRs as SFRX [14, 28, 28, 139, 440, 876] yr-1 for LAEs at z = [2.1, 3.1, 3.2, 4.5, 5.7, 6.5]. The observed SFRs from the Ly line are about 1.9, 2.6 and 2.3 M☉ yr-1 for z = 2.1, 3.1 and 3.2 LAEs on average, and 5 M☉ yr-1 for z 4 LAEs. The ratio SFRLyα / SFRX measures the Ly escape fraction: /X= SFRLyα / SFRX (see Table 3). This is plotted in figure 2, showing the constraints on as a function of redshift. At z = 2.1, the Ly escape fraction of LAEs is above 14%. At z = 3.1 and 3.2, the f is greater than 8% and 9%, separately. Combining the two samples at z 3, we increase the upper limit to f 14%, the same as the upper limit at z = 2.1. At higher redshift, the limits are weaker due to a larger luminosity distance, and comparatively smaller Ly sample sizes.
If the Ly emitters don’t evolve from z = 3.2 to z = 2.1, then we can combine the samples in this redshift range to obtain a more robust limit on the escape fraction. A 1- upper limit on soft band flux is derived as f0.5-2keV 8.5 10-19 . This implies an SFR 14%28% (due to the different SFRLyα average value) during the redshift range 2.1 3.2. This value is consistent with the median value of 29% from blank fields IFU spectroscopically-selected LAEs at 1.9 3.8 (Blanc et al. 2011), but larger than the value of 2, 5-10% in some theoretical models of LAEs (e.g., Le Delliou et al. 2005, Shimizu et al. 2011).
4.3 with 4 Msec CDF-S data
There is no X-ray detection for Ly emitters coadded at any individual redshift bin (z 2). By coadding the 53 Ly emitters at 2.1 3.2, we reach an X-ray flux limit of 8.510-19 ergs cm-2 s-1 (1 ), but still do not detect X-ray photons from these galaxies. This means that the star-formation rate is truly low, as indicated by the Ly line strength. To increase our sensitivity to detect the star formation rate of LAEs, which is relatively low when compared to continuum-selected star-forming galaxies at comparable redshifts, we coadd all the undetected Ly emitters between redshifts 2 and 6.5. The average x-ray emission is still undetected at a 1-sigma flux level of 7.610-19 ergs cm-2 s-1. To convert the flux into luminosity and hence SFR, we need to model the redshift distribution of the sources.
Let us, instead, predict the expected X-ray counts on this average image of Ly galaxies. Assuming the Ly escape fraction for LAEs is , then SFRX = SFRLyα/()= (L, we get
| (4) |
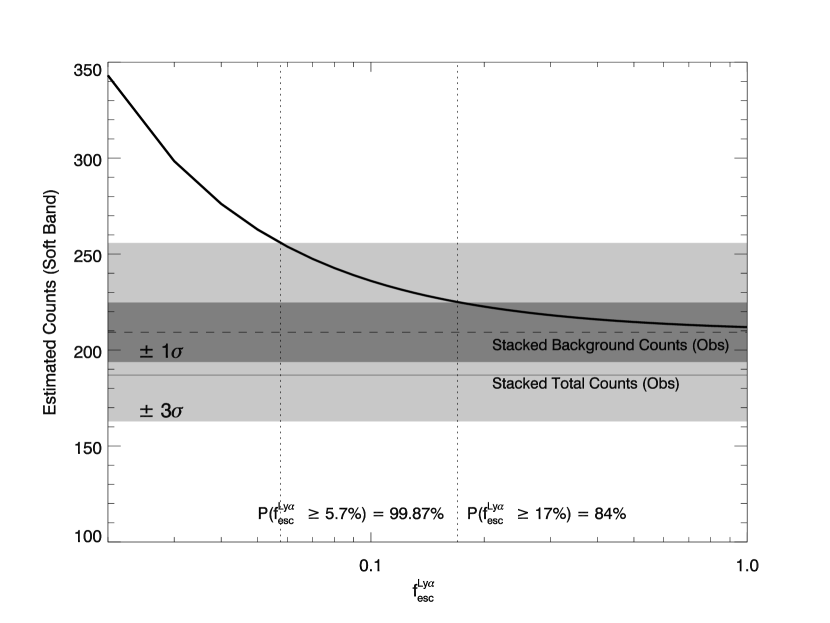
If we assume that all LAEs have an effective X-ray photon index of = 2, then with the X-ray count-rate to flux conversion of 6.64 10-12 erg/cm2 at soft band and SFRLyα from the table 3, we estimate that the expected number of X-ray photons at 4 Ms CDF-S for LAEs should be for LAEs at . This means that we should observe 3 soft X-ray photons per z = 2.1 LAE galaxy in the 4 Ms CDF-S field when 5%, and the observed expected soft X-ray photons decrease to 1 when increases to 15%. Since the background X-ray photons per point source on the ACIS-I CCDs varies from position to position, we take the background value extracted from each LAE candidate, and add the estimated X-ray photons from their corresponding SFRLyα to analyse the probability on . By coadding all LAEs between redshift z = 2 and 6.5, the estimated counts are plotted in Figure 3 as a function of . The signal should be S/N 3 when 5.7%, and S/N when 17%. So we can reject the value of 5% at 99.87% confidence level, and report that the real value of 17% in 84% confidence level.
4.4 (X-ray) vs. (UV/Opt.)
The escape fraction of LAEs has also been discussed using other tracers of the total SFR. Atek et al. (2009) studied z = 0.3 LAEs by using the extinction-corrected H to Ly ratio, which has a ranges of 0.5% to 100% and a median value of 20%. Blanc et al. (2011) studied 1.93.8 LAEs through extinction-corrected UV to Ly ratio and found an average 29%. The f for LAEs estimated from the ratio of SFRLyα and dust-corrected SFRUV, = SFRLyα/(SFR), also exist for our sample. Guaita et al. (2011), Gawiser et al. (2007) and Nilsson et al. (2007) did the stacked SED fitting on the samples at z = 2.1 3.2. At z 0.3 and 4.5, Finkelstein et al. (2008, 2010) did individual SED fitting for LAEs with existing Hubble and Spitzer observations. The dust properties of the SED fitting results at different redshifts are converted to A1200 (see in table 3) using Calzetti et al. (2000). The from dust-corrected UV to Ly ratio for our sample show no evolution from z2 to z3.2, as 26%, and is consistent with 29% of Blanc et al. 2011. At z 4.5, the SED fitting results might be affected by the poor spatial resolution of Spitzer. As an independent estimate on from X-ray, our at z = 0.3 are located at the low end of Atek et al. (2009), while consistent at 1.9 3.8 with Blanc et al. 2011 (see figure 2), and the from the SED fitting results at at z = 2.1, 3.1, 3.2 and 4.5. The LAEs at 0.3 seems different compared to high-redshift LAEs, as they are more AGN contaminated (AGN fraction of 15%–40%, e.g., Scarlata et al. 2009; Cowie et al. 2010; Finkelstein et al. 2009a) and more massive (Finkelstein et al. 2009b). At high-redshift, the AGN fraction in LAEs is very low (AGN fraction 5%, Zheng et al. 2010 and references there in), and AGNs are relatively easy to detect in this deepest Chandra field, so the lower limit of f should be very robust. Our X-ray constraints on the , as well as the estimated from SED fitting, show that the Ly escape fraction need not evolve during the redshift 2.1 3.2.
Hayes et al. (2011) and Blanc et al. (2011) also reported the global evolution of f, which is defined as the ratio of integrated Ly luminosity functions from LAEs and the global extinction-corrected SFR density at different redshift. The global extinction-corrected SFR densities were integrated from H or UV luminosity. However, we should point out that at z 1, 3, 4, and 5, the SFRX/SFRUV,uncorr 4.5-5 for LBGs, consistent with the dust extinction values from other methods (Nandra et al. 2002, Lehmer et al. 2005, Reddy & Steidel 2004). Note that the Ly luminosity functions of LAEs do not evolve during 3 z 6 (e.g., see Ouchi et al. 2008), while the relative numbers of LAEs to LBGs increased with redshift from z 3 to 6.5 (e.g., Clement et al. 2011), the evolution trend of global f could be explained as the evolution of relative numbers of LAEs to LBGs at different redshift, with little implication on the Ly escape mechanism for LAEs only. X-ray constraints on the of LAEs are independent of dust-extinction law, and we have found the same lower limits of for LAEs at z 0.3 and 1, and LAEs at z = 2.1 and 3.2 with different average SFRLyα values. However, a larger sample of LAEs with deep X-ray observation is needed to give a constraint on the evolution of in LAE only.
4.5 Implications from simulated SFRX-LX relationship
We should note that the X-ray radiation from galaxies is predicted to be relatively low for the youngest stellar populations. Mas-Hesse et al. (2008) predict the soft X-ray to far infrared luminosities ratio in star-forming galaxies from synthesis models. They find that the ratio is dependent on the age of the star formation episode for ages Myr. After 30 Myr, the correlation becomes stable and is consistent with SFRX – Lsoft relation of Ranalli et al. 2003. In the hard X-ray band, Mas-Hesse & Cervino (1999) predicted that a few HMXB should be active in starbursts that are older than 5-6 Myr, contributing a few times 1038 erg s-1 to the total X-ray luminosity. Recent Chandra studies in the interacting galaxy pair NGC 4038/4039 (the Antennae; Rangelov et al. in prep) found that 22 of 82 X-ray binaries are coincident or nearly coincident with star clusters. The ages of these clusters were estimated by comparing their multi-band colors with predictions from stellar evolutionary models. They found 14 of the 22 coincident sources are hosted by star clusters with ages of 6 Myr or less. So the HMXBs in star-forming galaxies might form earlier than suggested in the Mas-Hesse & Cervino (1999) model. The estimates of LAE ages are based on SED fitting and are quite uncertain. Such results have been reported at z = 2.1 (Guaita et al. 2011), 2.25 (Nilsson et al. 2009), 3.1 (Gawiser et al. 2007), 4.5 (Finkelstein et al. 2008) and z=4.0-5.5 (Pirzkal et al. 2007). All the results show that the best fit age parameter is 2040 Myr, but extends to 0.1-1 Gyr at the 68% confidence level. Given this range of best fit ages, we expect that a minority of the LAEs in our sample will be younger than 15 Myr. This would imply a modest upward correction to the SFR inferred from X-rays, and a corresponding correction downwards in the ; both corrections might reasonably be factors of –.
5 Conclusions:
From the 4 Ms X-ray Chandra image of CDF-S, we find that the from X-rays for LAEs at z 0.3 are about 2-7 times larger than that from
dust corrected UV or H. We coadded Ly emitting galaxies between redshifts .
None of these galaxies were individually detected. The absence of signal in the coadded image implies an average flux of less than
7.610-19 ergs cm-2 s-1 (1-sigma). This implies that the SFRs in these galaxies are quite modest,
as indicated by the Ly line emission. And the ratio of the average Ly line intensity to the upper limits of X-ray flux constrain
the Ly escape fraction of 17% at 84% confidence level.
Acknowledgements: We would like to thank the anonymous referee whose comments improved this manuscript significantly. ZYZ would like to thank the support from the China Scholarship Council (CSC No. 2009634062) and Arizona State University. SM & JER are supported by the United States National Science Foundation grant AST-0808165. The work of JXW is supported by National Basic Research Program of China (973 program, Grant No. 2007CB815404), and Chinese National Science Foundation (Grant No. 10825312).
| Name | R.A. | Dec. | redshift | LLyα | aEW(Ly) | SFRLya | L0.5-2 | L2-10 (3) | bSFRX |
|---|---|---|---|---|---|---|---|---|---|
| (1) | (2) | (3) | (4) | (5) | (6) | (7) | (8) | (9) | (10) |
| GALEX0332-2744 | 53.08000 | -27.74589 | 0.217 | 41.38 | 17 | 0.22 | 39.6 | 40.4 | 1.0 |
| GALEX0333-2753 | 53.23600 | -27.88797 | 0.365 | 42.32 | 23 | 2.0 | 41.0 | 41.3 | 21.7 |
| GALEX0333-2744 | 53.28029 | -27.74242 | 0.220 | 41.55 | 12 | 0.3 | 40.7 | 41.1 | 10.9 |
| Redshift | Numbera,d | Time | X-ray COUNTSb | FX()c | lg10(LX())c | SFR | |||||||
| Ms | TotS | NetS | TotH | NetH | Tot05-7 | Net05-7 | Fsoft | Fhard | Ffull | L2-10keV | (M☉ yr-1) | ||
| CDF-S only, 50 % PSF extraction | |||||||||||||
| 0.3 | 3 | 9.8 | 7. | 1.3 | 13. | -0.8 | 20. | 0.5 | 0.69 | 2.28 | 1.33 | 39.8 | 1.3 |
| 2.1 | 12 | 39.1 | 20. | -4.3 | 71. | 11.5 | 91. | 7.1 | 0.19 | 2.54 | 0.98 | 40.8 | 14 |
| 3.1 | 18 | 59.2 | 50. | -4.9 | 120. | -8.2 | 170. | -13.0 | 0.18 | 0.96 | 0.51 | 41.2 | 32 |
| 3.2 | 23 | 73.9 | 54. | -9.4 | 145. | -3.5 | 199. | -12.9 | 0.15 | 0.84 | 0.44 | 41.1 | 28 |
| 4.5 | 12 | 39.3 | 30. | 2.5 | 59. | -6.8 | 89. | -4.3 | 0.31 | 1.05 | 0.58 | 41.8 | 139 |
| 5.7 | 3 | 9.8 | 12. | -0.6 | 34. | 5.9 | 46. | 5.4 | 0.62 | 6.19 | 2.90 | 42.3 | 439 |
| 6.5 | 1 | 3.3 | 3. | -3.6 | 16. | 0.6 | 19. | -2.9 | 1.17 | 8.16 | 3.53 | 42.7 | 1002 |
| CDF-S + ECDF-S, 50 % PSF extraction | |||||||||||||
| 0.3 | 12 | 11.6 | 19 | 6.4 | 31 | -0.1 | 50 | 6.3 | 1.3 | 2.7 | 2.7 | 39.9 | 1.6 |
| 1.0 | 2 | 0.4 | 1 | -1.2 | 9 | 3.4 | 10 | 2.2 | 7.3 | 83.9 | 32.9 | 41.6 | 84 |
| 2.1 | 122 | 72.2 | 49. | 1.9 | 125. | 11.7 | 169. | 9.1 | 0.18 | 1.54 | 0.68 | 40.8 | 14 |
| 3.1 | 118 | 85.8 | 71. | -6.2 | 169. | -3.4 | 234. | -12.4 | 0.14 | 0.76 | 0.40 | 41.1 | 28 |
| 3.2 | 24 | 74.9 | 55. | -9.1 | 159. | 5.9 | 216. | -2.7 | 0.15 | 1.24 | 0.45 | 41.1 | 28 |
| 4.5 | 64 | 49.8 | 44. | 6.8 | 93. | 6.8 | 136. | 13.7 | 0.38 | 1.65 | 1.13 | 41.9 | 160 |
| 5.7 | 17 | 12.6 | 14. | -0.0 | 37. | 5.6 | 51. | 5.6 | 0.50 | 4.73 | 2.33 | 42.3 | 440 |
| 6.5 | 6 | 4.5 | 4. | -3.0 | 19. | 2.8 | 23. | -0.2 | 0.93 | 8.55 | 2.79 | 42.6 | 876 |
| Redshift | Lg Lb | EW()rest,limitb | SFR | SFR | SFR | A | f | f |
| Å | (M☉ yr-1) | (mag) | (%) | (%) | ||||
| 0.217a | – | – | 1.0 | 0.22 | 2.9 | 1.250.35 | 3.3 | 22.0 |
| 0.220a | – | – | 10.9 | 0.3 | .. | .. | .. | 2.8 |
| 0.374a | – | – | 21.7 | 2 | 6.2 | 2.000.00 | 5.1 | 9.2 |
| 0.3 | 41.2 | 20 | 1.6 | 0.9 | .. | .. | .. | 56.3 |
| 1.0 | 42.6 | 20 | 84 | 5.7 | .. | .. | .. | 6.8 |
| 2.1 | 41.8 | 20 | 14 | 1.9 | 2.4 | 1.2 | 26 | 14 |
| 3.1 | 42.1 | 20 | 28 | 2.6 | 5.3 | 0.6 | 28 | 9.4 |
| 3.2 | 42.9 | 22 | 28 | 2.3 | 4.2 | 0.8 | 26 | 8.3 |
| 4.5 | 42.6 | 16 | 139 | 6.0 | 24 | 1.5 | 6 | 4.3 |
| 5.7 | 42.8 | 11 | 439 | 5.5 | … | … | … | 1.3 |
| 6.5 | … | … | 876 | 5 | … | … | … | 0.57 |
References
- (1) Ando, M. et al. 2006, ApJL, 645, 9
- (2) Atek, H., Kunth, D., et al. 2009, A&A, 506, L1
- (3) Blanc, G. A., Adams, J. et al. 2011, ApJ, 736, 31
- (4) Burgarella, D., et al. 2007, MNRAS, 380, 986
- (5) Calzetti, D., et al. ApJ, 533, 682
- (6) Colbert, E. J. M., Heckman, T. M., Ptak, A. F., et al. 2004, ApJ, 602, 231
- (7) Condon, J. J. 1992, ARA&A, 30, 575
- (8) Cowie, L. L., & Hu, E. M. 1998, AJ, 115, 1319
- (9) Cowie, L. L., Barger, A.J., & Hu, E. M. 2010, ApJ, 711, 928
- (10) Dawson, S., Rhoads, J. E., Malhotra, S., et al. 2007, ApJ, 671, 1227
- (11) Deharveng, J. M., Small, T., et al. 2008, ApJ, 680, 1072
- (12) Dickey, J. & Lockman, F., 1990, ARA&A, 28, 215
- (13) Finkelstein, S. L., Rhoads, J. E., Malhotra, S., Grogin, N., & Wang, J. X. 2008, ApJ, 678, 655
- (14) Finkelstein, S. L., Cohen, S. H., Malhotra, S., Rhoads, J. E., et al. 2009a, ApJ, 703, 162
- (15) Finkelstein, S. L., Cohen, S. H., Malhotra, S., & Rhoads, J. E. 2009b, ApJ, 700, 276
- (16) Finkelstein, S. L., Rhoads, J. E., Malhotra, S., & Grogin, N. 2009c, ApJ, 691, 465
- (17) Finkelstein, S. L., Cohen, S. H., Moustakas, J., et al., 2010, astro-ph/1012.4010
- (18) Finkelstein, S. L., Hill, G. J., et al. 2011, ApJ, 729, 140
- (19) Gawiser, E., Francke, H., Lai, K., et al., 2007, ApJ, 671, 278
- (20) Gehrels, N. 1986, ApJ, 303, 336
- (21) Gilfanov, m., Grimm, H. J., Sunyaev, R., 2004, NuPhS, 132, 369
- (22) Grimm, H.J., Gilfanov, M., & Sunyaev, R., 2003, MNRAS, 339, 793
- (23) Gronwall, C. et al. 2007, ApJ, 667, 79
- (24) Guaita, L., Gawiser, E., et al. 2010, ApJ, 714, 255
- (25) Guaita, L., Gawiser, E., et al. 2011, astro-ph/1101.3017
- (26) Hansen, M. & Oh, S. P. 2006, MNRAS, 367, 979
- (27) Hayes, M., Ostlin, G. , et al. 2010, Nature, 464, 562
- (28) Hayes, M., Schaerer, D., et al. 2011, ApJ, 730, 8
- (29) Hu, E. M., Cowie, L. L., et al. 2004, AJ, 127, 563
- (30) Iye, M., Ota, K, Kashikawa, N., et al. 2006, Nature, 443, 14
- (31) Kennicutt, R. C., Jr. 1998, ARA&A, 36, 189
- (32) Laird, E.S., Nandra, K., et al. 2005, MNRAS, 359, 47
- (33) Laird, E.S., Nandra, K., Hobbs, A., & Steidel, C.C. 2006, MNRAS, 373, 217
- (34) Lehmer, B.D., Brandt, W. N., et al. 2005, ApJS, 161, 21
- (35) Lehmer, B.D., Brandt, W. N., et al. 2008, ApJ, 681, 1163
- (36) Lehmer, B.D., Alexander, D.M., et al. 2010, ApJ, 724, 559
- (37) Luo, B., Bauer, F. E., Brandt,W. N., et al. 2008, ApJS, 179, 19
- (38) Malhotra, S. & Rhoads, J.E. 2002, ApJL, 565, 71
- (39) Malhotra, S., Wang, J, Rhoads, J. E., et al. 2003, ApJ, 585, L25
- (40) Martin, C. L., et al. 2008, ApJ, 679, 942
- (41) Mas-Hesse, J. M. & Cervino, M. 1999, IAUS, 193, 550
- (42) Mas-Hesse, J. M., Oti-Floranes, H., & Cervino, M. 2008, A&A, 483, 71
- (43) Nagamine,K., Ouchi, M., Springel, V., Hernquist, L. 2010, PASJ, 62, 1455
- (44) Nandra, K., Mushotzky, R. F., Arnaud, K., et al. 2002, ApJ, 576, 625
- (45) Nilsson, K. K., Moller, P., Moller, O., et al. 2007, A&A, 471, 71
- (46) Nilsson, K. K., Tapken, C., et al. 2009, A&A, 498, 13
- (47) Neufeld, D. A. 1991, ApJL, 370, 85
- (48) Partridge, R. B. & Peebles, P. J. E. 1967, ApJ, 148, 377
- (49) Persic, M., Rephaeli, Y. et al. 2004, A&A, 419, 849
- (50) Pirzkal, N., et al. 2004, ApJS, 154, 501
- (51) Pirzkal, N., Malhotra, S., Rhoads, J. E., Xu, C. 2007, ApJ, 667, 49
- (52) Ranalli, P., Comastri, A., & Setti, G. 2003, A&A, 399, 39
- (53) Rhoads, J. E., Malhotra, S., et al. 2000, ApJL, 545, 85
- (54) Rhoads, J. E., dey, A., Malhotra, S., et al. 2003, AJ, 125, 1006
- (55) Rhoads, J. E., 2009, ApJ, 697, 942
- (56) Scarlata, C. et al. 2009, ApJL, 704, 98
- (57) Tullmann, R., et al. 2006, A&A, 457, 779
- (58) Venemans, B. P., et al. 2005, A&A, 431, 793
- (59) Wang, J. X., Rhoads, J. E., Malhotra, S., et al. 2004, ApJL, 608, 21
- (60) Wang, J. X., Zheng, Z. Y., Malhotra, S., et al. 2007, ApJ, 669, 765
- (61) Wang, J. X., Malhotra, S., Rhoads, J. E., et al. 2009, ApJ, 706, 762
- (62) Zheng, Z. Y., Wang, J. X., Finkelstein, S. L., Malhotra, S., Rhoads, J. E., & Finkelstein, K. D. 2010, ApJ, 718, 52