The nature of X-ray absorbed QSOs
Abstract
There exists a significant population of broad line, QSOs which have heavily absorbed X-ray spectra. Follow up observations in the submillimetre show that these QSOs are embedded in ultraluminous starburst galaxies, unlike most unabsorbed QSOs at the same redshifts and luminosities. Here we present X-ray spectra from XMM-Newton for a sample of 5 such X-ray absorbed QSOs that have been detected at submillimetre wavelengths. We also present spectra in the restframe ultraviolet from ground based telescopes. All 5 QSOs are found to exhibit strong C IV absorption lines in their ultraviolet spectra with equivalent width Å. The X-ray spectra are inconsistent with the hypothesis that these objects show normal QSO continua absorbed by low-ionization gas. Instead, the spectra can be modelled successfully with ionized absorbers, or with cold absorbers if they posess unusually flat X-ray continuum shapes and unusual optical to X-ray spectral energy distributions. We show that the ionized absorber model provides the simplest, most self-consistent explanation for their observed properties. We estimate that the fraction of radiated power that is converted into kinetic luminosity of the outflowing winds is typically 4 per cent, in agreement with recent estimates for the kinetic feedback from QSOs required to produce the relation, and consistent with the hypothesis that the X-ray absorbed QSOs represent the transition phase between obscured accretion and the luminous QSO phase in the evolution of massive galaxies.
keywords:
X-rays: galaxies – galaxies: active – galaxies: evolution – galaxies: formation1 Introduction
The prevalence of black holes in present-day galaxy bulges, and the proportionality between black hole and spheroid mass (Magorrian et al., 1998; Merritt & Ferrarese, 2001) implies that the formation of the stars in a present-day galaxy spheroid was fundamentally connected to the growth of the black hole as an active galactic nucleus (AGN). In fact, an evolutionary connection between the star-forming and AGN-dominated phases of galaxies has long been posited (e.g. Sanders et al., 1988).
It is now known that a significant fraction of cosmic star formation took place in submillimetre galaxies (SMGs): dusty, ultraluminous, and highly obscured galaxies at high redshift (Smail, Ivison & Blain, 1997; Hughes et al., 1998). Although some distant QSOs have been detected as submillimetre sources in pointed observations (e.g. McMahon et al., 1999; Page et al., 2001), the overlap between the QSO and SMG populations is relatively small (Fabian et al., 2000; Severgnini et al., 2000; Almaini et al., 2003; Waskett et al., 2003; Lutz et al., 2010). In an attempt to uncover the relationship between quasi-stellar objects (QSOs) and SMGs, Page et al. (2004) observed matched samples of X-ray absorbed and unabsorbed QSOs at 850m with SCUBA. These observations revealed a remarkable dichotomy in the submillimetre properties of these two groups of sources: a substantial fraction ( 50 per cent) of X-ray absorbed QSOs are submillimetre galaxies, while X-ray unabsorbed (i.e. normal) QSOs are not. This suggests that the two types are linked by an evolutionary sequence, in which the X-ray absorbed QSOs correspond to the transition between the main star-forming phase and the QSO phase of a massive galaxy (Page et al., 2004; Stevens et al., 2005; Coppin et al., 2008). The space density and luminosities of the X-ray absorbed QSOs indicate that this transitional phase is relatively brief, 15 per cent of the duration of the luminous QSO phase.
However, the physical driver for this transition between obscured star-forming galaxy and luminous QSO is unknown. Furthermore, the nature of the X-ray absorption in the X-ray absorbed QSOs remains puzzling. These objects are characterised by hard, absorbed X-ray spectra, but they have optical/UV spectra which are typical for QSOs, with broad emission lines and blue continua. Assuming that their hard X-ray spectral shapes result from photoelectric absorption from cold material with solar abundances, the column densities are of order cm-2. The X-ray absorption could be due to gas located within the AGN structure, or from more distant material in the host galaxy. Wherever the absorber is located, it appears to contain very little dust: for a Galactic gas/dust ratio, the restframe ultraviolet spectra would be heavily attenuated by such large columns of material.
Therefore in order to investigate the X-ray absorption in these objects, we have obtained deep (50–100ks) XMM-Newton observations of five X-ray absorbed QSOs from our sample of hard-spectrum Rosat sources (Page, Mittaz & Carrera, 2001) that were detected as powerful submillimetre sources with SCUBA (Page et al., 2001; Stevens et al., 2005).
Throughout this paper we assume km s-1 Mpc-1, , and . We define a power law spectrum such that ; we assign the energy index the subscript when it refers to the X-ray spectral slope, when it refers to the optical/ultraviolet spectral slope and when it refers to the optical to X-ray spectral slope.
2 Observations and data reduction
2.1 Optical spectra

RXJ005734 was observed on the 22nd November 1998, with the ESO 3.6m telescope at La Silla, Chile. The EFOSC 2 spectrograph was used with the 5000Å blaze, 300 lines mm-1 grism covering the wavelength range 3800Å to 8000Å, with a spectral resolution of 20Å FWHM.
RXJ094144, RXJ121803 and RXJ163308 were observed on the 3rd-5th March 1998 with the William Herschel Telescope at the Observatorio del Roque de los Muchachos, La Palma. The dual arm ISIS spectrograph was used with the 5400 Å dichroic, the R158R grating on the red arm and the R300B grating on the blue arm. The two ISIS arms combined give continuous coverage of the wavelength range 3200Å to 8100 Å with resolution of 5Å FWHM in the blue and 9Å FWHM in the red.
In both observing runs, arc-lamp spectra and observations of spectrophotometric standard stars were taken for wavelength and flux calibration. The spectra were reduced and calibrated using standard routines in IRAF.
RXJ124913 was not observed because it is a well known broad absorption line QSO (BALQSO) with optical spectra available in the literature; the spectrum shown in Fig. 1 is taken from Junkkarinen, Burbidge & Smith (1987).
| Target | Obs ID | date | Filters | Exposure time (ks) | UVW1 | ||||
|---|---|---|---|---|---|---|---|---|---|
| pn | MOS1 | MOS2 | pn | MOS1 | MOS2 | mag | |||
| RX J005734.78272827.4 | 0302310301 | 18 Dec 2005 | thin | thin | thin | 40.2 | 47.7 | 47.3 | - |
| RX J094144.51385434.8 | 0203270101 | 17 May 2004 | medium | medium | medium | 32.6 | 40.5 | 40.8 | |
| RX J121803.82470854.6 | 0203270201 | 1 June 2004 | thin | thin | thin | 30.0 | 36.9 | 37.2 | |
| RX J124913.86055906.2 | 0060370201 | 11 July 2001 | thin | thin | thin | 25.0 | 39.6 | 39.6 | - |
| 0203270301 | 15 July 2004 | medium | medium | medium | 34.3 | 42.5 | 42.9 | - | |
| RX J163308.57570258.7 | 0302310101 | 7 Sept 2005 | thin | thin | thin | 5.5 | 9.2 | 8.8 | - |
| 0302310501 | 23 Oct 2005 | thin | thin | thin | 10.5 | 19.7 | 20.0 | - | |
2.2 X-ray spectra and ultraviolet images
The XMM-Newton observations used in this analysis are listed in Table 1. The data were reduced with XMM-Newton SAS version 6.5, and the calibration release of June 2006. After initial processing of the EPIC MOS and pn data, spectra were extracted from a circular region of 15 arcsecond radius, centred on the target. Background was obtained from a circular region of radius 150 arcseconds, within which all significant sources were masked out. Appropriate response matrices and effective area files were generated with the SAS tasks rmfgen and arfgen. For each object, spectra and response matrices were combined using the method described in Page, Davis & Salvi (2003). To determine how the fluxes of the sources compared to those obtained in our original Rosat survey, we fitted the spectra below 2 keV with a powerlaw and fixed Galactic absorption. For RXJ005734, RXJ121803 and RXJ163308 we obtain keV fluxes of , and erg cm-2 s-1 respectively, consistent with those obtained with Rosat (Page, Mittaz & Carrera, 2000). For RXJ094144 we obtain a keV flux of erg cm-2 s-1, approximately a quarter of its flux during our Rosat survey, while for RXJ124913 we obtain a keV flux of erg cm-2 s-1, approximately half the Rosat flux reported by Page, Mittaz & Carrera (2000).
Simultaneous with the X-ray observations, the XMM-Newton Optical Monitor (XMM-OM) took deep images in the UVW1 filter111UVW1 images were not obtained during the July 2001 observation of RXJ124913, in which the UV grism of XMM-OM was used instead., which has an effective wavelength of 2910Å. These observations were obtained primarily to provide photometric redshift constraints for objects surrounding the QSOs, and for the three highest redshift objects the flux in this band is severely affected by the Lyman break. For RXJ094144 and RXJ121803 however, the Lyman break cuts in only at the extreme blue of the UVW1 transmission, and will have a minor impact on the photometry. The data were reduced using the XMM-OM SAS version 6.5. The UVW1 magnitudes of RXJ094144 and RXJ121803 (in the XM-OM Vega system) are given in Table 1.
3 Results
3.1 Absorption in the rest-frame ultraviolet
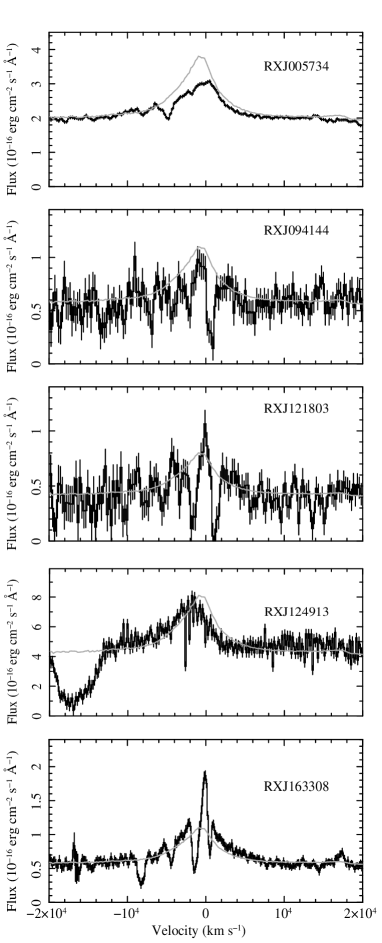
Broadband optical spectra of the five X-ray absorbed QSOs are shown in Fig. 1. It is notable that in all five objects, at least one absorption line is superimposed on the broad C IV emission line or on the continuum to the blue of this line. To examine this more closely, we show the regions around the C IV emission line in more detail in Fig. 2. In RXJ005734, there are two absorption lines apparent, with outflow velocities of 4800 and 8100 km s-1, assuming that they are C IV. In the spectrum of RXJ094144, at least one absorption line is present, apparently inflowing with a velocity of 700 km s-1 assuming that it is C IV. As this spectrum is relatively noisy, we are unable to confirm whether the tentative absorption features to the blue of C IV are real or statistical fluctuations. There are two significant absorption features in RXJ121803, one inflowing at 1200 km s-1, and one outflowing at 1600 km s-1. Mg II absorption is detected from the inflowing component. For RXJ124913 we adopt an emission line redshift of (Hewitt & Burbidge, 1993), although the reported emission line redshift of this source ranges from (Boksenberg et al., 1978) to (Hill, Thompson & Elston, 1993) depending on which emission lines the redshift is based on. Relative to this emission line redshift, the C IV broad absorption line has a central velocity of -16700 km s-1, with a FWHM of 5700 km s-1 (Boksenberg et al., 1978). In RXJ163308 there are four absorption lines visible, but two of these are likely to be due to an intervening absorption line system with , for which a number of other transitions are detected in the optical spectrum. The remaining two lines have outflow velocities of 800 and 7700 km s-1. Both are accompanied by Ly absorption with consistent velocities, and absorption from Si IV is detected in the 7700 km s-1 component. The C IV absorption line properties of the five QSOs are listed in Table 2.
The five QSOs have strong rest-frame ultraviolet continuum emission. Ultraviolet spectral slopes were measured from the optical spectra, longward of Ly, after masking emission and absorption lines. The ultraviolet spectral slopes are listed in Table 2. With the exception of RXJ094144, the ultraviolet continua of the five QSOs have spectral slopes in the range , which is typical for optically-selected QSOs (Francis et al., 1991), indicating little or no dust reddening intrinsic to these objects. On the other hand, as can be seen in Fig. 1 the rest-frame ultraviolet continuum of RXJ094144 is much redder than those of the other objects. The continuum slope in this object is , outlying from the distribution of optically-selected QSOs at the 3 level (Francis et al., 1991), and suggesting that this object may be somewhat dust reddened. The ultraviolet spectral shape can be matched by reddening the median Sloan Digital Sky Survey QSO spectrum (Vanden Berk et al., 2001) by E(BV)=0.20 using the SMC reddening law (Pei, 1992), a similar level of extinction as observed in the nearby starburst/BALQSO IRAS (Lipari, 1994), and suggesting 1.4 magnitudes of extinction at 2500Å in the restframe. The UVW1B colour of RXJ094144 (where the B magnitude comes from Page, Mittaz & Carrera 2001) is in reasonable agreement with this reddened template: after correction for Galactic extinction the UVW1-B colour of RXJ094144 is compared to UVW1B=0.71 predicted by the reddened template. In contrast, RXJ121803 has a much bluer UVW1B= after correction for Galactic extinction. For comparison, the median SDSS QSO template would have UVW1B= at the redshift of RXJ121803.
| QSO | Velocity | C IV FWHM | C IV EW | |
|---|---|---|---|---|
| (km s-1) | (km s-1) | (Å) | ||
| RXJ005734 | -4800 | 500 | 5 | 0.6 |
| RXJ005734 | -8100 | 500 | 2 | 0.6 |
| RXJ094144 | 700 | 800 | 12 | 2.7 |
| RXJ121803 | 1200 | 900 | 15 | 1.0 |
| RXJ121803 | -1600 | 900 | 14 | 1.0 |
| RXJ124913 | -16700 | 5700 | 70 | 1.0 |
| RXJ163308 | -800 | 700 | 11 | 0.1 |
| RXJ163308 | -7700 | 700 | 10 | 0.1 |
.
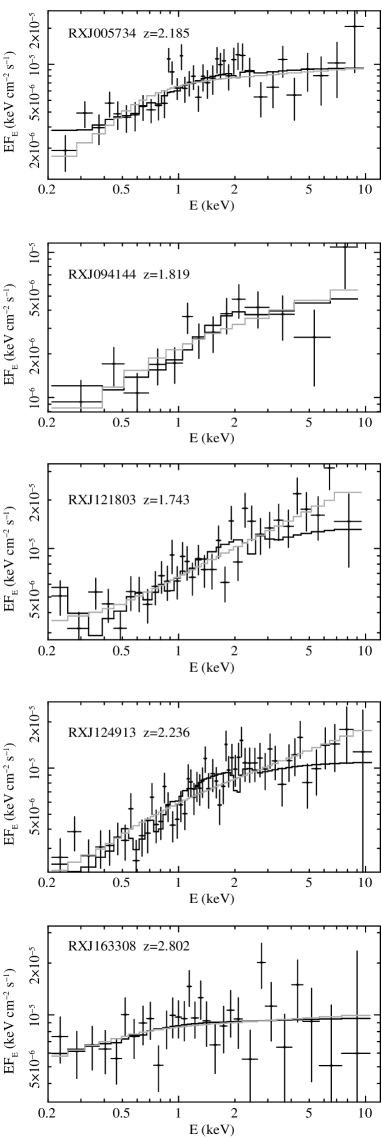
3.2 Modelling the X-ray spectra
Analysis of the X-ray spectra was performed using SPEX version 2.00.11222http://www.sron.nl/divisions/hea/spex/index.html. As a starting point, the XMM-Newton spectra were fitted with a similar model to that considered by Page, Mittaz & Carrera (2001): a power law with a fixed of 0.98, fixed Galactic absorption, and cold photoelectric absorption at the QSO redshift with as a free parameter. The value of was chosen because it is the mean spectral index of QSOs in the XMM-Newton energy range and at similar X-ray flux levels to our targets, as determined by Mateos et al. (2005) and confirmed in more recent work (Mateos et al., 2010). The results are given in Table 3. Although some of the individual objects are successfully fit by this model, others are not (RXJ121803 and RXJ124913), and the total for the sample of 5 objects is not acceptable. Therefore, we attempted to fit the spectra with two models, one in which the continuum spectral slope was allowed to vary, and one in which the ionization parameter of the absorber was allowed to vary.
| RXJ005734 | RXJ094144 | RXJ121803 | RXJ124913 | RXJ163308 | Total | |
|---|---|---|---|---|---|---|
| PLCA | ||||||
| 0.98f | 0.98f | 0.98f | 0.98f | 0.98f | ||
| 22.0 | 22.1 | 21.8 | 22.2 | 21.5 | ||
| 1.70 | 1.48 | 1.32 | 1.89 | 1.44 | ||
| 41/36 | 15/12 | 64/32 | 82/53 | 22/28 | 225/161 | |
| PLCA | ||||||
| 0.82 | 0.57 | 0.41 | 0.53 | 0.94 | ||
| 21.8 | 21.5 | 0.00 | 21.5 | 21.4 | ||
| 1.71 | 1.54 | 1.39 | 1.96 | 1.43 | ||
| 39/35 | 11/11 | 29/31 | 50/52 | 22/27 | 151/156 | |
| PLWA | ||||||
| 0.98f | 0.98f | 0.98f | 0.98f | 0.98f | ||
| 2.4 | 2.7 | 2.9 | 2.9 | 2.3 | ||
| 22.7 | 23.2 | 23.1 | 23.1 | 22.2 | ||
| 1.68 | 1.43 | 1.26 | 1.85 | 1.43 | ||
| 34/35 | 9/11 | 43/31 | 51/52 | 21/27 | 158/156 |
As seen in Table 3, allowing the continuum spectral indices or the ionization parameters of the absorbers to vary produced acceptable values of for the 5 objects individually, and as a sample. Since the two models are equivalent in terms of , we can only discriminate between the two models by looking to see which provides the more physically plausible and self-consistent explanation for the spectra. In particular, we can test the hypothesis that the underlying spectra of these objects are reasonably typical for QSOs, and their unusual observed spectral shapes are due to absorption. Two properties in particular are important in this context: the spectral index of the underlying X-ray spectrum, and the ratio of optical to X-ray flux, which we parameterise as the equivalent , which is the energy index of the power law that would connect the restframe 2500 Å and 2 keV flux densities.
Beginning with the X-ray spectral slope, the most appropriate comparison sample of normal QSOs is the sample examined by Mateos et al. (2005), which is an X-ray selected sample with a similar flux limit to the ROSAT hard spectrum sample from which our targets were drawn, and measured in the same energy range, and with the same instrumentation (XMM-Newton EPIC) as our targets. Mateos et al. (2005) found that the distribution of QSO spectral slopes can be described as a Gaussian with a mean of and a standard deviation . From Table 3 we see that when the spectral slopes are allowed to vary, the best fit values of for RXJ005734 and RXJ163308 are relatively close to the mean of the distribution. However, the best fit values of for RXJ094144, RXJ121803, and RXJ124913 are all unusually low, lying within the lowest 3 percent of the distribution. This is an unlikely circumstance if the intrinsic photon indices of our sample were drawn from the same distribution as QSOs in general, and suggests that the cold photoelectric absorption does not fully account for the unusual X-ray spectral shapes observed in these objects. In comparison, the spectral slopes are fixed in the ionized absorber model, and so are by design consistent with a typical underlying QSO spectrum.
Moving to , we have calculated this quantity for each of the model fits and each of the QSOs. In each case the restframe 2500 Å flux has been estimated from the B magnitude listed in Page, Mittaz & Carrera (2001), assuming an optical slope of . The 2 keV flux is determined from the continuum model of the X-ray spectral fit, i.e. it is the intrinsic continuum flux, corrected for the modelled X-ray absorption.
The distribution of in normal QSOs is known to depend on luminosity (Vignali, Brandt & Schneider, 2003; Strateva et al., 2005) and there is inevitably a selection bias depending on whether the sample is X-ray or optically selected. The most appropriate reference distribution of in the literature is that presented in Strateva et al. (2005) for a sample of 155 Sloan Digital Sky Survey QSOs with medium-deep ROSAT coverage. However, since this distribution is based on an optically-selected sample, while our sample is X-ray selected, we have constructed a reference distribution of for X-ray selected QSOs drawn from the ROSAT International X-ray Optical Survey (RIXOS; Mason et al., 2000). We restrict the reference sample to those RIXOS QSOs at , which corresponds to a similar luminosity range to our X-ray-absorbed QSO sample, because RIXOS has a similar X-ray flux limit to the ROSAT hard spectrum survey from which our targets were drawn. We calculated for the reference sample in an identical fashion to our absorbed QSO sample except that we assume no intrinsic X-ray absorption and for the RIXOS AGN. The reference sample has a mean and a standard deviation ; the distribution of for the reference sample is shown in Fig. 5. For comparison, the SDSS sample presented in Strateva et al. (2005) has a very similar distribution of , with and .
In Table 3 we see that with the exception of RXJ124913, the absorbed QSOs have values within two standard deviations of for the reference distribution. For RXJ124913, the level of discrepancy depends strongly on the X-ray spectral model. The ionized absorber fit gives the most consistent value, at 2.3 standard deviations from the mean of the reference sample, while the fit with a cold absorber and fitted gives the most discrepant value of , standard deviations from the mean of the reference sample. Indeed, this value of is larger than any in the RIXOS reference sample or the SDSS sample of Strateva et al. (2005), suggesting that the model with a cold absorber and the continuum slope fitted as a free parameter would also require a highly unusual spectral energy distribution for RXJ124913. While RXJ094144 has rather typical values of in Table 3, we note that if we correct for the intrinsic extinction equivalent to E(BV)=0.2, suggested by the UV continuum shape (Section 3.1), the would increase by 0.40, leading to an abnormal for the cold absorber, fitted model for this source as well as for RXJ124913.
Overall, the ionized absorber model is consistent with the five QSOs having unremarkable underlying X-ray continua and optical to X-ray spectral energy distributions. In contrast, if the X-ray absorbers are modeled as cold gas, the QSOs require a combination of cold absorption, unusual X-ray continua, and unusual optical to X-ray spectral energy distributions. We therefore consider that the ionized absorber model provides a simpler, less contrived solution than the model in which the X-ray absorber is cold. We also note that the presence of C IV absorption lines with EW Å in the restframe UV spectra of all five QSOs (and Si IV in RXJ124913 and RXJ163308) provides independent confirmation that these objects are viewed through columns of ionized gas. Therefore in what follows we adopt the ionized absorber fits as the best description of the X-ray spectra.

4 Discussion
4.1 Characteristics of the absorbers
Our study has revealed absorption from ionized gas in both the rest-frame UV spectra and in the X-ray spectra of our sample of X-ray absorbed QSOs. In the nearby Universe, ionized absorbers are common in Seyfert galaxies (e.g. Reynolds, 1997; George et al., 1998), and have been studied in some detail (Blustin et al., 2007; Steenbrugge et al., 2005). Therefore in trying to understand the properties of our sample of X-ray absorbed QSOs, it is instructive to compare them with those found in Seyferts. Amongst Seyfert galaxies, ionized absorption is observed primarily in broad-line, (type 1) objects (e.g. Reynolds, 1997; George et al., 1998; Blustin et al., 2005); indicating that the ionized absorbers lie within the ionization cones of the AGN, assuming the standard AGN geometric unification scheme in which the central regions are surrounded by a dusty, obscuring torus (Antonucci, 1993). The presence of ionized absorption within our X-ray absorbed QSOs is therefore in keeping with a normal pole-on orientation for these objects.
The ionized column densities, and the degree of soft X-ray attenuation, of our X-ray absorbed QSOs are considerably higher than are found in the majority of nearby Seyferts: with the exception of RXJ163308 for which the X-ray absorber properties are poorly constrained, all of our sample have best fit log , whereas only 3 of the 23 AGN in the sample studied by Blustin et al. (2005), have log . Nonetheless, a few nearby objects such as NGC3783 do have comparable column densities and ionization states (Blustin et al., 2002; Netzer et al., 2003; Reeves et al., 2004; Krongold et al., 2003). The ionized absorbers in Seyferts typically contain ions covering a large range of ionization, and where good data are available they almost always require multiple phases with different ionization parameters to model their spectra (Blustin et al., 2005; McKernan, Yaqoob & Reynolds, 2007). Moving to higher luminosity objects, ionized absorbers appear to be common in QSOs, with the studies of Porquet et al (2004) and Piconcelli et al (2005) suggesting that around 50 per cent of low redshift QSOs show some evidence for ionized absorption in their X-ray spectra. However, column densities of ionized material similar to those found in our sample of X-ray absorbed QSOs are relatively rare, with Piconcelli et al (2005) finding that only 2 of their sample of 40 nearby QSOs have ionized absorbers with best fit log . In the small number of nearby QSOs which have well-characterised ionized absorbers with cm-2, notably PG 1114+445 (Ashton et al., 2004), PDS 456 (Reeves, O’Brien & Ward, 2003), H (Ashton et al., 2006), and PG 1211+143 (Pounds et al., 2003), the absorbers are found to have multiple ionization phases, in common with the well-studied Seyfert warm absorbers.
On this basis, we can expect that the parameters determined for the single phase absorbers in our sources are therefore likely to be representative only of the dominant phase of absorption, and the high- absorption which we have detected is likely to be accompanied by significant soft X-ray absorption due to material with log . In fact the multi-ionization-phase nature of the ionized absorbers is implied by the absorption lines detected in their UV spectra. The best fit ionized X-ray absorber models for all 5 objects produce insignificant C IV absorption lines (EW Å), in contrast to the large EW lines ( Å) that are measured in their rest-frame UV spectra, implying that at least two ionization phases of absorber are required to produce both UV and X-ray absorption. Note that while absorption from C IV is seen in about half of QSOs (Vestergaard, 2003), C IV absorption lines with equivalent widths Å are relatively rare. Only 3 out of 114 non-BAL QSOs studied by Vestergaard (2003) show C IV absorption with such large EW. Combined with the statistic that 15 percent of QSOs have C IV BALs, which by definition have C IV EW Å (Gibson et al., 2009; Tolea, Krolik & Tsvetanov, 2002) we can conservatively estimate the incidence of C IV absorption lines with EW Å to be 20 per cent. The probability of all 5 of our X-ray absorbed QSOs having such absorption lines if they were drawn randomly from the population is therefore , and hence the connection of the C IV absorbers with the X-ray absorption is quite secure.

Our finding that the X-ray absorbers in our sample are highly ionized allows us to address the puzzling absence of strong UV attenuation by dust, despite the large column densities of X-ray absorbing gas. Nearby Seyfert 1 galaxies with warm absorbers also show this property: the column densities of X-ray absorbing gas can be large but they have bright ultraviolet continua with broad emission lines, e.g. NGC 3783 has (Netzer et al., 2003; Reeves et al., 2004) as well as a strong UV continuum and broad UV emission lines with little reddening (Crenshaw & Kraemer, 2001; Evans & Koratkar, 2004).
As a corollary to the apparent similarity between the ionized absorbers found in our X-ray absorbed QSOs and some nearby Seyferts, we might wonder whether star formation is associated with such X-ray absorption in objects such as NGC 3783, as it is in X-ray absorbed QSOs. A systematic investigation of this issue is beyond the scope of this paper, but it is interesting to note that NGC 3783 has a 2-10 keV X-ray luminosity of ergs s-1 and an infrared luminosity of L⊙ (Mullaney et al., 2011), so that if we scaled its SED to match the X-ray luminosities of our X-ray absorbed QSOs its infrared luminosity would be in the regime of ultraluminous infrared galaxies, commensurate with a substantial star formation rate.
4.2 Comparison to soft X-ray weak QSOs
It is interesting to compare the X-ray absorbed QSOs with another population of unusual QSOs: those that are classified as soft X-ray weak. These objects are characterised by large values of , and represent around 10% of optically selected QSOs (Laor et al., 1997). Brandt et al. (2000) found a strong correlation between and the equivalent width of C IV absorption, which is found to be Å in the majority of soft X-ray weak QSOs. This was interpreted by Brandt et al. (2000) as evidence that soft X-ray weak QSOs are such because they are absorbed in the soft X-ray band. As shown in Section 3.1, the QSOs in our sample all have C IV absorption lines with EWÅ, similar to the C IV lines found in soft X-ray weak QSOs. More recently, XMM-Newton observations of soft X-ray weak QSOs have indicated that this absorption is primarily due to ionized gas (Schartel et al., 2005; Brinkmann, Papadakis & Ferrero, 2004; Piconcelli, Jiménez-Bailón & Guainazzi, 2004), with ionization parameters ranging from log to log and column densities ranging from cm-2 to cm-2. These column densities and ionization parameters are remarkably similar to those of our X-ray absorbed QSOs. Given these similarities, we might expect that intense star formation would be as common in soft X-ray weak QSOs as it is in X-ray absorbed QSOs. To our knowledge there has been no systematic study of the star formation rates in soft X-ray weak QSOs, but there are certainly well known examples of soft X-ray weak QSOs which are rapidly forming stars, notably Mrk 231 and IRAS (Lipari, 1994).
4.3 Location of the absorbers
We now consider the location, physical nature, and implications of the ionized absorbers found in our sample. To estimate the location we assume that the absorber is in the form of an outflowing wind originating at a distance from the continuum source with density . From the definition of the ionization parameter
| (1) |
where is the 1-1000 Rydberg ionizing luminosity in erg s-1, such a wind will have an ionization parameter that is constant with radius . To take account that the winds from AGN are likely to be clumpy or filamentary, we characterise the outflow with a macroscopic volume filling factor . The column density of the absorber is dominated by material close to the base of the outflow, and hence can be taken as the characteristic distance of the absorber from the continuum source. Integrating the density along the line of sight, we obtain where is the density at the base of the outflow. Substituting for in Equation 1, we obtain the relation
| (2) |
To estimate we assume that below 0.35 keV the SED has the functional form given by Mathews & Ferland (1987) for a QSO ionizing spectrum, in which the X-ray power law steepens to in the range 56–350 eV, has a slope of in the 24–56 eV range, below which it has a slope of . This SED of Mathews & Ferland (1987) was constructed to be appropriate for objects of QSO luminosity, and when joined to our =0.98 spectrum at 0.35 keV it has .
For the fixed =0.98 which we have taken in our ionized absorber model fits, is a factor of 44.3 times larger than the restframe 2-10 keV luminosity. For the filling factor we assume a value of , which is the average for ionized absorbers with in Seyfert galaxies found by Ashton et al. (2006). The derived values of and are given in Table 4. With the exception of RXJ163308, for which is very poorly constrained, the best fit values of range from 1 to 15 parsecs. The uncertainties given for are derived from the statistical uncertainties on the product , and so do not include the uncertainty on the volume filling factor. As an estimate of this additional uncertainty, we note that Ashton et al. (2006) obtained a standard deviation in of 0.8 for Seyfert warm absorbers with . For comparison, we also provide in Table 4 the locations of the inner edge of the dusty torus for our sources, calculated using equation 5 from Barvainis (1987), with a dust sublimation temperature of 1260 K (as implied by the composite near-IR QSO spectrum obtained by Glikman, Helfand & White, 2006) and taking the ultraviolet luminosity to be equal to . We see that is in all cases smaller than, or consistent with, .
It would therefore be natural to assume that the absorbers originate in the AGN themselves, rather than in their host galaxies. This solution is attractive, because it is compatible with the lack of optical extinction in these objects: if the absorber is driven as a wind, either from the accretion disc or from evaporation of the inner edge of the molecular torus, then dust will be sublimated before (or as) it enters the flow. With this in mind, it is instructive to obtain upper limits for the distance of the absorbing gas from the nucleus at which it could remain ionized by the AGN radiation field, using Equation 2 and taking the limit case of filling factor . Doing so, we find that the X-ray absorbers in RXJ094144, RXJ121803 and RXJ124913 must lie within a few hundred parsecs of the ionizing source, within or close to the AGN rather than being distributed throughout the host galaxy.
| Object | ṀṀ | |||
|---|---|---|---|---|
| RXJ005734 | 46.7 | 19.4 | ||
| RXJ094144 | 46.2 | 19.2 | — | |
| RXJ121803 | 46.6 | 19.4 | ||
| RXJ124913 | 46.8 | 19.5 | ||
| RXJ163308 | 47.0 | 19.5 |
A key indicator of the importance of an ionized AGN wind is the ratio of the mass outflow rate Ṁout to the accretion rate Ṁacc. To determine this ratio, we first take to be (Vasudevan & Fabian, 2009) where is the bolometric accretion luminosity, so that
| (3) |
where is the speed of light, and is the accretion efficiency. We can obtain the mass outflow rate of the wind using equation 18 from Blustin et al. (2005):
| (4) |
where is the rest mass of a proton and is the outflow velocity, and is the solid angle of the outflow. Combining equations 3 and 4 we obtain:
| (5) |
We take and as before we assume . We take the opening angle of the outflow steradians, corresponding to the opening angle of the torus inferred from the type 1 / type 2 number ratio in nearby Seyferts (Maiolino & Rieke, 1995). For the velocity we assume that the X-ray absorbing ionized outflow is associated with the fastest outflow identified in the restframe ultraviolet (Table 2). This is a reasonable estimate, since the highest ionization absorbers are typically (though not always) the highest velocity systems in individual Seyfert galaxies (e.g. Sako et al., 2003; Steenbrugge et al., 2005; Costantini et al., 2007). At the same time it is a conservative estimate (i.e. may underestimate the mass outflow rate) for two reasons: firstly, the signal to noise ratios of our optical spectra (particularly for RXJ094144 and RXJ121803) are not high enough that we can be confident we have identified all of the absorption line systems, and secondly our estimates of the systemic velocities are based on the UV broad emission lines, which themselves are frequently observed to have a net outflow velocity of order 1000 km s-1 (Espey et al., 1989). The derived values of log ṀṀacc are listed in Table 4. In the case of RXJ094144, the C IV absorption line that is identified in the rest-frame UV spectrum is redshifted with respect to the UV emission lines, so its true velocity with respect to the system is too uncertain for us to attempt to estimate the mass outflow rate. The mass outflow rates derived for RXJ005734, RXJ124913 and RXJ163308 are about 10 times their mass accretion rates, while in RXJ121803 the accretion and outflow rates are comparable.
4.4 Implications for QSO evolution
At this point it is worth considering how these results bear on the broader picture of how X-ray absorbed QSOs relate to the evolution of massive black holes and their host galaxies. In Page et al. (2004) we argued that the submillimetre properties of X-ray absorbed QSOs imply an evolutionary sequence in which submillimetre galaxies evolve into QSOs, with the X-ray absorbed QSOs representing a brief, transitional phase between these two stages. The discovery that submillimetre galaxies typically contain more heavily absorbed, lower luminosity AGN than X-ray absorbed QSOs, supports this evolutionary picture (Alexander et al., 2005). In Stevens et al. (2005) we further proposed that the X-ray absorbed QSOs are in the process of driving the interstellar media out of their host galaxies via radiatively driven winds, in accord with the models developed by Silk & Rees (1998), Fabian (1999), Granato et al. (2004) and Di Matteo, Springel & Hernquist (2005). Now, with our XMM-Newton observations we have shown that the X-ray absorption in these objects is indeed due to substantial, ionized, QSO-driven winds. The space density of X-ray absorbed QSOs is per cent that of unabsorbed QSOs (Page et al., 2004; Silverman et al., 2005; Page et al., 2006), implying that if all QSOs go through an X-ray absorbed phase in their evolution, this phase lasts only per cent as long as the unabsorbed phase. These relative lifetimes may be a natural consequence of the high mass outflow rates in the X-ray absorbed QSOs: for the majority of our X-ray absorbed QSOs we estimate a mass outflow rate which is times higher than the accretion rate, implying that the fuel supply will be depleted 10 times faster in an X-ray absorbed QSO than in an unabsorbed QSO for the same accretion rate and fuel reservoir. However, this argument is more complicated if the two types of QSO fit within the evolutionary sequence discussed above, because in this case the fuel supply for an unabsorbed QSO will consist only of the fuel that remains after the X-ray absorbed phase. Nonetheless, if material is ejected at 10 times the accretion rate for 15 per cent of the (X-ray absorbed + unabsorbed) QSO lifetime, the total mass of material ejected by the QSO will be of the same order as that accreted.
The origin of the ionized, absorbing gas is then a fundamental issue for the physics of X-ray absorbed QSOs and their evolution. Assuming that X-ray absorbed QSOs have the usual AGN structure envisaged in geometric unification schemes, the two obvious sources of material are the accretion disc and the dusty torus. If the wind is driven from the accretion disc, the ejected material must pass through the accretion disc during the X-ray absorbed phase; in this case it is difficult to understand why this happens on a timescale which is short compared to the lifetime of the QSO. On the other hand, if the ionized wind is driven from the torus then the timescale for the X-ray absorbed phase corresponds to the time required to erode the inner part of the torus and so enlarge substantially its opening angle; as shown by Krolik & Kriss (2001) this timescale can be much shorter than the lifetime of the QSO. For accretion at the Eddington rate, the escape velocities at the distances of the inner edge of the torus (as given in Table 4) are between 900 and 1500 km s-1, and scale inversely with the square root of the accretion rate in Eddington units. Hence, of our X-ray absorbed QSOs, only the BALQSO RXJ124913 has outflow velocities which are too high to plausibly be associated with an outflow from the inner edge of the torus, implying an accretion disc origin for its outflow.
Viable AGN feedback models which reproduce the relation generally incorporate the feedback in the form of kinetic energy given to gas within the immediate (100 pc) environment of the AGN (e.g. Fabian, 1999; Granato et al., 2004; Di Matteo, Springel & Hernquist, 2005; Hopkins et al., 2006; Sijacki et al., 2007), which then interacts with gas on a larger scale to terminate star formation in the host spheroid. It is generally agreed that of order 5 per cent of the AGN radiative output must be fed back as kinetic energy in order for the models to succeed (Silk & Rees, 1998; Wyithe & Loeb, 2003; Di Matteo, Springel & Hernquist, 2005). We can make a simple estimate for the kinetic energy of the outflows compared to the radiative output of the X-ray absorbed QSOs as follows. We take the total energy radiated during the X-ray absorbed phase to be where is the radiative efficiency, is the speed of light and is the mass accreted during the X-ray absorbed phase. The kinetic energy built up by the outflow is where is the mass supplied to the outflow during the X-ray absorbed phase and is the velocity of the outflow. The fraction of the radiated output of the QSO which is fed back to the surrounding gas as kinetic energy of the outflow is then
| (6) |
If we take ṀṀ for the X-ray absorbed phase (as we find for the majority of our X-ray absorbed QSOs), and a typical outflow velocity of 8000 km s-1 (see Table 2), we obtain per cent. The value of so derived is independent of the radiative efficiency , because the in Equation 6 cancels with that in Equation 5 from which ṀṀacc is obtained. On the other hand, the uncertainty on ṀṀacc is in truth very large ( a factor of 10), depending on the unknown filling factor , and the square of the outflow velocity , which may not be the same for the X-ray absorbing phase as the UV absorber. Nonetheless, per cent is quite consistent with the level of feedback required to terminate star formation and produce the relation, implying that the ionized outflows in X-ray absorbed QSOs could plausibly be the mechanism through which star formation is terminated in massive galaxies.
5 Conclusions
We have presented X-ray spectra from XMM-Newton EPIC and rest-frame ultraviolet spectra from ground-based telescopes for five X-ray absorbed, submillimetre-luminous QSOs. All five QSOs exhibit strong C IV absorption lines in their ultraviolet spectra with equivalent width Å. The X-ray spectra can be modelled successfully in terms of with either cold or ionized absorbers. The cold X-ray absorber model requires that the QSOs have unusually flat X-ray continuum shapes and unusual optical to X-ray spectral energy distributions, while the ionized absorber model does not require abnormal underlying continuum properties. This finding, coupled with the presence of strong C IV absorption lines in the UV leads us to favour the ionized absorber model over the cold absorber model. Assuming that the X-ray absorbing gas is outflowing with the same velocities as the C IV absorbers, we are able to investigate the likely location, mass outflow rates and energetics of the ionized absorbers. We find that the X-ray absorbing gas is likely to be located within 10 pc of the continuum source, and so is associated with the active nucleus rather than the surrounding host galaxy’s interstellar medium. We estimate that the fraction of radiated power that is converted into kinetic luminosity of the outflowing winds is typically 4 per cent, in agreement with estimates for the kinetic feedback from QSOs that is required to produce the relation. This finding is thus consistent with the hypothesis that X-ray absorbed QSOs represent the transition phase between obscured accretion and the luminous QSO phase in the evolution of massive galaxies.
6 Acknowledgments
Based on observations obtained with XMM-Newton, an ESA science mission with instruments and contributions directly funded by ESA Member States and NASA. This research was also based on observations made at the William Herschel Telescope which is operated on the island of La Palma by the Isaac Newton Group in the Spanish Observatorio del Roque de los Muchachos of the Instituto de Astrofisica de Canarias, and on observations collected at the European Southern Observatory, Chile, ESO No. 62.O-0659. We thank the Royal Society for travel support under their Joint International Project scheme. SRON is supported financially by NWO, the Netherlands Organization for Scientific Research. FJC acknowledges financial support from the Spanish Ministerio de Ciencia e Innovación (previously Ministerio de Educación y Ciencia), under projects ESP2006-13608-C02-01, AYA2009-08059 and AYA2010-21490-C02-01.
References
- Alexander et al. (2005) Alexander D.M., et al., 2005, Nature, 433, 604
- Almaini et al. (2003) Almaini O., et al., 2003, MNRAS, 338, 303
- Antonucci (1993) Antonucci R., 1993, ARA&A, 31, 473
- Ashton et al. (2004) Ashton C.E., Page M.J., Blustin A.J., Puchnarewicz E.M., Branduardi-Raymont G., Mason K.O., Córdova F.A., Priedhorsky W.C., 2004, MNRAS, 355, 73
- Ashton et al. (2006) Ashton C.E., Page M.J., Branduardi-Raymont G., Blustin A.J., 2006, MNRAS, 366, 521
- Barvainis (1987) Barvainis R., 1987, ApJ, 320, 537
- Blustin et al. (2002) Blustin A.J., et al., 2002, A&A, 392, 453
- Blustin et al. (2005) Blustin A.J., Page M.J., Fuerst S.V., Branduardi-Raymont G., Ashton C.E., 2005, A&A, 431, 111
- Blustin et al. (2007) Blustin A.J., et al., 2007, A&A, 466, 107
- Boksenberg et al. (1978) Boksenberg A., Carswell R.F., Smith M.G., Whelan J.A.J., 1978, MNRAS, 184, 773
- Brandt et al. (2000) Brandt W.N., Laor A. & Wills B.J., 2000, ApJ, 528, 637
- Brinkmann, Papadakis & Ferrero (2004) Brinkmann W., Papadakis I. & Ferrero E., 2004, A&A, 414, 107
- Coppin et al. (2008) Coppin K.E.K., et al., 2008, MNRAS, 389, 45
- Costantini et al. (2007) Costantini E., et al., 2007, A&A, 461, 121
- Crenshaw & Kraemer (2001) Crenshaw D.M. & Kraemer S.B., 2001, ApJ, 562, L29
- Di Matteo, Springel & Hernquist (2005) Di Matteo T., Springel V. & Hernquist L., 2005, Nature, 433, 604
- Evans & Koratkar (2004) Evans I.N., & Koratkar A.P., 2004, ApJS, 150, 73
- Espey et al. (1989) Espey, B.R., Carswell R.F., Bailey J.A., Smith M.G., Ward M.J., 1989, ApJ, 342, 666
- Fabian (1999) Fabian A.C., 1999, MNRAS, 308, L39
- Fabian et al. (2000) Fabian A.C., et al., 2000, MNRAS, 315, L8
- Francis et al. (1991) Francis P.J., Hewett P.C., Foltz C.B., Chaffee F.H., Weymann R.J., Morris S.L., 1991, ApJ, 373, 465
- George et al. (1998) George I.M., Turner T.J., Netzer H., Nandra K., Mushotzky R.F., Yaqoob T., 1998, ApJS, 114, 73
- Gibson et al. (2009) Gibson R.R., Jiang L., Brandt W.N., Hall P.B., Shen Y., Wu J., Anderson S.F., Schneider D.P., et al., 2009, ApJ, 692, 758
- Glikman, Helfand & White (2006) Glikman E., Helfand D.J., & White R.L., 2006, ApJ, 640, 579
- Granato et al. (2004) G.J., De Zotti G., Silva L., Bressan A., Danese L., 2004, ApJ, 600, 580
- Hewitt & Burbidge (1993) Hewitt A. & Burbidge G., 1993, ApJS, 87, 451
- Hill, Thompson & Elston (1993) Hill G.J., Thompson K.L., Elston R., 1993, ApJ, 414, L1
- Hopkins et al. (2006) Hopkins P.F., Hernquist L., Cox T.J., Di Matteo T., Robertson B., Springel V., 2006, ApJS, 163, 1
- Hughes et al. (1998) Hughes D.H., et al., 1998, Nature, 394, 241
- Junkkarinen, Burbidge & Smith (1987) Junkkarinen V.T., Burbidge E.M. & Smith H.E., 1987, ApJ, 317, 460
- Krolik & Kriss (2001) Krolik J.H. & Kriss G.A., 2001, ApJ, 561, 684
- Krongold et al. (2003) Krongold Y., Nicastro F., Brickhouse N.S., Elvis M., Liedahl D., Mathur S., 2003, ApJ, 597, 832
- Laor et al. (1997) Laor A., Fiore A., Elvis M., Wilkes B.J., McDowell J.C., 1997, ApJ, 477, 93
- Lipari (1994) Lipari S., 1994, ApJ, 436, 102
- Lutz et al. (2010) Lutz D., et al., 2010, ApJ in press (astro-ph 1002.0071)
- Maiolino & Rieke (1995) Maiolino R. & Rieke G.H., 1995, ApJ, 454, 95
- Magorrian et al. (1998) Magorrian J., et al., 1998, AJ, 115, 2285
- Mason et al. (2000) Mason K.O., et al., 2000, MNRAS, 311, 456
- Mateos et al. (2005) Mateos S., et al., 2005, A&A, 433, 855
- Mateos et al. (2010) Mateos S., et al., 2010, A&A, 510, 35
- Mathews & Ferland (1987) Mathews W.G. & Ferland G.J., 1987, ApJ, 323, 456
- McKernan, Yaqoob & Reynolds (2007) McKernan B., Yaqoob T. & Reynolds C.S., 2007, MNRAS, 379, 1359
- McMahon et al. (1999) McMahon R.G., Priddey R.S., Omont A., Snellen I., Withington S., 1999, MNRAS, 309, L1
- Merritt & Ferrarese (2001) Merritt D. & Ferrarese L., 2001, MNRAS, 320, L30
- Mullaney et al. (2011) Mullaney J.R., Alexander D.M., Goulding A.D. & Hickox R.C., 2011, MNRAS, in press
- Netzer et al. (2003) Netzer H., et al., 2003, ApJ, 599, 933
- Page, Mittaz & Carrera (2000) Page M.J., Mittaz J.P.D. & Carrera F.J., 2000, MNRAS, 318, 1073
- Page et al. (2001) Page M.J., Stevens J.A., Mittaz J.P.D., Carrera F.J., 2001, Science, 294, 2516
- Page, Mittaz & Carrera (2001) Page M.J., Mittaz J.P.D. & Carrera F.J., 2001, MNRAS, 325, 575
- Page, Davis & Salvi (2003) Page M.J., Davis S.W. & Salvi N.J., 2003, MNRAS, 343, 1241
- Page et al. (2004) Page M.J., Stevens J.A., Ivison R.J., Carrera F.J., 2004, ApJ, 611, L85
- Page et al. (2006) Page M.J., et al., 2006, MNRAS, 369, 156
- Pei (1992) Pei Y.C., 1992, ApJ, 395, 130
- Piconcelli, Jiménez-Bailón & Guainazzi (2004) Piconcelli E., Jiménez-Bailón E. & Guainazzi M., 2004, MNRAS, 351, 161
- Piconcelli et al (2005) Piconcelli E., Jiménez-Bailón E., Guainazzi M., Schartel N., Rodríguez-Pascual P.M., Santos-Lleó M., 2005, A&A, 432, 15
- Pier & Krolik (1993) Pier E.A. & Krolik J.H., 1993, ApJ, 418, 673
- Pier & Voit (1995) Pier E.A. & Voit G.M., 1995, ApJ, 450, 628
- Porquet et al (2004) Porquet D., Reeves J.N., O’Brien P. & Brinkmann W., 2004, A&A, 422, 85
- Pounds et al. (2003) Pounds K.A., Reeves J.N., King A.R., Page K.L., O’Brien P.T., Turner M.J.L., 2003, MNRAS, 345, 705
- Reeves, O’Brien & Ward (2003) Reeves J.N., O’Brien P.T., Ward M.J., 2003, ApJ, 593, L65
- Reeves et al. (2004) Reeves J., Nandra K., George I.M., Pounds K.A., Turner T.J & Yaqoob T., 2004, ApJ, 602, 648
- Reynolds (1997) Reynolds C.S., 1997, MNRAS, 286, 513
- Sako et al. (2003) Sako M., et al., 2003, ApJ, 596, 114
- Sanders et al. (1988) Sanders D.B., Soifer B.T., Elias J.H., Madore B.F., Matthews K., Neugebauer G., Scoville N.Z., 1988, ApJ, 325, 74
- Schartel et al. (2005) Schartel N., Rodríguez-Pasqual P.M., Santos-Lleó M., Clavel J., Guainazzi M., Jiménez-Bailón E., & Piconcelli E., 2005, A&A, 433, 455
- Severgnini et al. (2000) Severgnini P., et al., 2000, A&A, 360, 457
- Sijacki et al. (2007) Sijacki D., Springel V., di Matteo T., Hernquist L., 2007, MNRAS, 380, 877
- Silk & Rees (1998) Silk J. & Rees M., 1998, A&A, 331, L1
- Silverman et al. (2005) Silverman J.D., et al., 2005, ApJ, 618, 123
- Smail, Ivison & Blain (1997) Smail, I., Ivison R.J., Blain A.W., 1997, ApJ, 490, L5
- Steenbrugge et al. (2005) Steenbrugge K., et al., 2005, A&A, 434, 569
- Stevens et al. (2005) Stevens J.A., Page M.J., Ivison R.J., Carrera F.J., Mittaz J.P.D., Smail I. & McHardy I.M., 2005, MNRAS, 360, 610
- Strateva et al. (2005) Strateva I.V., Brandt W.N., Schneider D.P., Vanden Berk D.E. & Vignali C., 2005, AJ, 130, 387
- Tolea, Krolik & Tsvetanov (2002) Tolea A., Krolik J.H., Tsvetanov Z., 2002, ApJ, 578, L31
- Vanden Berk et al. (2001) Vanden Berk D.E., et al., 2001, AJ, 122, 549
- Vasudevan & Fabian (2009) Vasudevan R.V. & Fabian A.C., 2009, MNRAS, 392, 1124
- Vignali, Brandt & Schneider (2003) Vignali C., Brandt W.N. & Schneider D.P., 2003, AJ, 125, 433
- Vestergaard (2003) Vestergaard M., 2003, ApJ, 599, 116
- Waskett et al. (2003) Waskett T.J., et al., 2003, MNRAS, 341, 1217
- Wyithe & Loeb (2003) Wyithe J.S.B., Loeb A., 2003, ApJ, 595, 614