Identification of Faint Chandra X-ray Sources in the Core-Collapsed Globular Cluster NGC 6397: Evidence for a Bimodal Cataclysmic Variable Population
Abstract
We have searched for optical identifications for 79 Chandra X-ray sources that lie within the half-mass radius of the nearby, core-collapsed globular cluster NGC 6397, using deep Hubble Space Telescope Advanced Camera for Surveys Wide Field Channel imaging in H, , and . Photometry of these images allows us to classify candidate counterparts based on color-magnitude diagram location. In addition to recovering nine previously detected cataclysmic variables (CVs), we have identified six additional faint CV candidates, a total of 42 active binaries (ABs), two millisecond pulsars (MSPs), one candidate active galactic nucleus, and one candidate interacting galaxy pair. Of the 79 sources, 69 have a plausible optical counterpart.
The 15 likely and possible CVs in NGC 6397 mostly fall into two groups: a brighter group of six for which the optical emission is dominated by contributions from the secondary and accretion disk, and a fainter group of seven for which the white dwarf dominates the optical emission. There are two possible transitional objects that lie between these groups. The faintest CVs likely lie near the minimum of the CV period distribution, where an accumulation is expected. The spatial distribution of the brighter CVs is much more centrally concentrated than those of the fainter CVs and the active binaries. This may represent the result of an evolutionary process in which CVs are produced by dynamical interactions, such as exchange reactions, near the cluster center and are scattered to larger orbital radii, over their lifetimes, as they age and become fainter.
Subject headings:
globular clusters: individual (NGC 6397) — X-rays: binaries — novae, cataclysmic variables1. Introduction
Gravitational interactions involving “hard” binary stars (i.e. those with orbital velocities that exceed the local velocity dispersion) provide the energy source that drives globular cluster evolution from the time that the cluster core approaches collapse (Hut et al., 1992; Heggie & Hut, 2003). These interactions have a profound effect on the long-term fates of both the cluster and the binaries. Among the hardest binaries in clusters are compact, accretional X-ray sources. Bright low-mass X-ray binaries (LMXBs), which contain a neutron star primary, are strongly overabundant in dense clusters and thus almost certainly have a dynamical origin there (see Pooley et al., 2003; Ivanova et al., 2008). There is also growing evidence that a majority of the more numerous cataclysmic variables (CVs) in clusters may also have a dynamical origin, rather than representing a primordial population (Pooley & Hut, 2006). This is a complex issue, given the many possible channels for the formation of CVs in clusters, which include: the evolution of primordial binaries, mediated by hardening interactions; exchange interactions between singles and primordial binaries, possibly involving multiple exchanges; tidal captures which do not result in mergers; and three-body interactions (see Ivanova et al., 2006). Deep surveys of compact binary populations in globular clusters will help to clarify the relative importance of these CV formation mechanisms.
NGC 6397 is the second closest globular cluster (; Strickler et al., 2009) and is by far the nearest cluster to have undergone core collapse. It thus provides a special laboratory for studying the formation and evolution of compact binary systems in the extreme environment of a collapsed core. NGC 6397 has been a key target for ROSAT, Hubble Space Telescope (HST), and Chandra X-ray Observatory (Chandra) studies of compact binaries in clusters. Cool et al. (1995) first detected cataclysmic variables in NGC 6397, as counterparts to faint ROSAT sources, using HST Wide-Field/Planetary Camera 1 H and -band imaging to select H-excess objects. Grindlay et al. (1995) confirmed the power of the photometric technique, providing HST Faint Object Spectrograph verification of the first three CV identifications in NGC 6397. Grindlay et al. (2001) carried out the first Chandra observations of NGC 6397, which detected a rich population of 25 sources within the cluster half-mass radius ( = 2.33′; Harris, 1996). WFPC2 imaging in H, , , and has led to the identification of many of these sources, including nine CVs and a number of active binaries (Taylor, 2002; Grindlay, 2006). Since the study by Taylor (2002) was carried out, we have obtained considerably deeper Chandra and HST imaging of NGC 6397. The results of the Chandra imaging, which detected 79 sources within the half-mass radius, are reported by Bogdanov et al. (2010). These X-ray sources, designated by a prefix U, are listed in Table 1. In this paper, we report a search for optical counterparts to these sources using a deep HST ACS/WFC111Advanced Camera for Surveys, Wide Field Channel dataset. We describe the data, the analysis method, and the results in the following sections.
2. Data
The optical imaging used in this study is the HST GO-10257 dataset (PI: Anderson), which provides deep, highly dithered ACS/WFC imaging of the central region of NGC 6397 in F435W (), F625W (), and F658N (H). One of the main motivations of this study was to search for wobbles in the positions of stars, indicative of massive unseen companions, such as white dwarfs, neutron stars, or black holes. To provide good time sampling, the center of NGC 6397 was imaged over 10 single-orbit epochs, spaced at approximately one-month intervals between 2004 July and 2005 June. A by product of this observing strategy is that we imaged the cluster at many different orientations, allowing for an exquisite mitigation of detector-dependent photometric and PSF-related errors. In addition, the stacked images show round PSFs with no sign of diffraction spikes. The dataset consists of 5 short (13 s), 5 long (340 s), 5 short (10 s), 5 long R (340 s), and 40 H (390 s) exposures. The short exposures were designed to provide accurate photometry for stars above the main-sequence turnoff (MSTO). Saturation only becomes an issue near the tip of the giant branch. With the large number of H frames, the PSF sampling is particularly good for this band.
3. Analysis Method
3.1. Photometry
The HST data were analyzed using software based on the program developed for the ACS Globular Cluster Treasury project, described in Anderson et al. (2008a). The routine first finds the astrometric and photometric mapping from each exposure into a master reference frame. It then searches through the master reference frame one small patch at a time, identifying stars where a significant number of exposures indicate coincident detections. These stars are then measured two ways: (1) they are measured in each individual exposure where they could be found, and (2) they are also measured simultaneously in all the exposures (which provides a better measurement for the fainter stars). Stars were measured with spatially variable, library PSFs (see Anderson & King ACS ISR 2006-01222http://www.stsci.edu/hst/acs/documents/isrs/isr0601.pdf) constructed from the GO-9444 data set (PI-Cool) of Cen, using an aperture of whole pixels that was optimized for the brightness of the star and its particular surroundings.
Since our best coverage was in H, we did our star-finding on those images, and then used the positions found to identify and measure the stars in the B and R images. The final photometry we report here comes from averaging the photometry from the individual stars, with sigma clipping applied to remove outlying values due to cosmic rays, defective pixels, etc. A total of 25004 stars were detected. For the and bands, the photometry was performed independently for the short and long frames. Photometric calibration to the VEGAMAG system was adopted from Strickler et al. (2009).
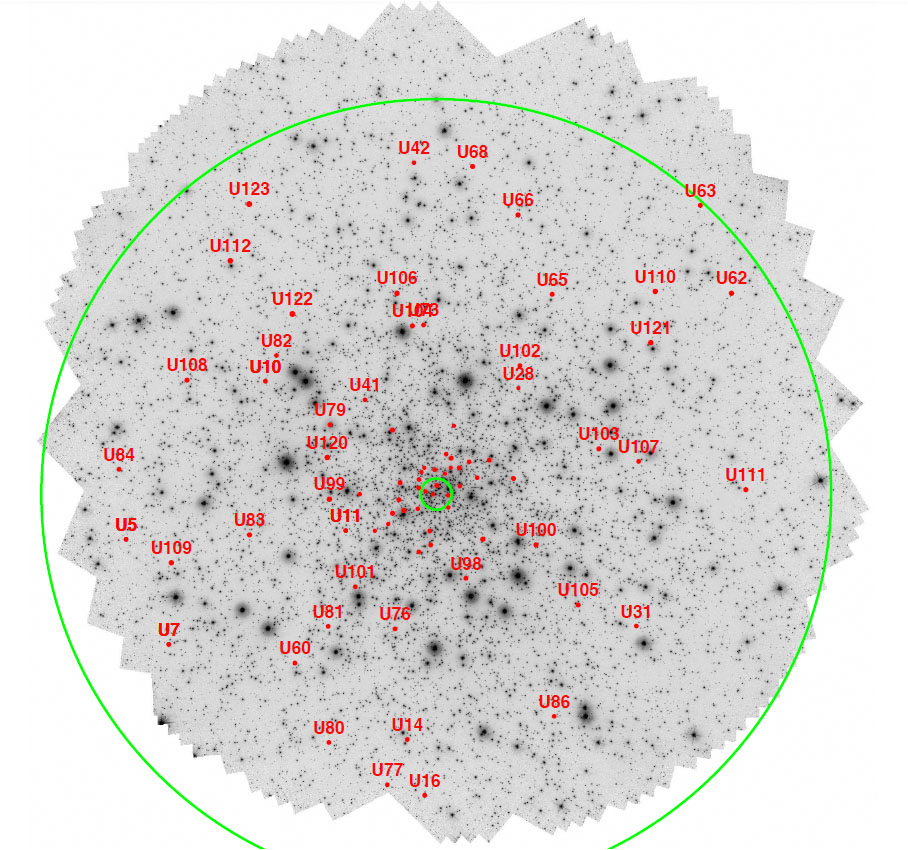
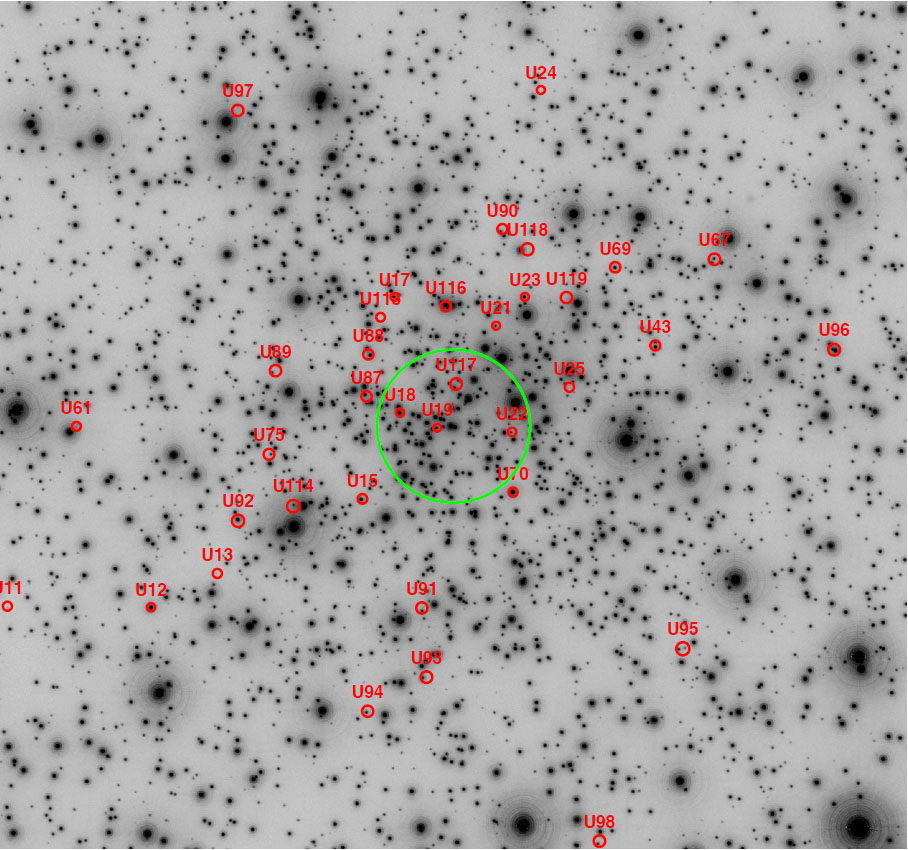
In addition to the star finding and measuring, we also produced stacked images of the scene, in a procedure that is akin to the IRAF/STSDAS drizzle algorithm with pixfrac set to zero. The stacked images were oversampled by a factor of two, in order to take advantage of the heavy dithering to increase the effective resolution. The resulting supersampled stacked images have a 12,00012,000 format and cover an approximately circular field of diameter 5′ with a pixel scale of 0.025″. Figures 1 and 2 show a combination of the 40 H images, together with the error circles for the 79 Chandra sources. The error circles are plotted at their actual sizes in both figures. As can be seen in these figures, the combination of images at various orientations results in a very smooth symmetric PSF, with a distinct lack of diffraction spikes.
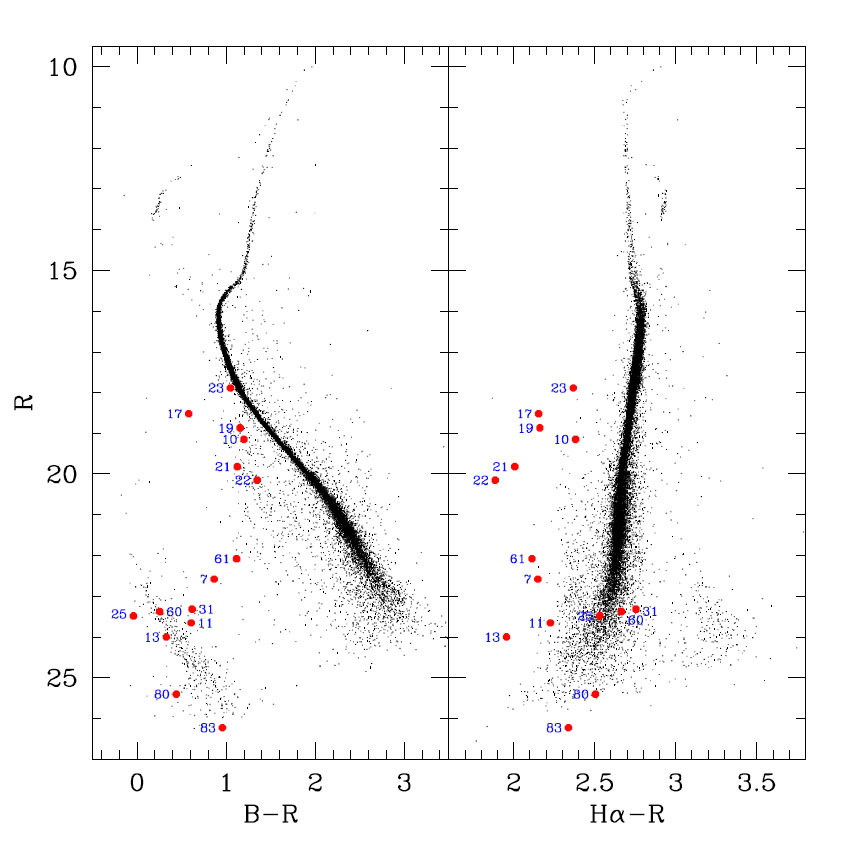
Color-magnitude diagrams (CMDs) were constructed from the photometry using the magnitudes, and the and color indices. The short-exposure and magnitudes were used for stars brighter than about 2.5 mag below the MSTO, since the long-exposure frames saturate above this point. Figures 3 and 4 show the resulting CMDs. The efficacy of the photometric procedure is indicated by the tightness of the fiducial sequences. No proper-motion cleaning has been performed at this point in the analysis. Proper-motion determination is described in §3.2. In §4.1 we will use proper motions in our source identification. Unfortunately the quality of the cluster-field separation depends too sensitively on brightness to provide a definitive membership determination for all stars. The (, ) CMD reaches deepest for the bluest stars, since the faintest red main-sequence (MS) stars are below the detection limit in . The upper part of the white dwarf (WD) cooling sequence is clearly detected in the (, ) CMD, extending to nearly 10 mag below the MSTO in . There is also an indication of a second WD sequence above the primary sequence, which Strickler et al. (2009) interpret as a He WD sequence. Note that in the (, ) CMD, the WDs lie to the H-deficit side of the MS, reflecting the strong H absorption lines in WD spectra relative to those of faint MS stars. The blue stragglers and the blue horizontal branch stars similarly lie to the H-deficit sides of the subgiant branch and the giant branch, respectively.
3.2. Astrometry
The stacked HST ACS/WFC images for each filter were rectified to a common astrometric system. We calculated an absolute astrometric zeropoint for the stacked images relative to the ICRS using a two-step process. We first computed a plate solution for an ESO WFI frame (WFI.2002-06-21T01:45:08.153) using 357 primary astrometric standards from the USNO UCAC2 catalog. We then selected 350 secondary astrometric standards from the WFI frame and used these to compute a plate solution for our stacked ACS/WFC images. We determined a boresight correction for the Chandra source coordinates from Bogdanov et al. (2010) by computing the mean offsets between the HST and Chandra coordinates for the six brightest CVs and the millisecond pulsar (MSP) PSR J1740-5340. This resulted in a shift of the Chandra coordinates to the ICRS of in RA and in Dec, where the quoted uncertainties are the standard deviations of the offsets for the seven objects. As an external test of our boresight correction, we note that our optical position for PSR J1740-5340 agrees with that of Bassa & Stappers (2004) to in RA and in Dec. They followed a similar astrometric procedure to what we used, with WFPC2 rather than ACS/WFC imaging.
We searched for optical counterparts to the Chandra sources by overlaying the Chandra error circles on the HST stacked images, with the boresight correction applied to the Chandra source positions from Bogdanov et al. (2010). The 95% confidence error circle sizes were computed following Hong et al. (2005). Since the uncertainty in the optical positions ) was small compared with the size of the X-ray error circle radii (), we neglected the contribution of the former to the total positional uncertainty.
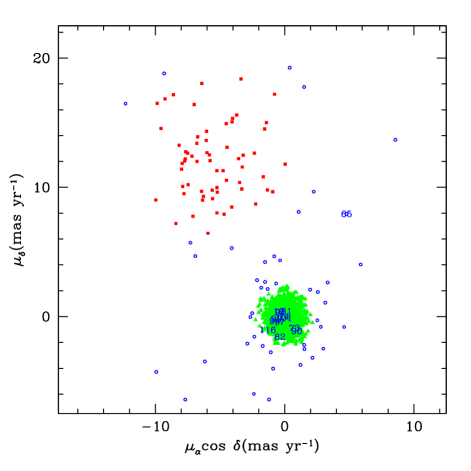
A preliminary proper-motion analysis was carried out in order to do a first-pass cluster-field separation. The present dataset was used for the reference epoch, with the stellar positions averaged over the 10 orbits. Two different datasets were considered for the second epoch, GO-7335 (obtained with the WFPC2 in 1999) and GO-10775 (obtained with the ACS/WFC in 2006). The former provides a longer time baseline, while the later provides more depth and spatial coverage. To compute proper motions, we measured stars in each early-epoch exposure image, corrected these positions for distortion, then transformed these positions into the reference frame using linear transformations based on only cluster members. By using only members to define the transformations, we automatically get displacements (and hence motions) with respect to the cluster’s systemic motion.
The cluster-field separation that can be achieved for moderately bright stars is illustrated in Fig. 5, which shows the proper-motion distribution for stars with . Cluster and field regions are defined by a magnitude-dependent radius about the centroids of the apparent cluster and field clumps. Stars that do not reside in either of these regions are considered to have an unknown proper-motion membership status. Since the proper-motion error increases with magnitude, this proper-motion separation becomes less effective with increasing magnitude. Eventually the cluster and field regions of the proper-motion plane show a strong overlap. It was generally possible to obtain an approximate discrimination between cluster and field stars to a limiting magnitude of . In a few cases where the 2006-second-epoch results were resulted in an unknown proper-motion membership status, the 1999-second-epoch results were definitive.
4. Results
4.1. Chandra Source Identification
Optical CMDs provide a powerful means of selecting likely Chandra source counterparts and investigating their properties. For each of the 79 Chandra sources within the half-mass radius, we checked the locations of all objects within the X-ray error circle in the CMDs shown in Figures 3 and 4. Objects that fell on the main sequence were considered to be unlikely counterparts, given the relatively low X-ray to optical flux ratio, , of most MS stars, in contrast to the ranges for chromospherically active binaries and cataclysmic variables. Table 1 summarizes the result of this counterpart search. Plausible identifications were obtained for nearly all sources and are listed in this table, along with previous source designations, inferred object types, proper-motion information, and photometry. The only sources for which the error circle was empty are the quiescent low-mass X-ray binary (qLMXB) U24 (Grindlay et al., 2001), U104, U106, U111, U113, U119, U121, U122, and U123. In the case of U24, there is a small “blip” near the center of the error circle in the stacked image, but it likely represents the combination of Airy ring artifacts from two bright nearby stars. Several other sources, U5, U16, U77, and U84, lie outside of the field and thus are difficult to classify, from these data, due to the lack of and color measurements. However, the U5 and U77 counterparts, V30 and V36 respectively, have been shown to be variable using ground-based photometry (Kaluzny et al., 2006).333Prefix V objects are variable stars from the ground-based studies of Kaluzny & Thompson (2003) and Kaluzny et al. (2006). Kaluzny et al. (2006) classified V30 as an eclipsing binary that lies to the far red of the main sequence (suggestive of it being a non-member). Rozyczka et al. (2010) have recently classified V36 as a single-line spectropsopic binary. We have classified both of these stars as uncertain active binaries (ABs). U5 and U84 have very red colors, suggesting that their colors are likely very red as well, which supports an AB identification. Table 1 also gives a summary of the results of the proper-motion analysis, which indicates whether the object is consistent with being a cluster member, a field member, or neither, based on a comparison of its proper motion to the proper-motion distribution for stars of similar magnitude.
4.2. Source Types
Based on the location of the proposed counterparts in the CMDs (or, in a few cases, based on ground-based detection of variability), we primarily assigned types of cataclysmic variable (CV) and chromospherically active binary (AB). CVs were defined as being significantly to the blue of the MS and having significant H excesses (either relative to the MS or to the white dwarf sequence). ABs were defined as lying within mag above the MS (and thus within mag to the red of the MS) and having small H excesses ( mag), based on the previous analysis of ABs in NGC 6397 by Taylor et al. (2001). In three cases where the only object in the error circle was an apparent MS star, U41, U91, and U112, we note its presence in Table 1. Similarly, an apparent MSTO star is the only object present in the error circle for source U118. We note that an AB with a low mass ratio and weak lines could look like a MS star in both CMDs.
Two objects, U28 and U108, were classified as background galaxies based on the extended appearance of their images. U28 resembles an edge-on spiral, while U108 has a more complex structure suggestive of interacting galaxies. The high X-ray to optical flux ratio of U28 (see §4.3) suggests that it is an active galactic nucleus (AGN). While the flux ratio of U108 was not determined, due to the complex nature of the optical image, it is clearly much lower than that of U28. One possibility is that we are detecting X-ray emission from U108 that is produced by a galaxy collision.
Figure 3 shows the location of the CV candidates in the CMDs. There is a suggestion of an evolutionary sequence from young, bright CVs to old, faint ones. We return to this point in §5. The six brightest CVs mostly lie about 0.2 – 0.8 mag to the blue of the MS. The optical emission of the systems appears to be dominated by the secondary in the band, with a larger contribution from the disk in the band. The fairly high -band flux indicates that the secondaries are relatively massive, , as inferred from the isochrones of Baraffe et al. (1997). All of the bright CVs have substantial H excesses relative to the MS; these excesses generally increase with magnitude.
The CV candidates 1–8 are numbered according to the scheme used in previous papers, as listed by Grindlay et al. (2001). A prefix CV is used to designate each CV candidate. Grindlay et al. (2001) identify U28 as a CV; however we find that this Chandra source appears to be a galaxy. Here we use the identification by Taylor (2002) of U60 as CV9. CVs 10–15 are newly identified in the present study; Grindlay (2006) assigned numbers for CVs 10 and 11. We have numbered CVs 12–15 based on optical luminosity within this group. The translation between Chandra source numbers and CV numbers is given in Table 1.
There is a two magnitude gap between the bright CVs and the fainter CVs. Just below this gap are two possible transitional objects, U7 and U61, which lie between the white dwarf sequence and the main sequence. We note that the proper-motion data produce an unknown membership status for U61, while U7 registers as consistent with membership. This leaves open the possibility that U61 is a background AGN with an emission line that is shifted into the H window. However, the image of the U61 counterpart does not show obvious evidence of extension. The fainter CV candidates, below U7 and U61, lie in the vicinity of the WD cooling sequence. The optical fluxes for the faint CV candidates are clearly dominated by the contribution of the WD. The indices for these faint CVs nearly all lie at least 0.5 mag to the H excess side of the WD clump, which is centered at about . This suggests that the faint CVs have a strong H-emission core (due to an accretion disk) within the broad absorption lines of the WD continuum. This inferred spectroscopic property of the faint CVs appears to be generally consistent with those of the WZ Sge class of evolved cataclysmic variable (Schwarz et al., 2004). Another possibility is that some of these objects are AM CVn type double-degenerate systems, in which a low-mass He WD donor feeds a much more massive carbon-oxygen WD. Such systems show no evidence of hydrogen lines in their spectra and instead have He I and sometimes He II lines, which are typically in emission (Anderson et al., 2005, 2008b). AM CVn stars could have evolved into contact from the known He WDs in NGC 6397, which have been shown to have (detached) heavy CO WD companions (Strickler et al., 2009). Such an object should lie close to the main sequence in the CMD. Possible candidate AM CVn stars among the CV candidates reported here are U25, U31, U60, U80, and U83.
We note that most of the WD-like CV candidates cluster near a magnitude of , which corresponds to a , using the distance modulus determined by Strickler et al. (2009). We note that Gänsicke et al. (2009) have reported a sharp peak (“spike”) near the period minimum () in the period distribution of CVs selected from the Sloan Digital Sky Survey (SDSS). The average absolute magnitude for the CVs in the spike is . Allowing for the difference in photometric band, this is reasonably close to the characteristic magnitude of the faint CVs in our study. This suggests that these faint CVs may well belong to the spike population, i.e. have periods in the vicinity of the period minimum. This could be tested by determining orbital periods for the faint CVs from suitable time-resolved photometry. Gänsicke et al. (2009) find that of 33 CVs with orbital periods less than 86 min, 20 have spectra that are WD-dominated. In our sample, it appears that all seven faint CVs are WD-dominated. Given the small sample size, it is not clear whether this represents a significant difference between faint field and faint cluster CVs.
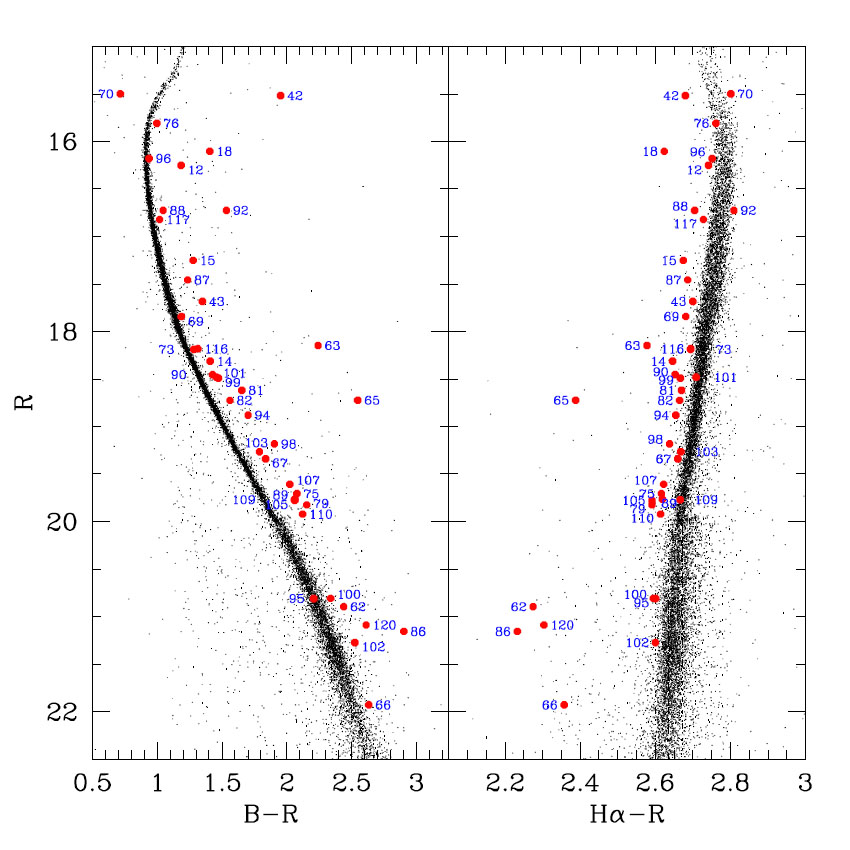
Figure 4 shows the location of the objects identified as AB stars in the CMDs. We note that these objects sometimes lie near the edge of the MS in either the right or left panel, but deviate by a larger amount in the other panel. Of the 42 AB counterparts listed in Table 1, 26 are newly identified in our study. Overall, the ABs appear to form a relatively homogeneous binary sequence alongside the MS, presumably mostly differing in mass. Taylor et al. (2001) have argued that these stars are likely BY Draconis stars and represent a hard binary population in NGC 6397. In a large study of photometric variability in 47 Tuc, Albrow et al. (2001) found a substantial population of BY Draconis binaries, as well as W UMa and other contact binaries, and eclipsing binaries.
In addition to the likely BY Dra population, there are a number of counterparts that show a significantly different distribution in the CMD. These include the “red straggler” counterpart to U12 (the millisecond pulsar) and the similar counterpart to U18, the blue-straggler counterpart to U70, a group of five stars with very red colors, and a group of five stars with strong H excesses. There are two stars in common between these latter two groups.
The counterparts to U12 and U18 both have proper motions consistent with cluster membership. Given their similar optical and X-ray properties, it appears likely that U18 is a MSP (Bogdanov et al., 2010). The counterpart to U70, which registers as a proper-motion cluster member, has been identified as variable star V20 by Kaluzny & Thompson (2003). Rozyczka et al. (2010) find that it is a double-line spectroscopic binary with a period of and a mass ratio of . The He WD candidate PC-5 (Taylor et al., 2001), which has been previously suggested as a possible counterpart to U70, lies well outside of the current error circle.
The counterparts to U42, U63, U65, U86, and U92 differ strikingly from the typical ABs, lying up to 1 mag to the red of the MS, and thus well above it. Of these, the counterparts to U42 and U92 have been previously identified as optically variable stars (Kaluzny et al., 2006), as confirmed here (see §4.4 and Fig. 7); the counterparts to U63, U65, and U86 are new identifications. The U92 counterpart (V7) is classified as a W UMa system by Kaluzny & Thompson (2003), while the U42 counterpart (V26) is classified as an irregular variable by Kaluzny et al. (2006). U92 is consistent with the cluster proper-motion distribution. The proper-motion information available for U42, U65, and U86 produce an unknown membership status. These stars have proper motions that are well outside of the cluster distribution but they are also inconsistent with the field distribution. There is no proper-motion information for U63. One reasonable possibility is that these stars are foreground active binaries superposed on the cluster, as discussed by Kaluzny et al. (2006) in the case of U5 (V30). In this interpretation, the foreground binaries contain K/M type dwarfs with distance moduli that put them well above the cluster main sequence in the CMD.
Figure 4 also shows several AB candidates that have larger than typical H excesses; these include the counterparts to U62, U65, U66, U86, and U120. There is no proper-motion information available for U62. The proper-motion information for U65, U86, and U120 produces an unknown membership status. U66 is consistent with the field proper-motion distribution. Thus, the proper-motion information does not offer much assistance in determining whether these stars are likely cluster members.
Rozyczka et al. (2010) have drawn attention to two of the variable stars that we have identified as AB counterparts, V17 and V36, which correspond to the sources U76 and U77. These similar objects both lie close to the main-sequence turnoff in the CMD presented by Rozyczka et al. (2010). Both objects are single-line spectroscopic binaries, in which the unseen primary is inferred to have a mass in excess of 1 . They suggest that these two objects are members of a class of dormant degenerate binaries which may have much larger peak X-ray luminosities.
4.3. X-ray to Optical Flux Ratios
As an additional aid to the classification of sources, we have examined the X-ray to optical flux ratio, , where we take from Bogdanov et al. (2010) and set . The latter conversion factor is computed from the HST flux calibration constants. The X-ray count to flux transformation assumes a power-law spectrum with a photon index of (Bogdanov et al., 2010). The resulting flux ratio is plotted versus in Fig. 6. The ratio is observed to be higher for accretional sources, such as CVs, LMXBs, and AGNs, than for chromospherically active binaries (see e.g. Bassa et al., 2004, who studied the Chandra source distribution in M4). Consistent with this, Fig. 6 shows that the CV and AB candidates form two distinct groups with no overlap in flux ratio. The median flux ratio is about 500 times larger for the CVs than for the ABs. Within each group there is a broad range of the flux ratio, about a factor of 40 for the CVs and a factor of 100 for the ABs. There is no apparent dependence of the flux ratio on over a range of more than three decades in for the CVs and nearly two decades for the ABs. The apparent AGN, U28, has the highest flux ratio of all objects. The known millisecond pulsar, U12, has a higher flux ratio than most of the ABs and is about 40 brighter in the X-ray than a typical AB. The object U18, which has a similar optical counterpart to that of U12, has even higher values of and . This supports the interpretation of U18 as a MSP not yet detected at radio wavelengths (Bogdanov et al., 2010).
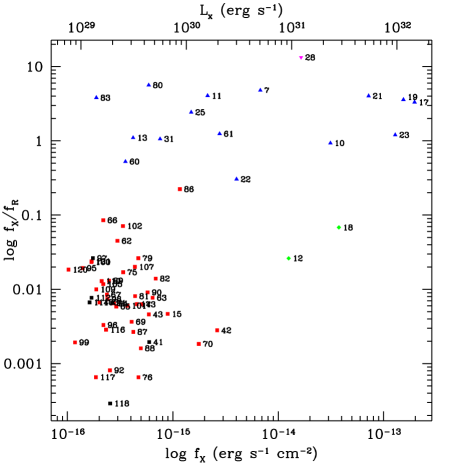
Interestingly, the X-ray flux of CV5 (U22) is considerably lower in the 2007 observations than in the previous 2002 observations; the flux differs more than an order of magnitude. This gives CV5 the lowest value of all the CVs when the 2007 X-ray flux is used together with the 2004-05 optical flux. Since the X-ray and optical fluxes were not measured contemporaneously, it is possible that CV5 typically has a flux ratio that is more consistent with the other bright CVs. We note that the X-ray flux of a bright CV typically drops during outburst (e.g. Wheatley et al., 2003), suggesting that CV5 may have been in outburst in 2007. The objects U62, U66, and U86, which lie among the ABs with the four highest flux ratios, all have significantly larger H excesses than the typical AB. It is not surprising that two measures of chromospheric activity, X-ray flux and H flux, are correlated for these stars.
4.4. Variability
Since our dataset provides a 40-exposure time sequence of H exposures, with four exposures per orbit, it was possible to investigate optical variability. The time sequence samples time scales shorter than about one hour (the visibility period per HST orbit) and also time scales from one month to one year. The analysis of variability is complicated by the presence of outliers in the time sequences, some of which represent photometric anomalies. We investigated several measures of variability and adopted the RMS deviation about the mean of the H magnitude measurements, computed using an iterative 3 clip to reduce the impact of outliers. We plot versus mean H magnitude in Figure 7. This procedure results in a measure of variability that is most sensitive to orbital variability of binary systems, rather than large-amplitude fluctuations of CVs, given the outlier filtering. Thus, we also investigated the total range of the H magnitudes for each object and constructed light curves for each of the CV candidates in order to test for outburst behavior.
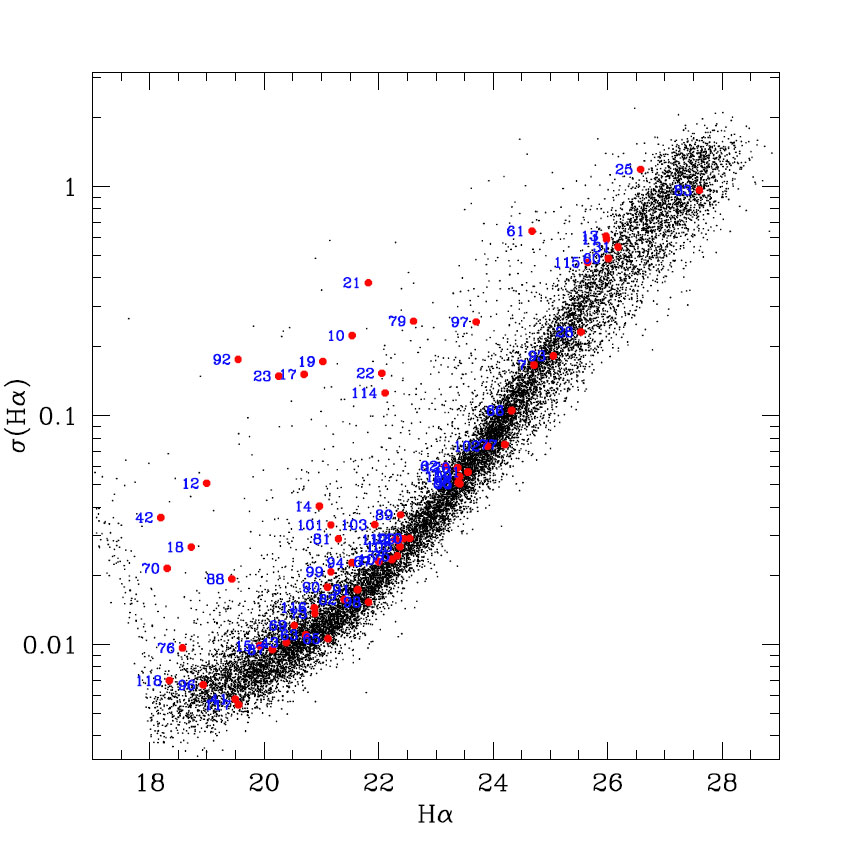
As can be seen in Fig. 7, most stars fall on a well-defined sequence of increasing with increasing magnitude. Stars that lie significantly above this sequence generally show evidence for variability, although some of this scatter is likely due to photometric issues. We note that the mean trend of the variability index with mean H magnitude differs for stars brighter than , for which increases from a minimum of about 0.003 mag to about 0.04 mag for the brightest stars plotted. This behavior for bright stars is due to saturation issues that increase in size with decreasing magnitude.
We have plotted the positions of the previous and new Chandra source counterparts in Fig. 7. Many of these counterparts show significant variability as measured by the of the H time series. This group includes all of the bright CVs 1–6: sources U10, U17, U19, U21, U22, and U23. Of the newly identified faint CV counterparts, only U61 registers as clearly variable by this measure and U25 shows a possible slight variability. While the other faint CV candidates have values that are comparable in size to those of the bright CVs, these values are not significantly larger than those of other stars of similar magnitude. Thus, the failure to detect statistically significant variability for the other faint CV counterparts may well be due to the decreasing sensitivity of the variability test with increasing magnitude.
The total magnitude range for each of the six bright CVs was about 0.6–1.3 mag, which is less than the 2–5 mag amplitude for a dwarf nova outburst (Warner, 1995). Source U21 (CV4) had the largest amplitude (1.3 mag) of these bright CVs, with a light curve that a high phase of about 50 days duration. Source U61 (CV12) displayed a total range of 2.3 mag. The faintest magnitude measurements, which contribute significantly to this large range, have a high degree of uncertainty. The light curve shows a clearly differentiated low state in the first half of the year of observation and a high state during the second half. The mean offset between these two states is about 1 mag and thus also falls short of a dwarf nova outburst.
A number of the candidate AB counterparts also show evidence of variability, including six newly identified ABs: sources U79, U97, and U114, which show strong variability at the level of the six bright CVs; sources U88 and U101, which show moderate variability; and source U103, which shows slight evidence of variability. Five previously identified AB counterparts, U14, U18, U42, U70, and U92, show clear variability, and U76 and U81 show weaker evidence of variability. We note that U18 has a similar level of variability to the MSP counterpart U12, again suggesting that these are similar objects.
We carried out a period-folding light curve analysis for the bright CVs 1–6 and the MSP U12. Given the very unequal spacing of the data, it is difficult to determine a period ab initio, due to the high degree of aliasing. However, we were able to confirm the previously determined orbital periods obtained by Kaluzny & Thompson (2003) and Taylor (2002) for CVs 1 and 6, as well as that of U12 (D’Amico et al., 2001). We also see evidence for additional long-term variability for CVs 1 and 6, at the level of a few tenths of a magnitude.
4.5. Spatial Distribution
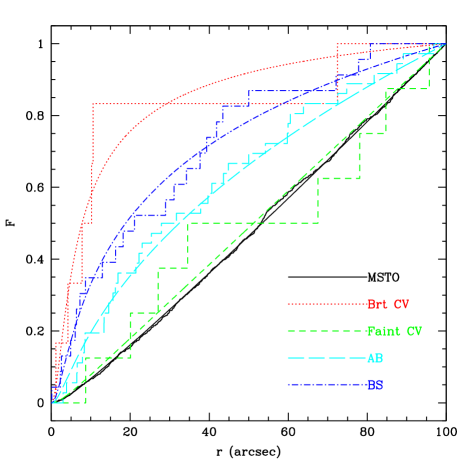
We determined the cluster center by iterative centroiding in a 20″ radius aperture using a sample of MS stars with magnitudes in the range . The resulting center of lies within about 1″ of CV2 (U19). Experimentation with the centroiding aperture size and the stellar sample definition indicates that the center position is uncertain by about 1″. We then determined the cumulative radial distributions of a number of stellar groups out to a radius of 100″, which is the approximate size of the central surface density cusp of NGC 6397 (Lugger et al., 1995). Figure 8 shows the distribution functions for the stellar groups listed in the figure legend. As has been previously noted, the bright CVs in NGC 6397 show a strong central concentration relative to other stellar groups, including the fainter CVs. With the exception of CV6, the five other bright CVs lie within 11″ () of the cluster center. In comparison, with the exception of U25, the faint CVs lie at least 20″ () from the cluster center. We carried out Kolmogorov-Smirnov intercomparisons of the stellar samples defined in Fig. 8. The comparison of each group to a MSTO sample, defined by , is given in Table 2, where the probability, , of the two samples being drawn from the same parent distribution is listed. The bright CV and blue straggler (BS) samples both differ very significantly from the MSTO sample (), while the overall CV and AB samples differ from the MSTO sample at the 4% level and 1% level, respectively. The bright and faint CV samples differ from each other at a significance level of 3% and the bright CV and AB samples differ at a level of 2%.
| Sample | NaaSize of sample within 100″ of cluster center | bbSignificance of mass excess above MSTO mass | K-S probccK-S probability of consistency with MSTO group | ||||
|---|---|---|---|---|---|---|---|
| MSTO | 1111 | 1.0 | |||||
| CV | 14 | 2.3 | 4.0% | ||||
| bright CV | 6 | 2.9 | 0.07% | ||||
| faint CV | 8 | 0.2 | 89% | ||||
| AB | 36 | 2.6 | 1.1% | ||||
| BS | 23 | 3.7 | 0.03% |
In order to further investigate the spatial distribution of the Chandra sources in NGC 6397 and the implications for object masses, we carried out maximum likelihood fits of what has been termed a “generalized King model” to the surface density distributions. This model can be described more generally as a “cored power law,” in that it has a smooth transition from an inner core region to an outer power law. It takes the form,
| (1) |
with the core radius related to the scale parameter by,
| (2) |
An “analytic King model,” which provides a good fit to the surface density profile of the turnoff-mass stellar group for a normal-core cluster (e.g. 47 Tuc; Heinke et al., 2005), corresponds to and . Since NGC 6397 has a central-cusp structure, due to its core-collapsed status, we expect that the turnoff-mass group will have a flatter power-law slope than (Cohn, 1985). We performed a maximum-likelihood fit of Eqn. 1 to a turnoff-mass group, defined by and radial offset within of the cluster center, to determine the best-fit values of and . We used nonlinear optimization to maximize the likelihood and bootstrap resampling to estimate the parameter uncertainties, as discussed by Grindlay et al. (2002). The resulting best-fit parameter values are and .
By fitting Eqn. 1 to the surface density distributions of individual groups such as the CVs and ABs, the characteristic masses of these objects can be estimated, as described by Heinke et al. (2005) and Lugger et al. (2007). In order to do this, we adopt the approximation here that stellar groups with masses exceeding the turnoff mass are in approximate thermal equilibrium with the turnoff mass group and that the velocity dispersion of each mass group is approximately constant with radius within the central cusp region. This approach is motivated by Fokker-Planck simulations of post-collapse core oscillations which indicate that a cluster core spends a majority of the time near a maximally expanded state in which the more massive stellar groups are close to thermal equilibrium (Murphy et al., 1990). More recent Monte-Carlo and N-body simulations suggest that the presence of primordial binaries may delay the gravothermal oscillation phase to well beyond a Hubble time and that even clusters with an observationally core-collapsed designation such as NGC 6397 may still be in the binary burning phase (Fregeau, 2008). In any case, the assumption of thermal equilibrium among the most massive components in the central region of an evolved cluster is a useful starting point.
In the thermal equilibrium approximation, the surface density profile for a mass group with mass is given by Eqn. 1 with a slope parameter related to the turnoff-mass slope by
| (3) |
where . Thus, fitting this model involves just one free parameter, the mass ratio , as is determined by normalization and and are determined by the fit to the turnoff-mass group.
Table 2 gives the results of maximum-likelihood fits of Eqn. 1 to the turnoff mass stars, CVs, ABs, and a comparison group of blue stragglers (BSs). The cumulative radial distributions for these groups and the model fits are shown in Fig. 8. As can be seen from the table, the values for all of the groups exceed unity, indicating that the characteristic masses exceed the turnoff mass. For all cases other than the faint CVs, the excesses are significant at the 2 or higher level. The groups with the strongest evidence for a mass significantly above the turnoff mass are the bright CVs () and the BSs (). We note that the results of this analysis agree with the K-S comparison results given in the last column of the table. The inferred mass range for the bright CVs () is consistent with a system made up of a heavy white dwarf (e.g. ) with a main sequence secondary of mass . The inferred mass range for the faint CVs () is consistent with a somewhat less massive white dwarf (e.g ) and a secondary mass that has been whittled down to . In such a system, the optical flux would be dominated by the white dwarf, as observed here. We presume that the white dwarf in this case has been heated by the accretion process, since noninteracting heavy white dwarfs are too faint to detect due to the degree of cooling that has occurred over their long lifetimes. As discussed in §4.2, an alternative interpretation is that some of the CVs are AM CVn systems, in which the secondary is a He WD. In this case, the mass of the secondary would likely be about 0.2–0.3 (Strickler et al., 2009). It is interesting to compare the white dwarf masses inferred here with those for field CVs. Southworth et al. (2009) have recently determined a mass of for the WD in a field CV that lies above the period gap. Littlefair et al. (2008) have determined the masses of the WDs in seven CVs that lie below period gap, with a resulting mean mass and standard deviation of . Thus, given the uncertainty ranges in the CV masses inferred here, our results for likely WD masses are generally consistent with these measured WD masses.
5. Summary
We have shown that with moderately deep , , and H HST-ACS/WFC imaging, it is possible to identify and classify nearly all of the 79 currently detected Chandra sources within the half-mass radius of NGC 6397. Our classifications are based on CMD location and are tested for consistency with expected ranges of the X-ray to optical flux ratio. In only a few cases was it not possible to classify the source, generally due to a lack of coverage in one filter. The vast majority of the sources in the cluster can be classified as either cataclysmic variables (a total of 15) or active binaries (a total of 42). The X-ray to optical flux ratio for the CVs (0.2 – 6) substantially exceeds that for most of the ABs (). There is one previously known MSP and one potential MSP; the latter classification is based on the similar photometric properties of the two objects.
The proper-motion test for cluster membership produces an unknown status for many of the Chandra source counterparts. This is largely a consequence of the short time baseline of 1.5 years between the two epochs of ACS/WFC data used for determining proper motions. While the 1999 WFPC2 observations give a longer baseline, fewer stars are detected by the WFPC2. Thus, the proper-motion part of this study would benefit substantially from new HST observations of NGC 6397 with either the ACS/WFC or the WFC3. While it appears likely that the vast majority of the proposed counterparts are cluster members, proper-motion confirmation would be valuable. It would be particularly interesting to know how many of the atypical ABs are cluster members. While it is likely that most are foreground stars, one of the very red ones has appears to be a member on the basis of our preliminary proper-motion measurements.
The CV distribution in NGC 6397 has a bimodal character. We detect distinct bright and faint populations with only two possible transition objects. The optical emission of the six brightest CVs appears to be dominated by a relatively massive secondary, while that of the faint CVs appears to be dominated by the WD, with very little contribution from a very low-mass secondary. Alternatively, some of the faint CVs may be AM CVn systems, with a He WD secondary. The distribution of CVs in optical luminosity and color is consistent with expected CV evolution due to the effects of mass transfer and angular momentum loss. As CVs age and the secondary loses mass to the primary, the orbit tightens due to magnetic braking and ultimately gravitational wave radiation. In this picture, the bright CVs 1–6 represent young, recently formed systems, while the faint CVs represent old, highly evolved systems. While CVs can be born at any orbital period, depending on the nature of the secondary star, there is a bias for CVs formed in exchange interactions in collapsed cluster cores to have more massive secondaries and thus longer orbital periods than newly formed field CVs. This is both the result of mass segregation in the cluster, which may invert the mass function in the cluster core, and of the tendency for more massive stars to displace less massive ones in exchange interactions. Thus, while it is possible for a faint CV to be a young system, we expect that the bulk of the faint CVs evolved from an earlier bright state.
Given the likely ongoing formation of CVs by dynamical processes in the central region of the cluster, it is plausible that we are observing a roughly equilibrium CV population in NGC 6397. However, there remains a possibility that the current population of six bright CVs represents the result of a recent core collapse event that resulted in an enhanced production of CVs. In this case, the bright CVs would be overpopulous relative to the faint CVs.
The six brightest CVs in NGC 6397 have a much more centrally concentrated spatial distribution than do either the fainter CVs or the ABs. Indeed, five of six bright CVs are located within about 2 of the cluster center, while all but one of the fainter CVs lie outside of 4 . This suggests that CVs are preferentially formed by dynamical processes within the core and surrounding region and migrate to larger radii as they age and undergo repeated scattering interactions that act to increase the typical size of their orbits in the cluster potential. Since repeated strong interactions between compact binaries and other stars ultimately result in the ejection of the binaries from clusters, the lifetime of a compact binary in a cluster is extended if the amount of time it spends in the central region of the cluster is reduced. Thus, it is reasonable to expect that long-lived CVs in globular clusters should generally be found outside of the densest regions. This is consistent with the spatial distribution of the CVs in NGC 6397.
References
- Albrow et al. (2001) Albrow, M. D., Gilliland, R. L., Brown, T. M., Edmonds, P. D., Guhathakurta, P., & Sarajedini, A. 2001, ApJ, 559, 1060
- Anderson et al. (2008a) Anderson, J., Sarajedini, A., Bedin, L. R., King, I. R., Piotto, G., Reid, I. N., Siegel, M., Majewski, S. R., Paust, N. E. Q., Aparicio, A., Milone, A. P., Chaboyer, B., & Rosenberg, A. 2008a, AJ, 135, 2055
- Anderson et al. (2008b) Anderson, S. F., Becker, A. C., Haggard, D., Prieto, J. L., Knapp, G. R., Sako, M., Halford, K. E., Jha, S., Martin, B., Holtzman, J., Frieman, J. A., Garnavich, P. M., Hayward, S., Ivezić, Ž., Mukadam, A. S., Sesar, B., Szkody, P., Malanushenko, V., Richmond, M. W., Schneider, D. P., & York, D. G. 2008b, AJ, 135, 2108
- Anderson et al. (2005) Anderson, S. F., Haggard, D., Homer, L., Joshi, N. R., Margon, B., Silvestri, N. M., Szkody, P., Wolfe, M. A., Agol, E., Becker, A. C., Henden, A., Hall, P. B., Knapp, G. R., Richmond, M. W., Schneider, D. P., Stinson, G., Barentine, J. C., Brewington, H. J., Brinkmann, J., Harvanek, M., Kleinman, S. J., Krzesinski, J., Long, D., Neilsen, Jr., E. H., Nitta, A., & Snedden, S. A. 2005, AJ, 130, 2230
- Baraffe et al. (1997) Baraffe, I., Chabrier, G., Allard, F., & Hauschildt, P. H. 1997, A&A, 327, 1054
- Bassa et al. (2004) Bassa, C., Pooley, D., Homer, L., Verbunt, F., Gaensler, B. M., Lewin, W. H. G., Anderson, S. F., Margon, B., Kaspi, V. M., & van der Klis, M. 2004, ApJ, 609, 755
- Bassa & Stappers (2004) Bassa, C. G., & Stappers, B. W. 2004, A&A, 425, 1143
- Bogdanov et al. (2010) Bogdanov, S., van den Berg, M., Heinke, C. O., Cohn, H. N., Lugger, P. M., & Grindlay, J. E. 2010, ApJ, 709, 241
- Cohn (1985) Cohn, H. 1985, in IAU Symp. 113: Dynamics of Star Clusters, 161–177
- Cool et al. (1995) Cool, A. M., Grindlay, J. E., Cohn, H. N., Lugger, P. M., & Slavin, S. D. 1995, ApJ, 439, 695
- D’Amico et al. (2001) D’Amico, N., Lyne, A. G., Manchester, R. N., Possenti, A., & Camilo, F. 2001, ApJ, 548, L171
- Fregeau (2008) Fregeau, J. M. 2008, ApJ, 673, L25
- Gänsicke et al. (2009) Gänsicke, B. T., Dillon, M., Southworth, J., Thorstensen, J. R., Rodríguez-Gil, P., Aungwerojwit, A., Marsh, T. R., Szkody, P., Barros, S. C. C., Casares, J., de Martino, D., Groot, P. J., Hakala, P., Kolb, U., Littlefair, S. P., Martínez-Pais, I. G., Nelemans, G., & Schreiber, M. R. 2009, MNRAS, 397, 2170
- Grindlay (2006) Grindlay, J. E. 2006, Advances in Space Research, 38, 2923
- Grindlay et al. (2002) Grindlay, J. E., Camilo, F., Heinke, C. O., Edmonds, P. D., Cohn, H., & Lugger, P. 2002, ApJ, 581, 470
- Grindlay et al. (1995) Grindlay, J. E., Cool, A. M., Callanan, P. J., Bailyn, C. D., Cohn, H. N., & Lugger, P. M. 1995, ApJ, 455, L47+
- Grindlay et al. (2001) Grindlay, J. E., Heinke, C. O., Edmonds, P. D., Murray, S. S., & Cool, A. M. 2001, ApJ, 563, L53
- Harris (1996) Harris, W. E. 1996, AJ, 112, 1487
- Heggie & Hut (2003) Heggie, D., & Hut, P. 2003, The Gravitational Million-Body Problem: A Multidisciplinary Approach to Star Cluster Dynamics (The Gravitational Million-Body Problem: A Multidisciplinary Approach to Star Cluster Dynamics, by Douglas Heggie and Piet Hut. Cambridge University Press, 2003, 372 pp.)
- Heinke et al. (2005) Heinke, C. O., Grindlay, J. E., Edmonds, P. D., Cohn, H. N., Lugger, P. M., Camilo, F., Bogdanov, S., & Freire, P. C. 2005, ApJ, 625, 796
- Hong et al. (2005) Hong, J., van den Berg, M., Schlegel, E. M., Grindlay, J. E., Koenig, X., Laycock, S., & Zhao, P. 2005, ApJ, 635, 907
- Hut et al. (1992) Hut, P., McMillan, S., Goodman, J., Mateo, M., Phinney, E. S., Pryor, C., Richer, H. B., Verbunt, F., & Weinberg, M. 1992, PASP, 104, 981
- Ivanova et al. (2008) Ivanova, N., Heinke, C. O., Rasio, F. A., Belczynski, K., & Fregeau, J. M. 2008, MNRAS, 386, 553
- Ivanova et al. (2006) Ivanova, N., Heinke, C. O., Rasio, F. A., Taam, R. E., Belczynski, K., & Fregeau, J. 2006, MNRAS, 372, 1043
- Kaluzny & Thompson (2003) Kaluzny, J., & Thompson, I. B. 2003, AJ, 125, 2534
- Kaluzny et al. (2006) Kaluzny, J., Thompson, I. B., Krzeminski, W., & Schwarzenberg-Czerny, A. 2006, MNRAS, 365, 548
- Littlefair et al. (2008) Littlefair, S. P., Dhillon, V. S., Marsh, T. R., Gänsicke, B. T., Southworth, J., Baraffe, I., Watson, C. A., & Copperwheat, C. 2008, MNRAS, 388, 1582
- Lugger et al. (1995) Lugger, P. M., Cohn, H. N., & Grindlay, J. E. 1995, ApJ, 439, 191
- Lugger et al. (2007) Lugger, P. M., Cohn, H. N., Heinke, C. O., Grindlay, J. E., & Edmonds, P. D. 2007, ApJ, 657, 286
- Murphy et al. (1990) Murphy, B. W., Cohn, H. N., & Hut, P. 1990, MNRAS, 245, 335
- Pooley & Hut (2006) Pooley, D., & Hut, P. 2006, ApJ, 646, L143
- Pooley et al. (2003) Pooley, D., Lewin, W. H. G., Anderson, S. F., Baumgardt, H., Filippenko, A. V., Gaensler, B. M., Homer, L., Hut, P., Kaspi, V. M., Makino, J., Margon, B., McMillan, S., Portegies Zwart, S., van der Klis, M., & Verbunt, F. 2003, ApJ, 591, L131
- Rozyczka et al. (2010) Rozyczka, M., Kaluzny, J., Pietrukowicz, P., Pych, W., Catelan, M., Contreras, C., & Thompson, I. B. 2010, ArXiv e-prints
- Schwarz et al. (2004) Schwarz, G. J., Barman, T., Silvestri, N., Szkody, P., Starrfield, S., Vanlandingham, K., & Wagner, R. M. 2004, PASP, 116, 1111
- Southworth et al. (2009) Southworth, J., Hickman, R. D. G., Marsh, T. R., Rebassa-Mansergas, A., Gänsicke, B. T., Copperwheat, C. M., & Rodríguez-Gil, P. 2009, A&A, 507, 929
- Strickler et al. (2009) Strickler, R. R., Cool, A. M., Anderson, J., Cohn, H. N., Lugger, P. M., & Serenelli, A. M. 2009, ApJ, 699, 40
- Taylor (2002) Taylor, J. M. 2002, Harvard University, undergraduate thesis
- Taylor et al. (2001) Taylor, J. M., Grindlay, J. E., Edmonds, P. D., & Cool, A. M. 2001, ApJ, 553, L169
- Warner (1995) Warner, B. 1995, Cataclysmic variable stars
- Wheatley et al. (2003) Wheatley, P. J., Mauche, C. W., & Mattei, J. A. 2003, MNRAS, 345, 49
| SourceaaFrom Bogdanov et al. (2010) | RA, Dec (J2000) | r (′)bbProjected distance from cluster center | Previous/New IDsccNew IDs are indicated by an asterisk; Previous CV IDs are from Grindlay (2006) and references therein; Prefix BY (Dra) IDs are from Taylor et al. (2001); Prefix V (variable) IDs are from Kaluzny & Thompson (2003) and Kaluzny et al. (2006) | Detect?dd1 = object detected in error circle; 0 = no object detected in error circle | Typeee CV = cataclysmic variable; CV? = less certain CV identification for reason noted in table; AB = active binary candidate; AB? = less certain AB identification for reason noted in table; MSP = millisecond pulsar; MS = main sequence; BS = blue straggler; AGN = active galactic nucleus; GLX = interacting galaxies | PM06ffProper-motion membership using 2006 second epoch: c = consistent with cluster; f = consistent with field; ? = unknown membership status from proper-motion data; = no proper-motion measurement | PM99ggProper-motion membership using 1999 second epoch. | H | Notes | ||
|---|---|---|---|---|---|---|---|---|---|---|---|
| U5 | 17:40:54.531 53:40:44.57 | 1.85 | V30 | 1 | AB? | ? | 18.73 | 19.23 | outside of field | ||
| U7 | 17:40:52.832 53:41:21.77 | 1.81 | CV10∗ | 1 | CV | c | 22.58 | 23.44 | 24.73 | ||
| U10 | 17:40:48.978 53:39:48.62 | 1.21 | CV6, V13 | 1 | CV | c | c | 19.14 | 20.34 | 21.53 | |
| U11 | 17:40:45.781 53:40:41.52 | 0.58 | CV7 | 1 | CV | ? | c | 23.65 | 24.26 | 25.88 | |
| U12 | 17:40:44.621 53:40:41.60 | 0.42 | BY-WF4-1, V16 | 1 | MSP | c | c | 16.25 | 17.43 | 18.99 | |
| U13 | 17:40:44.084 53:40:39.17 | 0.33 | CV8 | 1 | CV | ? | c | 24.00 | 24.33 | 25.95 | |
| U14 | 17:40:43.328 53:41:55.46 | 1.46 | V35 | 1 | AB | c | 18.31 | 19.72 | 20.96 | ||
| U15 | 17:40:42.910 53:40:33.81 | 0.14 | BY-PC-2 | 1 | AB | c | 17.25 | 18.53 | 19.93 | ||
| U16 | 17:40:42.636 53:42:15.24 | 1.78 | 1 | ? | ? | 25.83 | outside of and fields | ||||
| U17 | 17:40:42.651 53:40:19.30 | 0.17 | CV3, V33 | 1 | CV | c | c | 18.52 | 19.10 | 20.67 | |
| U18 | 17:40:42.606 53:40:27.62 | 0.07 | BY-PC-8, V31 | 1 | MSP | c | c | 16.10 | 17.51 | 18.73 | |
| U19 | 17:40:42.306 53:40:28.70 | 0.02 | CV2, V34 | 1 | CV | c | c | 18.87 | 20.02 | 21.03 | |
| U21 | 17:40:41.830 53:40:21.37 | 0.13 | CV4 | 1 | CV | c | c | 19.82 | 20.94 | 21.82 | |
| U22 | 17:40:41.701 53:40:29.00 | 0.07 | CV5 | 1 | CV | c | c | 20.15 | 21.50 | 22.04 | |
| U23 | 17:40:41.597 53:40:19.30 | 0.18 | CV1, V12 | 1 | CV | c | c | 17.88 | 18.93 | 20.25 | |
| U24 | 17:40:41.468 53:40:04.43 | 0.42 | 0? | qLMXB | hint of detection in only | ||||||
| U25 | 17:40:41.237 53:40:25.79 | 0.15 | CV13∗ | 1 | CV? | 23.48 | 23.44 | 26.01 | uncertain photometry | ||
| U28 | 17:40:38.904 53:39:51.09 | 0.79 | 1 | AGN | ? | 22.72 | 24.73 | 25.44 | |||
| U31 | 17:40:34.202 53:41:15.28 | 1.41 | CV11∗ | 1 | CV | f | 23.32 | 23.93 | 26.07 | ||
| U41 | 17:40:45.008 53:39:55.21 | 0.70 | 1 | MS | c | c | 16.74 | 17.69 | 19.50 | only object in error circle | |
| U42 | 17:40:43.059 53:38:31.29 | 1.96 | V26 | 1 | AB | ? | 15.52 | 17.47 | 18.20 | very red | |
| U43 | 17:40:40.543 53:40:22.79 | 0.26 | BY-PC-4 | 1 | AB | c | c | 17.68 | 19.03 | 20.38 | |
| U60 | 17:40:47.807 53:41:28.40 | 1.30 | CV9 | 1 | CV | c | c | 23.38 | 23.63 | 26.04 | |
| U61 | 17:40:45.223 53:40:28.60 | 0.45 | CV12∗ | 1 | CV? | ? | 22.08 | 23.19 | 24.19 | uncertain photometry | |
| U62 | 17:40:30.422 53:39:17.47 | 2.11 | 1 | AB? | 20.90 | 23.33 | 23.17 | uncertain photometry | |||
| U63 | 17:40:31.663 53:38:46.36 | 2.31 | 1 | AB? | 18.15 | 20.39 | 20.72 | very red, moderate H excess | |||
| U65 | 17:40:37.558 53:39:17.85 | 1.36 | 1 | AB? | ? | 18.72 | 21.27 | 21.11 | very red, large H excess | ||
| U66 | 17:40:38.918 53:38:49.80 | 1.71 | 1 | AB? | f | 21.93 | 24.56 | 24.29 | red, large H excess | ||
| U67 | 17:40:40.065 53:40:16.59 | 0.37 | 1 | AB | c | c | 19.34 | 21.17 | 22.00 | ||
| U68 | 17:40:40.730 53:38:32.63 | 1.95 | 1? | ? | marginal detection in only | ||||||
| U69 | 17:40:40.867 53:40:17.17 | 0.27 | BY-PC-5 | 1 | AB | c | c | 17.84 | 19.03 | 20.52 | |
| U70 | 17:40:41.693 53:40:33.33 | 0.11 | V20 | 1 | AB, BS | c | c | 15.50 | 16.21 | 18.30 | |
| U73 | 17:40:42.681 53:39:28.73 | 1.00 | 1 | AB | c | c | 18.19 | 19.47 | 20.88 | ||
| U75 | 17:40:43.666 53:40:30.61 | 0.22 | 1 | AB | c | 19.71 | 21.78 | 22.32 | |||
| U76 | 17:40:43.818 53:41:16.32 | 0.83 | V17 | 1 | AB | c | c | 15.81 | 16.81 | 18.57 | |
| U77 | 17:40:44.125 53:42:11.48 | 1.74 | V36 | 1 | AB? | 24.21 | outside of field | ||||
| U79 | 17:40:46.409 53:40:04.05 | 0.75 | 1 | AB | ? | 19.82 | 21.98 | 22.41 | |||
| U80 | 17:40:46.455 53:41:56.50 | 1.60 | CV14∗ | 1 | CV? | 25.40 | 25.84 | 27.91 | weak H detection | ||
| U81 | 17:40:46.481 53:41:15.44 | 1.01 | V14 | 1 | AB | c | c | 18.62 | 20.27 | 21.29 | |
| U82 | 17:40:48.537 53:39:39.53 | 1.25 | BY-WF2-1 | 1 | AB | c | 18.72 | 20.29 | 21.39 | ||
| U83 | 17:40:49.615 53:40:43.02 | 1.13 | CV15∗ | 1 | CV? | ? | ? | 26.22 | 27.18 | 28.56 | very faint |
| U84 | 17:40:54.807 53:40:19.79 | 1.88 | 1 | AB? | ? | ? | 17.27 | 18.23 | very red, outside of field | ||
| U86 | 17:40:37.473 53:41:47.24 | 1.48 | 1 | AB? | ? | 21.16 | 24.06 | 23.39 | very red, large H excess | ||
| U87 | 17:40:42.877 53:40:26.45 | 0.11 | BY-PC-3 | 1 | AB | c | c | 17.46 | 18.69 | 20.14 | |
| U88 | 17:40:42.863 53:40:23.43 | 0.13 | BY-PC-1, V19 | 1 | AB | c | c | 16.73 | 17.77 | 19.43 | |
| U89 | 17:40:43.613 53:40:24.60 | 0.23 | 1 | AB | c | c | 19.76 | 21.82 | 22.38 | ||
| U90 | 17:40:41.779 53:40:14.42 | 0.24 | BY-PC-6 | 1 | AB | c | c | 18.45 | 19.88 | 21.11 | |
| U91 | 17:40:42.430 53:40:41.65 | 0.22 | 1 | MS | c | 18.94 | 20.44 | 21.63 | only object in error circle | ||
| U92 | 17:40:43.916 53:40:35.39 | 0.28 | BY-WF4-2, V7 | 1 | AB? | c | c | 16.72 | 18.26 | 19.53 | very red, slight H deficit |
| U93 | 17:40:42.393 53:40:46.62 | 0.30 | 1 | ? | 24.95 | uncertain photometry | |||||
| U94 | 17:40:42.868 53:40:49.07 | 0.36 | 1 | AB | c | c | 18.88 | 20.58 | 21.53 | ||
| U95 | 17:40:40.320 53:40:44.58 | 0.38 | 1 | AB? | c | 20.81 | 23.02 | 23.41 | MS color, H excess | ||
| U96 | 17:40:39.097 53:40:23.09 | 0.47 | V24 | 1 | AB | c | 18.40 | 20.15 | 21.42 | ||
| U97 | 17:40:43.918 53:40:05.90 | 0.46 | 1 | ? | c | 20.90 | 22.88 | 23.56 | blue, normal H | ||
| U98 | 17:40:40.994 53:40:58.40 | 0.53 | 1 | AB | c | 19.18 | 21.09 | 21.82 | |||
| U99 | 17:40:46.431 53:40:30.40 | 0.63 | 1 | AB | c | 18.49 | 19.96 | 21.16 | |||
| U100 | 17:40:38.201 53:40:46.55 | 0.66 | 1 | AB | c | 20.81 | 23.14 | 23.40 | |||
| U101 | 17:40:45.399 53:41:01.40 | 0.73 | 1 | AB? | c | c | 18.48 | 19.94 | 21.19 | red, normal H | |
| U102 | 17:40:38.845 53:39:43.12 | 0.90 | 1 | AB | c | 21.27 | 23.80 | 23.87 | |||
| U103 | 17:40:35.698 53:40:12.56 | 1.00 | 1 | AB | c | 19.26 | 21.05 | 21.93 | |||
| U104 | 17:40:43.124 53:39:29.04 | 1.01 | 0 | empty error circle | |||||||
| U105 | 17:40:36.521 53:41:07.85 | 1.06 | 1 | AB | ? | 19.78 | 21.84 | 22.37 | |||
| U106 | 17:40:43.737 53:39:17.52 | 1.21 | 0 | empty error circle | |||||||
| U107 | 17:40:34.115 53:40:17.01 | 1.21 | 1 | AB | c | 19.61 | 21.63 | 22.23 | |||
| U108 | 17:40:52.099 53:39:48.25 | 1.62 | 1 | GLX? | extended object | ||||||
| U109 | 17:40:52.728 53:40:52.88 | 1.61 | 1 | AB? | c | c | 19.77 | 21.83 | 22.44 | red, normal H | |
| U110 | 17:40:33.455 53:39:16.83 | 1.76 | 1 | AB | c | 19.92 | 22.04 | 22.53 | |||
| U111 | 17:40:29.845 53:40:26.99 | 1.82 | 0 | empty error circle | |||||||
| U112 | 17:40:50.374 53:39:06.00 | 1.84 | 1 | MS | f | 19.60 | 21.25 | 22.29 | only object in error circle | ||
| U113 | 17:40:42.764 53:40:20.76 | 0.16 | 0 | empty error circle | |||||||
| U114 | 17:40:43.469 53:40:34.34 | 0.21 | 1 | ? | c | 19.49 | 22.10 | uncertain photometry | |||
| U116 | 17:40:42.236 53:40:19.97 | 0.18 | 1 | AB | c | c | 18.18 | 19.49 | 20.88 | ||
| U117 | 17:40:42.153 53:40:25.56 | 0.14 | 1 | AB | c | c | 16.82 | 17.84 | 19.55 | ||
| U118 | 17:40:41.576 53:40:15.88 | 0.05 | 1 | MSTO | c | c | 15.60 | 16.60 | 18.34 | only object in error circle | |
| U119 | 17:40:41.261 53:40:19.35 | 0.22 | 0 | empty error circle | |||||||
| U120 | 17:40:46.517 53:40:15.64 | 0.21 | 1 | AB? | ? | ? | 21.09 | 23.70 | 23.39 | moderately red, large Ha excess | |
| U121 | 17:40:33.631 53:39:34.96 | 0.68 | 0 | empty error circle | |||||||
| U122 | 17:40:47.903 53:39:24.83 | 1.55 | 0 | empty error circle | |||||||
| U123 | 17:40:49.621 53:38:45.93 | 2.04 | 0 | empty error circle |