Probing the ladder of dressed states and nonclassical light generation in quantum dot-cavity QED
Abstract
We investigate the photon induced tunneling phenomena in a photonic crystal cavity containing a strongly coupled quantum dot and describe how this tunneling can be used to generate photon states consisting mainly of a particular Fock state. Additionally, we study experimentally the photon-induced tunneling as a function of excitation laser power and frequency and show the signature of higher manifolds of the Jaynes-Cummings Hamiltonian in the observed photon-statistics.
A single optical mode confined inside an optical cavity behaves like a simple harmonic oscillator, where all the energy levels are equally spaced. When this cavity mode is strongly coupled to a two-level quantum emitter such as a quantum dot (QD), the energy structure of the coupled system becomes anharmonic. This anharmonic (Jaynes-Cummings) ladder has been recently probed in atomic Kubanek et al. (2008) and super-conducting Noda et al. (2009) cQED system. In addition, nonclassical correlations between photons transmitted through the cavity result from such anharmonicity, which in turn leads to fundamental phenomena of photon blockade and photon induced tunneling. These effects have been recently demonstrated in atomic systems Birnbaum et al. (2005), as well as solid-state Faraon et al. (2008). Moreover, photon blockade and photon-induced tunneling can be used for applications beyond cQED, including generation of single photons on demand Faraon et al. (2010) for quantum information processing, high precision sensing and metrology Afek et al. (2010), as well as quantum simulation of complex many-body systems Carusotto et al. (2009). In this Letter, we explore the utility of the photon induced tunneling and blockade for non-classical light generation and probing of higher order dressed states in the solid state cQED system consisting of a single quantum dot (QD) coupled to a photonic crystal cavity. First, we provide numerical simulation data showing that photon induced tunneling can be used to preferentially generate specific multi-photon states. Following this, we present experimental data demonstrating the transition from blockade to tunneling regime in such a system and show the signature of higher order dressed states observed in the measured photon statistics. The probing of the ladder of dressed states by photon-correlation measurement has previously been performed experimentally only in an atomic cavity QED system Kubanek et al. (2008), while in solid state systems it has been studied theoretically Laussy et al. (2011) and signatures of higher order dressed states were observed only using four wave mixing Kasprzak et al. (2010).
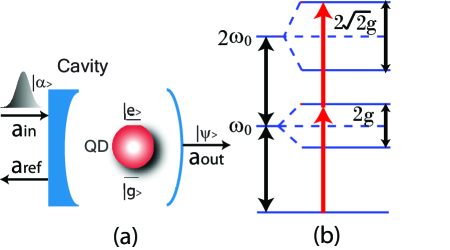
The dynamics of a coupled QD-cavity system, coherently driven by a laser field (Fig. 1 a), is well described by the Jaynes-Cummings Hamiltonian of the form
| (1) |
which assumes the rotating wave approximation (RWA) and a frame of reference rotating with the frequency of the laser field . Here, and are respectively the detunings of the laser from the QD resonant frequency and from the cavity resonance frequency , is the coherent coupling strength between the QD and the cavity mode, see the Supplementary Material is the slowly varying envelope of the coherent driving field with power incident onto the cavity with field decay rate , and is the annihilation operator for the cavity mode. If the excited and ground states of the QD are denoted by and then and . Two main loss mechanisms in this system are the cavity field decay rate ( is the quality factor of the resonator) and QD spontaneous emission rate . When the coupling strength is greater than and , the system is in the strong coupling regime Yoshie et al. (2004); Peter et al. (2005); Reithmaier et al. (2004). In this regime, energy eigenstates are grouped in two-level manifolds with eigen-energies given by (for ), where is the number of energy quanta in the coupled QD-cavity system (Fig. 1 b). The eigenstates can be written as:
| (2) |
Signatures of the photon blockade and tunneling can be detected through photon-statistics measurements, such as the second-order coherence function at time delay zero . is less (greater) than in photon blockade (tunneling) regime, signifying presence of single (multiple) photons in the light coming out of the coupled QD-cavity system. can be experimentally measured by Hanbury-Brown and Twiss (HBT) setup, where coincidences between the photons are detected Faraon et al. (2008). Another important statistical quantity is order differential correlation function , which provides a clearer measure of the probability to create photons at once in the cavity Kubanek et al. (2008). Second order differential correlation function can also be expressed as , where is the average intra-cavity photon number. Particularly for a weakly driven system (), becomes positive only when the probability of two-photon state becomes significant compared to that of a single-photon state, while a peak in indicates maximum probability of a two-photon state inside the cavity. As the driving power increases, the peak in shifts towards detunings corresponding to maximum probability of exciting higher manifolds, as described below and in the supplement.
Although the photon blockade and tunneling phenomena can be observed under continuous wave (CW) excitation in a numerical simulation see the Supplementary Material , for practical consideration it is important to analyze the response of the cavity-QD system to a pulsed driving field. In particular, the ability to measure the photon statistics of the system’s output during the actual experiment is determined by the time resolution capabilities of the single photon counters in the HBT setup, which in practice do not allow for measurement of a CW-driven cavity-QD system. A common way to overcome this limitation is to drive the strongly coupled cavity-QD system with a train of weak, coherent pulses of sufficiently narrow bandwidth Faraon et al. (2008). We use quantum trajectory method Carmichael (1993); Goto et al. (2005) to analyze the pulsed driving of the coupled QD-cavity system and find the resulting photon statistics Faraon et al. (2010). We also investigate the effect of pure QD dephasing Englund et al. (2010) on the photon statistics and observe that, even though the actual value of is affected due to dephasing, the qualitative nature of the spectrum remains same see the Supplementary Material . As the non-classical state is collected from the cavity, only the collapse operator corresponding to the cavity decay () is monitored. A histogram is calculated based on the photon counts in the cavity decay channel, and probability for having exactly photons in the system is found.
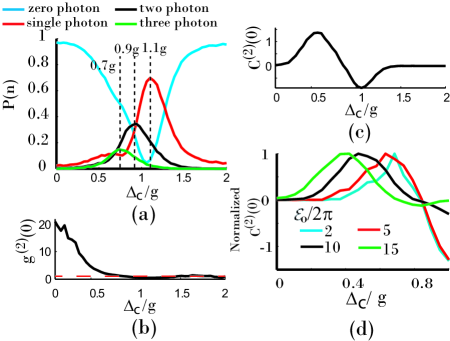
The driving term in the Hamiltonian described in Eqn. 1 is assumed to be of the form , where is the peak amplitude of the pulse. We set ps (i.e., full width at half maximum - FWHM of ps), which satisfies the narrow-band condition and corresponds to our experimental parameters.
Figure 2 shows the behavior of the system with better than current state of the art Tandaechanurat et al. (2011) but achievable experimental parameters (assuming QD dipole moment of Debye embedded in a linear three holes defect cavity with mode volume ) resulting in GHz and GHz . These parameters can be achieved by improving the alignment of the QD to the cavity field and optimizing the photonic-crystal cavity fabrication process to achieve higher quality factor. The results in Fig.2a show that such a cavity-QD system can be employed to deterministically generate selected Fock states of high purity at the cavity output, where the particular Fock state can be selected by adjusting the detuning of the drive laser from the bare cavity resonance (no pure QD dephasing is included in the simulation). The detuning values (, and ) are different from what one intuitively expects from a lossless strongly coupled QD-cavity system under CW driving (, and , corresponding to the excitation of first, second and third order manifold, respectively) because of both the losses and the pulsed driving of the system Faraon et al. (2008). We note that, in presence of pure QD dephasing, for photon states decreases see the Supplementary Material . From the probability distribution of the different Fock states we can find the wave-function of the overall photon state with , the second order coherence function and second order differential correlation function , which we can measure experimentally. Figure 2b shows as a function of , the laser detuning from the empty cavity. The dashed line indicates the expected for a coherent state. Figure 2c shows as a function of . transitions from negative to positive value with decreased detuning at , thanks to the excitation of the second manifold in the ladder when two photons are simultaneously coupled into the cavity-QD system. Fig. 2d shows as a function of for different laser excitation powers. We note that, the peak position changes depending on the excitation laser power and at lower driving power we observe the peak at , where the second order manifold is excited via two photons. With increasing power, the higher (third and more) manifolds starts being populated, and the peak in subsequently shifts to smaller values of detuning. In Fig.2c, the peak in is at a detuning of .
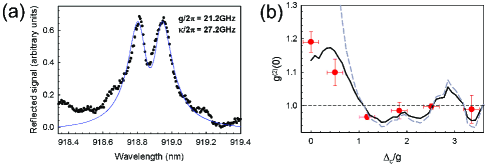
We confirm our theoretical predictions by performing experiment with InAs QDs coupled to a linear three hole defect GaAs photonic crystal cavity. Details of the fabrication and experimental setup can be found in Ref. Faraon et al. (2008). We measure laser transmission through the system (using a cross-polarized reflectivity setup Faraon et al. (2008)) and observe anti-crossing between the QD and cavity (by changing temperature) signifying the system is in the strong coupling regime. At resonance, the QD and cavity mix to generate two polaritons, seen as two Lorentzian peaks in Figure 3a. By fitting the spectrum at resonance we estimate the system parameters as GHz (corresponding to ) and GHz. To drive the cavity-QD system, we use a mode-locked Ti-Sapphire laser, that generates ps pulses at a repetition rate of MHz. These ps pulses are passed through a monochromator to elongate the pulse in time domain, which results in pulses with approximately Gaussian temporal profile of ps FWHM, corresponding to ps (as in our theoretical analysis). We determine the amplitude of the coherent driving field using see the Supplementary Material , where is the average optical power of the pulse train measured before the objective lens and Faraon et al. (2008) is the coupling efficiency of the incident light into the cavity including all the optics losses. For our experimental parameters, GHz. The second order auto-correlation is measured as a function of excitation laser frequency (Figure 3b) to observe transition from photon blockade to photon induced tunneling regime. Typical histograms obtained for blockade and tunneling are shown in the supplementary material. We estimate as the ratio of the coincidence counts at zero-time delay and non-zero time delay.
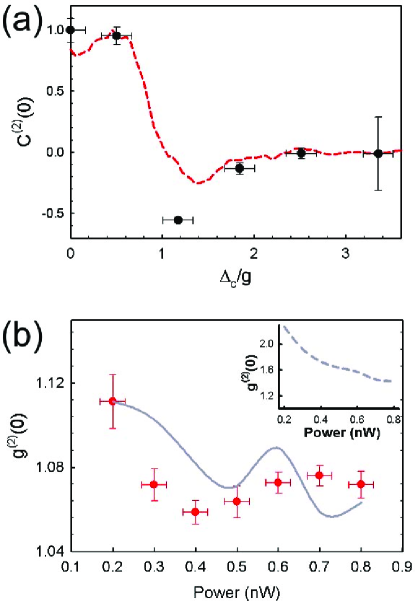
Following this we calculate the second order differential correlation function for the coupled-QD cavity system as a function of the laser-cavity detuning (Fig. 4a). We observe the transition of from negative to positive values and the onset of a peak at corresponding to the excitation of the higher order dressed states. Simulations with our system parameters are shown by the dashed line in Fig. 4 a). As explained before, the peak in does not correspond exactly to the resonant excitation of the second order manifold via two photon process, because of the additional excitation of the higher order manifolds. All the measurements are performed at K. We note that, in the simulation, in the tunneling regime is much larger than the experimentally measured value as a result of QD blinking, which causes the experimentally collected data to be a weighted average of transmission through an empty cavity and a cavity with strongly coupled QD; in other words, blinking effectively squashes the curve towards Faraon et al. (2008). We model the blinking behavior of the QD by assuming that during a unit time interval the QD is active for a fraction and inactive for of the time. Thus the measured in the experiment will be a statistical mixture of the coherent photon state (when QD is inactive, i.e., QD-cavity coupling ) and the correlated photons from the coupled QD-cavity system see the Supplementary Material . We obtain good fit to our experimental data with . The vertical error bars in all the figures are computed from the uncertainties in the fit of the histogram data sets. The horizontal error bars are given by the uncertainty in the measurement of the laser wavelength or the laser power.
Finally, Fig. 4 b shows as a function of excitation laser power in the tunneling regime (). This data is taken with the same cQED system on a different day, when the cavity is red-shifted compared to the previous measurements. For this particular experiment, the QD and the cavity are resonant at K. This slightly higher temperature might cause more QD dephasing, leading to a worse value of ( as opposed to from the previous measurement). Overall, decreases with increasing laser power as expected from the intuitive picture of QD saturation at high driving power and the numerical simulation. This clearly shows that the bunching observed in tunneling regime is coming solely from the quantum mechanical nature of the QD-cavity system, and not from any classical effect. We also observe interesting oscillatory behavior in as a function of power. An oscillatory behavior is also observed in the simulation that includes the effects of QD blinking. Without any QD blinking, the simulation results show a mostly monotonically decreasing with increasing laser power (inset of Fig. 4b).
Finally, we would like to point out that these measurements have been performed at the lowest nW that we can reliably use, corresponding to GHz. This roughly corresponds to the red plot in the theoretical Fig. 2d, where the peak in is near . This lower power limit is caused by the limited mechanical stability of the cryostat and the low overall efficiency with which we can couple the cavity photons into the single photon counters in our HBT setup. The time needed to perform the second-order coherence measurement increases quadratically with decreasing and for low powers the cavity drifts out of focus before we can collect sufficient number of coincidence counts.
In summary, we analyzed the photon induced tunneling regime in a coupled QD-cavity system and proposed a scheme to use this system for multi-photon state generation. In addition, we experimentally characterized the second order coherence function for a coupled QD-cavity system as a function of laser-cavity detuning and laser power. Using the experimental results of the photon statistics measurement, we find the signature of the higher order manifolds of the Jaynes-Cummings anharmonic ladder in the second order differential correlation function .
The authors acknowledge financial support provided by DARPA, ONR, NSF and the ARO; and useful discussion with Dr. Andrei Faraon. The authors also acknowledge Dr. Pierre Petroff and Dr. Hyochul Kim for providing the QD sample.
References
- Kubanek et al. (2008) A. Kubanek et al., Phys. Rev. Lett. 101, 203602 (2008).
- Noda et al. (2009) S. Noda, A. Chutinan, and M. Imada, Nature Physics 5, 105 (2009).
- Birnbaum et al. (2005) K. M. Birnbaum et al., Nature 436, 87 (2005).
- Faraon et al. (2008) A. Faraon et al., Nature Physics 4, 859 (2008).
- Faraon et al. (2010) A. Faraon et al., Phys. Rev. A 81, 033838 (2010).
- Afek et al. (2010) I. Afek et al., Science 32, 879 (2010).
- Carusotto et al. (2009) I. Carusotto et al., Phys. Rev. Lett. 103, 033601 (2009).
- Laussy et al. (2011) F. P. Laussy et al., arXiv:1104.3564v2 (2011).
- Kasprzak et al. (2010) J. Kasprzak et al., Nature Materials 9, 304 (2010).
- (10) see the Supplementary Material.
- Yoshie et al. (2004) T. Yoshie et al., Nature 432, 200 (2004).
- Peter et al. (2005) E. Peter et al., Phys. Rev. Lett. 95, 067401 (2005).
- Reithmaier et al. (2004) J. P. Reithmaier et al., Nature 432, 197 (2004).
- Carmichael (1993) H. Carmichael, ed., An Open Systems Approach to Quantum Optics (Springer, Berlin, 1993).
- Goto et al. (2005) H. Goto et al., Phys. Rev. A 72, 054301 (2005).
- Englund et al. (2010) D. Englund et al., Phys. Rev. Lett. 104, 073904 (2010).
- Tandaechanurat et al. (2011) A. Tandaechanurat et al., Nature Photonics 5, 91 (2011).