11email: sibilla.perina2@unibo.it
HST/ACS color-magnitude diagrams of candidate intermediate-age M 31 globular clusters. ††thanks: Based on observations made with the NASA/ESA Hubble Space Telescope, obtained from the data archive at the Space Telescope Science Institute. STScI is operated by the Association of Universities for Research in Astronomy, Inc., under NASA contract NAS 5-26555. These observations are associated with program GO-10631 [P.I.: T. Puzia]. ,††thanks: Photometric catalogs are available in electronic form at the CDS via anonymous ftp to cdsarc.u-strasbg.fr (130.79.128.5) or via http://cdsweb.u-strasbg.fr/cgi-bin/qcat?J/A+A/ and at http://www.bo.astro.it/M31/hstcatalog/
We present deep () BV photometry obtained with the wide field channel of the Advanced Camera for Surveys on board HST for four M31 globular clusters that were identified as candidate intermediate-age (age Gyr) by various authors, based on their integrated spectra and/or broad/intermediate-band colors. Two of them (B292 and B350) display an obvious blue horizontal branch, indicating that they are as old as the oldest Galactic globulars. On the other hand, for the other two (B058 and B337), which display red horizontal branches, it was not possible either to confirm or disconfirm the age estimate from integrated spectra. The analysis of the distribution in the spectral indices Mg2 and H of the M31 and Milky Way clusters whose horizontal branch can be classified as red or blue based on existing CMDs, strongly suggests that classical age diagnostics from integrated spectra may be significantly influenced by the HB morphology of the clusters and can lead to erroneous age-classifications. We also provide the CMD for another two clusters that fall into the field of the main targets, B336, an old and metal-poor globular with a significant population of RR Lyrae variables, and the newly discovered B531, a cluster with a very red red giant branch.
Key Words.:
galaxies:individual:M31 – galaxies:star clusters – star clusters: catalog — star clusters: photometry1 Introduction
Nearly all types of galaxies contain globular clusters (GC), from dwarfs to giants and from the earliest to the latest types. Our most in-depth understanding of individual GCs comes from studies of the Milky Way (MW; see, for example, Dotter et al. dotter (2010) and references therein).
Among the external galaxies, M31 plays a special role in our studying of GCs. It is our nearest bright spiral galaxy neighbor, it is the most prominent member in the Local Group (LG), and it hosts the largest population of GCs: 544 confirmed GCs are listed in the latest version of the Revised Bologna Catalog111http://www.bo.astro.it/M31/ (RBC v4.0, Galleti et al. rbc (2004)). At the distance of M31 ( kpc, from McConnachie et al. mcc05 (2005)), GCs have almost stellar appearance (10 pc correspond to ), hence the diagnostics based on integrated light that are used for more distant galaxies can be homogeneously applied here. On the other hand, M31 is also close enough that individual stars in GCs can be resolved and measured with the Hubble Space Telescope (HST). In this framework, the GCs system of M31 is a fundamental test bed for checking the consistency between the cluster parameters (in particular age and metallicity) derived from the integrated light and those obtained from the analysis of the color-magnitude diagram (CMD) of individual cluster stars.
The most powerful method to determine cluster ages relies on the accurate location of the main-sequence turn-off (MSTO) point (Renzini & Fusi Pecci rfp (1988)). Unfortunately, this method is limited to the nearest GCs where individual stars can be resolved and measured down to at least 1-2 magnitudes fainter than the MSTO. At the distance of M31 the task is made very challenging owing to the effects of crowding and the intrinsic faintness of the feature. At present only one of M31’s GC has a CMD down to the TO, which has been achieved only with 3.5 days of HST/ACS integration time (B379; Brown et al. brown04 (2004))222It is interesting to note that B379 was found by Brown et al.( brown04 (2004)) to be 2-3 Gyr younger than Galactic GCs of the same metallicity, with an absolute age of Gyr. Re-analyzing the same data and using different stellar models, Ma et al. (ma10 (2010)) estimated an age of Gyr..
In general, typical CMDs of M31 GCs obtained by HST data barely reach the base of the red giant branch (RGB), including most horizontal branch (HB) stars, except the bluest/faintest ones, when present (Ajhar et al. ajh96 (1996); Rich et al. ric96a (1996); Fusi Pecci et al. fp96 (1996); Holland et al. holl97 (1997); Jablonka et al. jab00 (2000); Meylan et al. mey01 (2001); Rich et al. rich05 (2005); Perina et al. 2009b ; Huxor et al. hux04 (2004, 2005, 2008); Galleti et al. b514 (2006); Mackey et al. mack06 (2006, 2007)). In this magnitude range the HB morphology can be used as a rough age indicator, because the presence of RR Lyrae variables and/or blue HB stars implies low-mass progenitors, hence old ages. In a recent analysis, Dotter et al.( dotter (2010)) conclude that all Galactic GCs with a blue horizontal branch have ages Gyr, on a scale in which the oldest GC is gyr old.
To date, there are relatively few M31 GCs with a CMD (44). As a consequence, our overall characterization of the GC system of that galaxy mainly relies on the analysis of integrated colors and spectra (see Galleti et al. rbc (2004); Puzia et al. puzia (2005); Caldwell et al. C09 (2009), C11 (2011), and references therein). A widely used technique is based on Lick spectral indices (Burstein et al. lick1 (1984); Faber et al. lick2 (1985); Worthey worthey (1994)). Typically, indices that are mainly sensitive to age (, ) are used in combination with others that are more sensitive to metallicity (Mgb, [MgFe]), attempting to break the well-known age-metallicity degeneracy. At fixed metallicity, stronger Balmer lines indicate a hotter MSTO, hence younger ages (see for example Puzia et al. puzia (2005) and Caldwell et al. C09 (2009), C11 (2011)). Another widely used method to age-date extragalactic star clusters relies on multi-band photometry: the age can be derived from the spectral energy distributions (SED) measured in broad-band photometric systems, by comparing them with simple stellar population (SSP333A simple stellar population is an ideal population of stars that have the same age and chemical composition (Renzini & Fusi Pecci rfp (1988)).) synthesis models (e.g. Jiang et al. jiang03 (2003); Fan et al. fan06 (2006, 2008, 2010); Ma et al. ma07 (2007, 2009); and Wang et al. wang10 (2010)). Clearly, photometry-based technique are prone to errors owing to the uncertainty in the interstellar extinction, while spectral indices are virtually free from this effect.
In a recent analysis adopting the most up-to-date theoretical tools and methodology, Puzia et al. (puzia (2005); P05 hereafter) derived spectroscopic ages, metallicities and ratios for 70 GCs in M31 based on Lick indices. Within this sample, the authors find a population of 20 GCs with ages between and 9 Gyr and mean metallicity of . Independently, Burstein et al. (burst04 (2004)) and Beasley et al. (beas05 (2005)) also claimed to have found two (B232 and B311) and six (B126, B292, B301, B337, NB16, NB67) candidate intermediate-age GCs in M31444It is interesting to note that Beasley et al. (beas05 (2005)) find remarkably different age estimates from the same data, depending on the set of theoretical models they compare with. In particular, ages obtained by comparison with the Bruzual & Charlot (bc03 (2003)) models are systematically lower than those derived from the comparison with Thomas et al. (thomas03 (2003)) ones (see Table 2, below)., respectively, in common with Puzia’s sample. The presence of a population of intermediate-age GCs in M31 was also supported by other spectrophotometric analyses (Fan et al. fan10 (2010); Wang et al. wang10 (2010) and reference therein; see Table 2).
On the other hand, Strader et al. (strad09 (2009)) showed that three of the candidate intermediate-age M31 GCs studied by P05, Burstein et al. (burst04 (2004)), and Beasley et al. (beas05 (2005)) have and colors typical of old GCs. Twelve of the spectroscopically identified intermediate-age GC candidates were also detected by Rey et al. (rey07 (2007)) in far-ultraviolet (FUV) and/or near-ultraviolet (NUV) GALEX images. From the comparison of their UV photometry with theoretical models these authors concluded that most of these spectroscopically identified intermediate-age clusters may in fact be classical old GCs with many blue HB stars. These hot stars would contribute to enhance the UV flux as well as the strength of Balmer lines, thus mimicking younger ages. A possible example is provided by the cluster B311, reported to be 5 Gyr old by Burstein et al. (burst04 (2004)), that reveals an extended HB in the CMD presented by Rich et al. (rich05 (2005)), clearly not consistent with such a young age. Therefore, deep HST imaging of intermediate-age GCs candidates is crucial to check if they are genuinely intermediate-age or, instead, old clusters with blue HB. The presence of bright intermediate-age clusters in M31, if confirmed, would be especially interesting because these objects are not observed in our own Galaxy, possibly implying a significant difference in the star- (or, at least, cluster) formation history between the two galaxies.
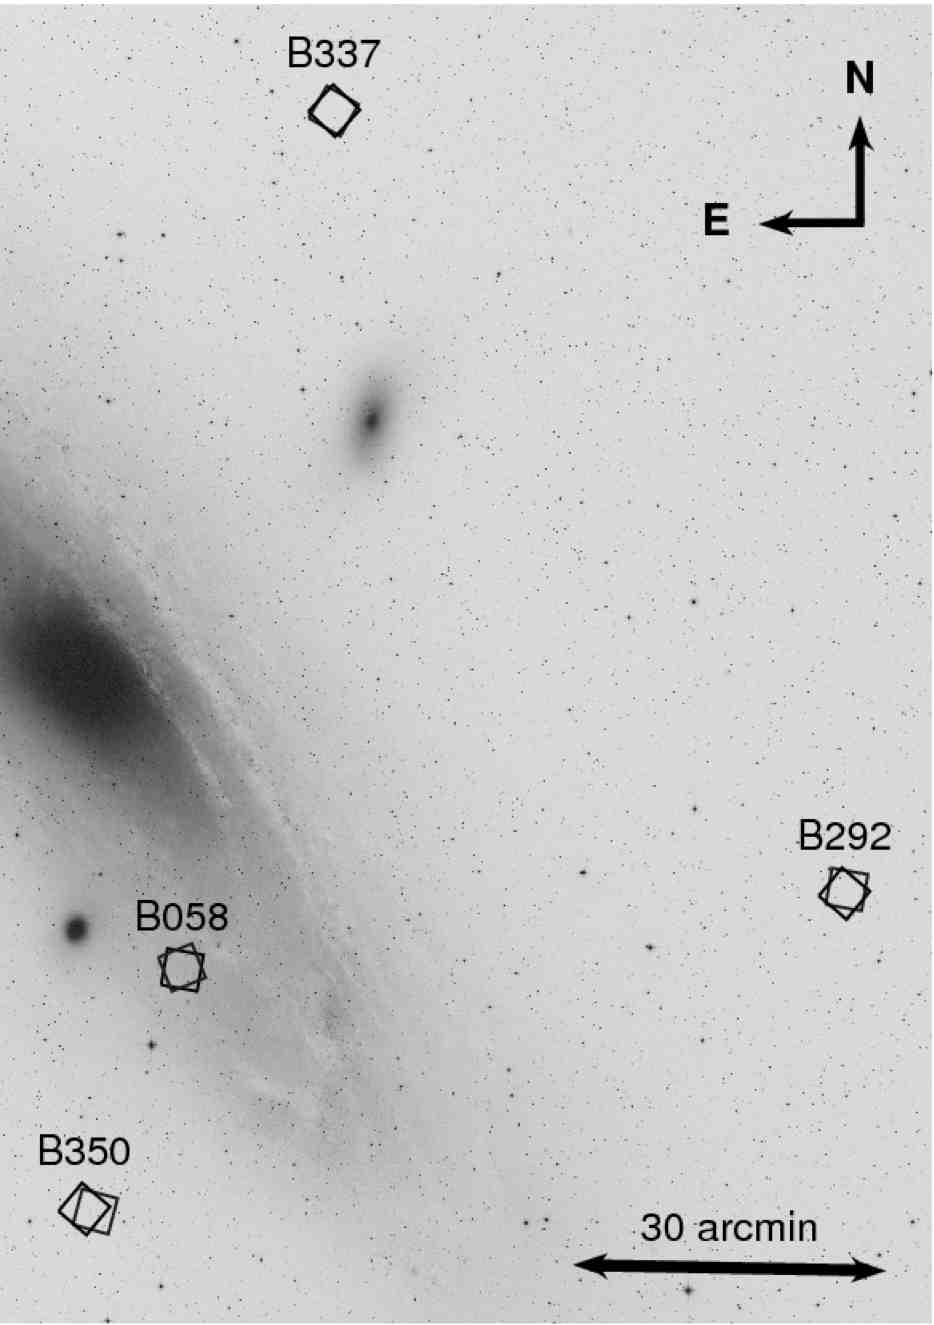
In HST cycle 14 deep ACS/WFC imaging was acquired of four M31 GCs, which were identified by P05 as candidate intermediate-age cluster. In this paper we present the CMDs of the four main targets of this observational program, discussing the compatibility with the parameters obtained by P05 from the integrated spectroscopy (see Tables 2 and 3). We also present the CMDs for two other GCs that were in the target fields in both passbands: B336 and the newly detected cluster B531. Finally, we provide firmer classification for three additional objects listed in the RBC that were imaged only in one passband.
In Sect. 2 we describe the HST/ACS data, the adopted reduction procedure, the photometric uncertainties and the completeness of the data. Sect. 3 is devoted to describe the CMDs of the individual clusters, the field-decontamination procedure, and the method we used to estimate the metallicity, reddening, and distance. In Sect. 4 we describe the method for searching variable stars and the results for the individual clusters. Finally, Sect. 5 is dedicated to the discussion of the results and conclusions.
| ID | RA (J2000) | Dec (J2000) | Vint | E(B-V)∗ |
|---|---|---|---|---|
| B058-G119 | 00 41 53.01 | +40 47 08.6 | 14.97 | 0.130.01a |
| B292-G010 | 00 36 16.59 | +40 58 26.6 | 16.99 | 0.13b |
| B337-G068 | 00 40 48.45 | +42 12 11.5 | 16.73 | 0.060.02 |
| B350-G162 | 00 42 28.33 | +40 24 50.2 | 16.74 | 0.100.02 |
The integrated apparent magnitudes of the clusters (Vint) are taken from RBC V4.0 (Galleti et al.rbc (2004)). ∗ from Fan et al. (fan08 (2008)). a Rich et al. (rich05 (2005)) find E(B-V)=0.12 for this cluster. b from Caldwell et al. (C11 (2011)). These authors provided reddening estimates also for the other clusters, in particular E(B-V)= 0.15, 0.10, and 0.12, for B058, B337, and B350, respectively (uncertainties not reported).
2 Observations and data reduction
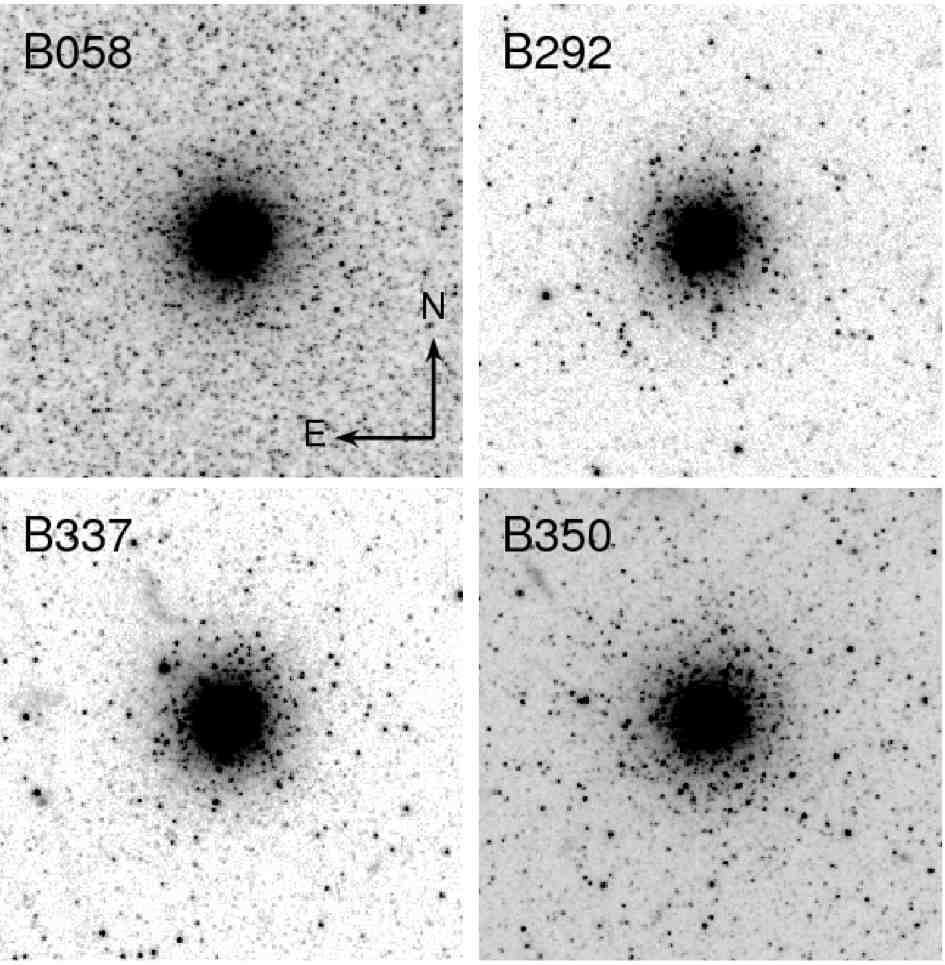
The four main targets are the clusters B058, B292, B337, and B350. They were selected from Table A.3 of P05 as candidate intermediate-age GCs.The observations were performed under program GO-10631 (P.I.: Thomas Puzia), using the ACS on board HST, and the filters F435W (similar to Johnson B; four images with a total exposition time of 4800 sec for B058, and 4900 sec for the other three targets) and F606W (similar to Johnson V; six images with a total exposition time of 7500 sec for each target). Fig. 1 shows the location of the four target fields on the body of M31. In Table 1 we give the basic parameters of the target clusters. Their images in the F606W band are shown in Fig. 2.
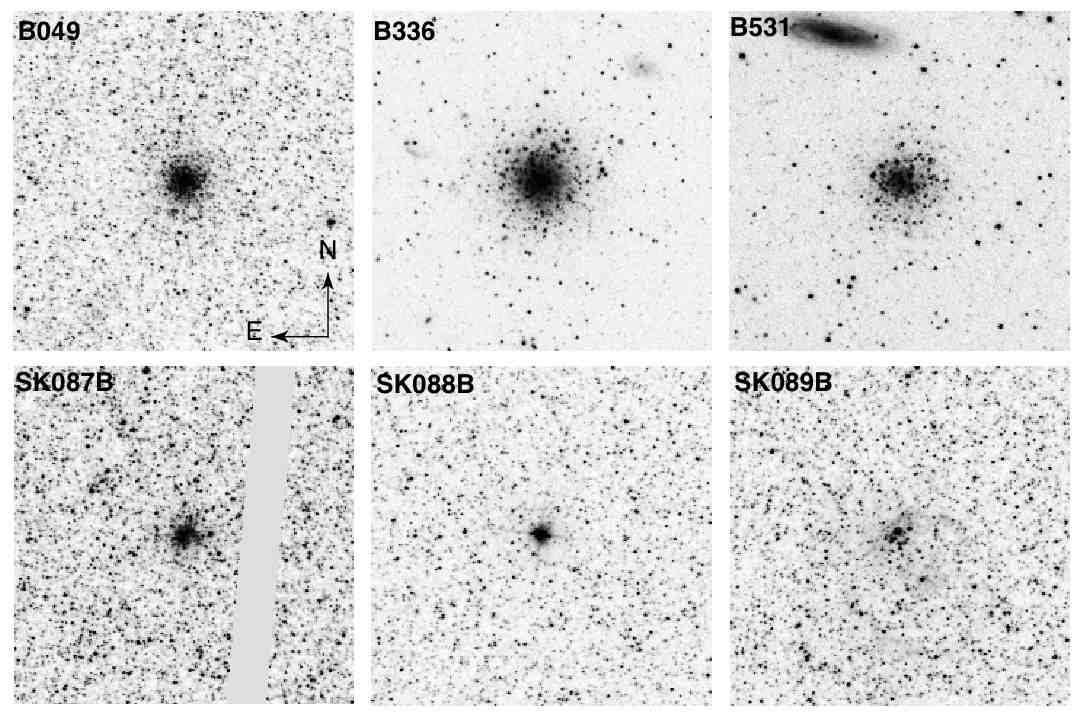
The pointings were arranged to contain as many clusters or candidate clusters as possible because other confirmed or candidate GCs are present in the proximity of the targets. This optimized the scientific output of the images. For the fields with multiple objects, orientation requirements were set to guarantee the best coverage of all targets, and additional orientational constraints were added to the B292 pointing to avoid a bright star in the field of view. The field of B058 also contains B049 (already studied in Perina et al. 2009b); the field of B337 also contains B336 and in the field of B292 we discovered a new cluster that was never detected before (dubbed B531, according to the RBC nomenclature). For these clusters it was possible to obtain meaningful CMD that are presented and discussed below. In the field of B058 we identified another three candidate GCs listed in the RBC (SK087B, SK088B, SK089B). These are faint and very compact objects for which we provide only a re-classification based on visual inspection of the ACS images. In Table 4 are listed some basic parameters of these additional objects, and their images in the F606W band are shown in Fig. 3.
The data reduction was performed in the same way as in Perina et al. (2009b ; P09b hereafter) on the pre-reduced images provided by STScI, using the ACS module of DOLPHOT 555See http://purcell.as.arizona.edu/dolphot/. (Dolphin 2000a ), a point-spread function fitting package specifically devoted to stellar photometry from HST images. The package identifies the sources above a fixed flux threshold on a stacked image and performs the photometry on individual frames, accounts for the hot-pixel and cosmic-ray masking information attached to the observational material, automatically applies the correction for the charge transfer efficiency (CTE, Dolphin 2000b ) and transforms instrumental magnitude to the VEGAMAG and standard BVI system using the transformations by Sirianni et al. (siria (2005)).
| ID | AGE [Gyr]a | ||||
|---|---|---|---|---|---|
| P05 | Be05+BC03 | Be05+T03 | W10 | F10 | |
| B058-G119 | 6.44.1 | 2.020.10 | 4.0001.325 | ||
| B292-G010 | 9.23.3 | 2.71.2 | 5.93.4 | 1.000.10 | 0.0030.000 |
| B337-G068 | 4.92.9 | 2.61.9 | 6.63.2 | 2.030.10 | 1.9000.360 |
| B350-G162 | 9.32.3 | 9.82.5 | 12.44.7 | 1.990.10 | 1.2780.148 |
(a) Ages from Puzia et al. (puzia (2005); P05); Beasley et al. (beas05 (2005); Be05); Wang et al. (wang10 (2010); W10); Fan et al. (fan10 (2010); F10). Beasley et al. (beas05 (2005) derived two set of age estimates by comparing the same spectra with two different sets of SPSS models by Bruzual & Charlot (bc03 (2003); BC03) and Thomas et al. (thomas03 (2003); T03); we report both estimates in this table. Caldwell et al. (C11 (2011)) do not provide an age estimate for these clusters, but assign a conventional value of 14 Gyr to all of them.
| ID | [Fe/H]a | [/Fe] | ||||
|---|---|---|---|---|---|---|
| P05∗ | G09 | C11 | B00 | F10 | P05 | |
| B058-G119c | -0.250.17 | -1.020.21 | -1.050.11 | -1.450.24b | -0.9160.099 | -0.340.15 |
| B292-G010 | -1.630.49 | -1.540.37 | … | -1.420.16 | -2.2490.043 | 0.110.31 |
| B337-G068 | -0.590.11 | -1.080.15 | -1.170.14 | -1.090.32 | -0.4330.113 | 0.000.11 |
| B350-G162 | -1.810.37 | -1.540.31 | -1.430.13 | -1.470.17 | -1.0290.127 | 0.380.28 |
(a) [Fe/H] from Puzia et al. (puzia (2005); P05); Galleti et al. (G09 (2009); G09); Caldwell et al. (C11 (2011); C11); Barmby et al. (barm00 (2000); B00); Fan et al. (fan10 (2010); F10).
(b) from Huchra et al. (huch91 (1991)).
(c) Rich et al. (rich05 (2005)) provides a CMD-based estimate of for the cluster B058.
(∗) Trasformed from [Z/H] with the formula of Thomas, Maraston & Bender (thomas03 (2003)).
We fixed the threshold for the search of sources on the images at 3 above the background. DOLPHOT provides as output the magnitudes and positions of the detected sources as well as a number of quality parameters for a suitable sample selection, with regard to of the actual scientific objective one has in mind.
Owing to the adopted peculiar pointing strategy described above, we were forced to reduce the F435W and F606W frames of each cluster independently. The output positions were corrected for the ACS geometrical distortions and the F435W and F606W were then cross-correlated to match common sources666The match was performed with CataXcorr, a code aimed at cross-correlating catalogs and finding astrometric solutions, developed by P. Montegriffo at INAF - Osservatorio Astronomico di Bologna, and successfully used by our group for the past 10 years.. This non-standard procedure prevented the DOLPHOT routine from calculating the required color term to perform the transformations from instrumental magnitudes to standard B,V magnitudes automatically; we made this final passage a-posteriori with the transformations by Sirianni et al. (siria (2005)). Below we will always consider only the photometry in the Johnson B,V passbands. Similarly to P09b, we retained in our final catalogs all the sources with valid magnitude measurements in both passbands, global quality flag = 1 (i.e., best measured stars), crowding parameter , , and sharpness parameter between -0.3 and 0.3 (see Dolphin 2000b for details on the meaning of the various quality parameters). This selection cleans the sample from the majority of spurious and/or bad measured sources without significant loss of information and was found to be appropriate for the whole data set.
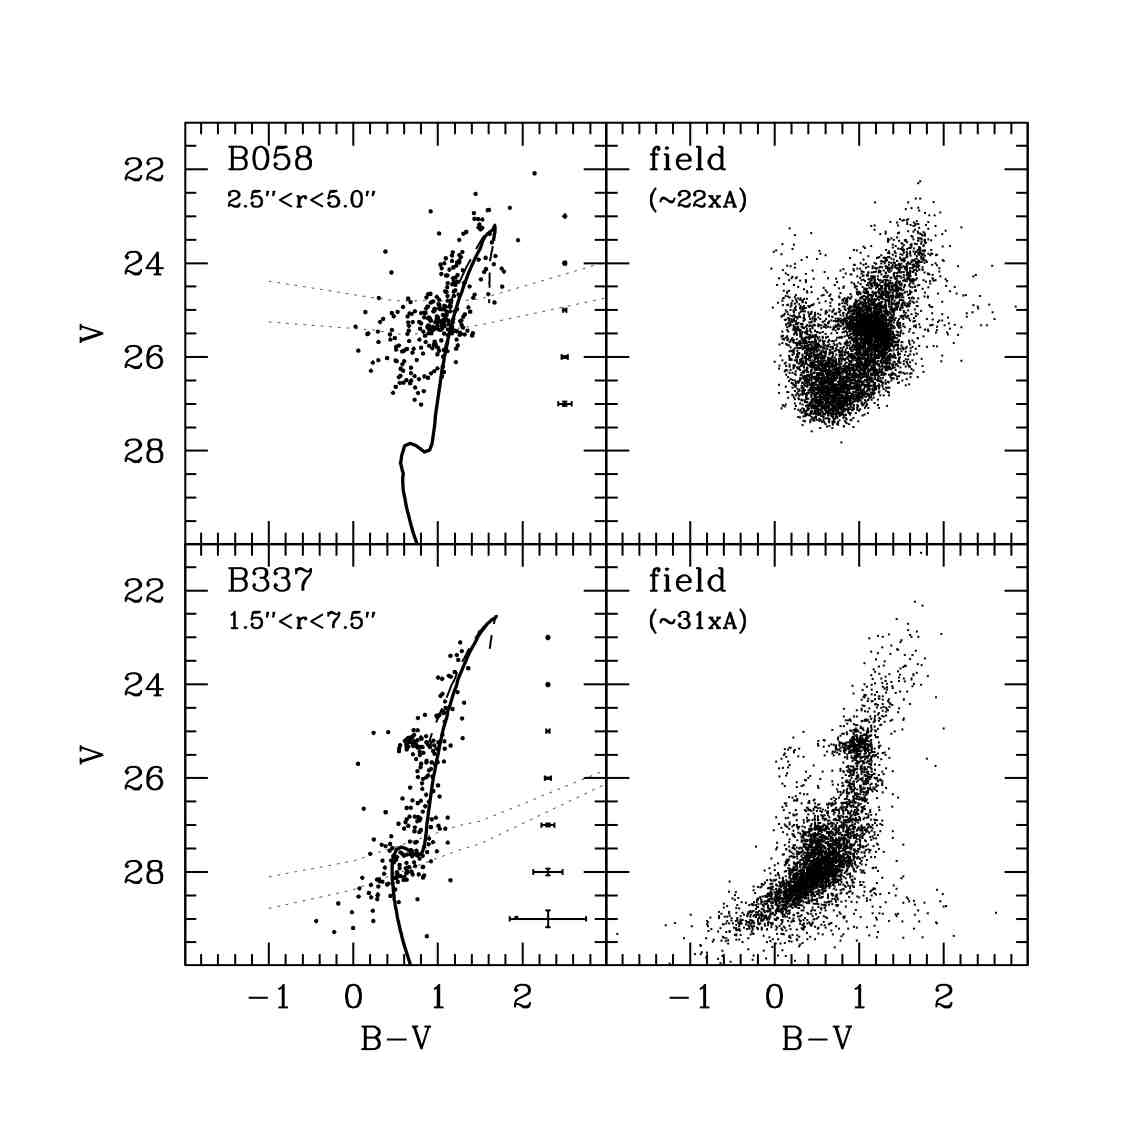
The limiting magnitudes of our photometry range from V27.0 for the field of B058, which is projected onto a much more crowded background compared to the other clusters (see Figs. 1 and 2), to V29.0 for the other fields. The internal photometric errors of individual measures are in the range 0.005 - 0.08 mag for stars brighter than V=27 (see the error bars in Figs. 4, 5, and 6).
2.1 Artificial stars experiments
We performed artificial stars experiments (generating fake stars per field) to study in detail the completeness of the samples as a function of magnitude, color, and distance from the cluster’s center (i.e., as a function of crowding), using the automated procedure included in DOLPHOT (see P09b for details).
The fields of B292, B336, and B350 all have completeness 80% for V27, more than sufficient to detect a blue HB where it is present. On the other hand, the TO stars are located in a CMD region in which the completeness is less then 50%, which prevents us from reaching any suitable conclusion from this CMD feature. The field of B058 is projected onto the so-called 10 kpc ring, a site of ongoing star formation in the thin disk of M31 where the stellar density (and then the crowding) is much higher, conseguently the completeness is significantly worse (80% for V24.5) and barely reaches the level of the red HB.
2.2 Classification of secondary targets
The CMD of the secondary target B049 obtained from these data is very similar to that already published and discussed in P09b, which was obtained from a different dataset; we refer the interested reader to this previous publication for details.
SK087B is the faintest object in our sample and is located in the dense disk field of B058. The CMD of the stars located within a radius of appears to be indistinguishable from that of the surrounding field and the same stars do not show any over-density with respect to the field. For these reasons re-classified this object as an asterism. The high-resolution ACS images clearly reveals that SK088B is not a genuine cluster but a bright star, instead. SK089B is imaged only on the frame F606W, so we cannot provide its CMD, however, it appears to be an OB association in the proximity of its dust cocoon. We maintained the classification of this object.
| ID | RA (J2000) | Dec (J2000) | Vint | E(B-V)∗ | type∗∗ |
|---|---|---|---|---|---|
| B049 | 00 41 45.6 | +40 49 53.7 | 17.56 | 0.160.02 | 1(1) |
| SK087B | 00 41 48.2 | +40 47 31.5 | 18.83 | 7(2) | |
| SK088B | 00 41 51.5 | +40 47 06.6 | 16.98 | 6(2) | |
| SK089B | 00 41 54.7 | +40 47 14.6 | 18.57 | 2(2) | |
| B531 | 00 36 14.7 | +40 57 56.6 | 19.63⋆ | 1 | |
| B336 | 00 40 47.6 | +42 08 41.4 | 17.81 | 0.420.04 | 1(1) |
Vint from the RBC. ∗ from Fan et al.( fan08 (2008, 2010)). Caldwell et al. (C11 (2011)) reported E(B-V)= 0.32 and 0.05 for B049 and B336, respectively. ∗∗: RBC Classification flag: 1- confirmed cluster; 2- gc candidate; 6- star; 7- asterism. The classification reported in the RBC before this study are enclosed in parentheses. ⋆ See Sect. 3.2.6.
3 The CMDs
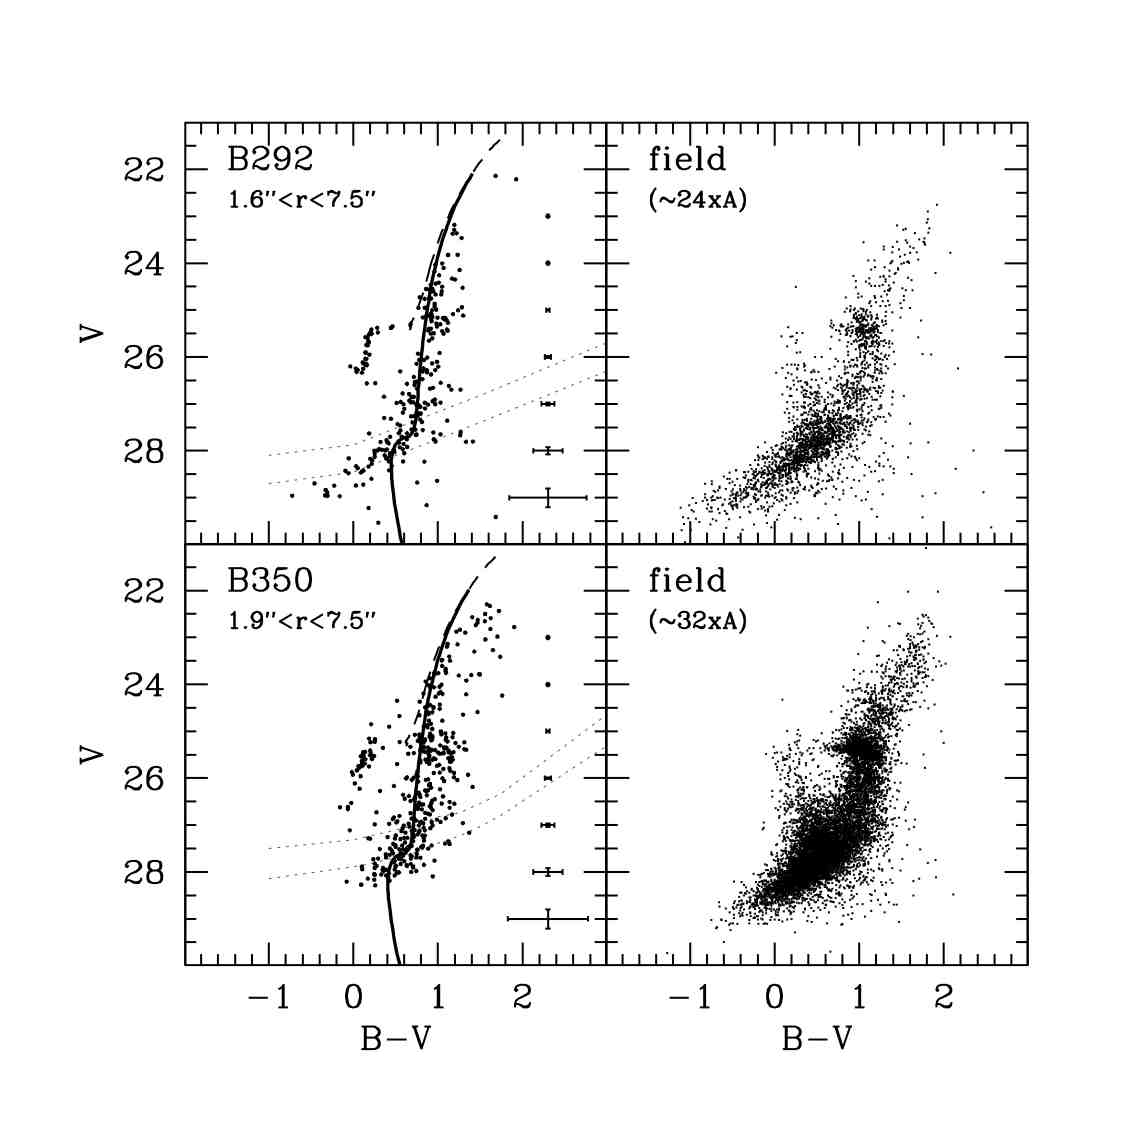
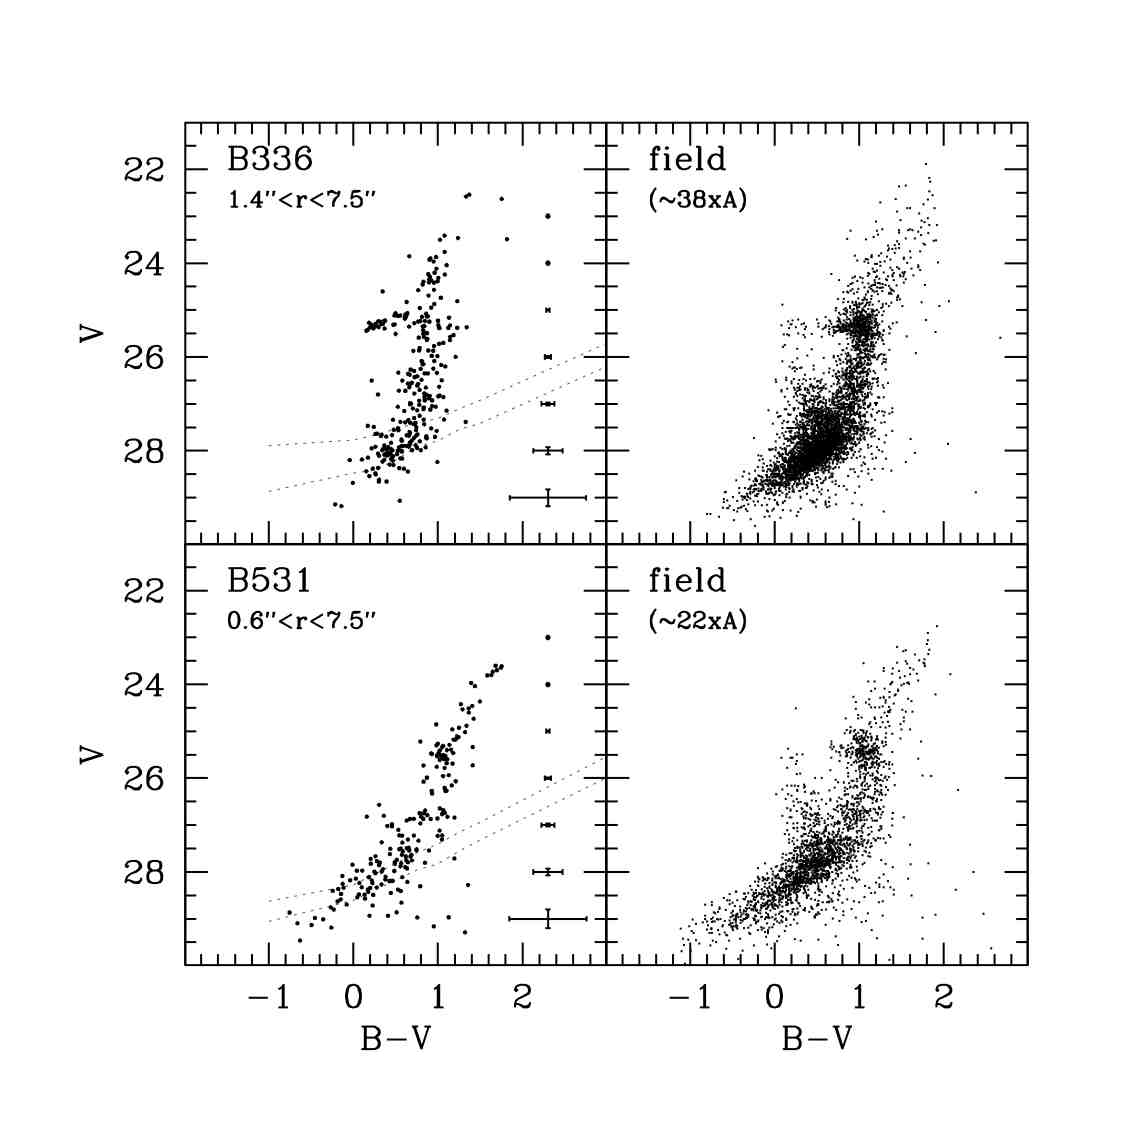
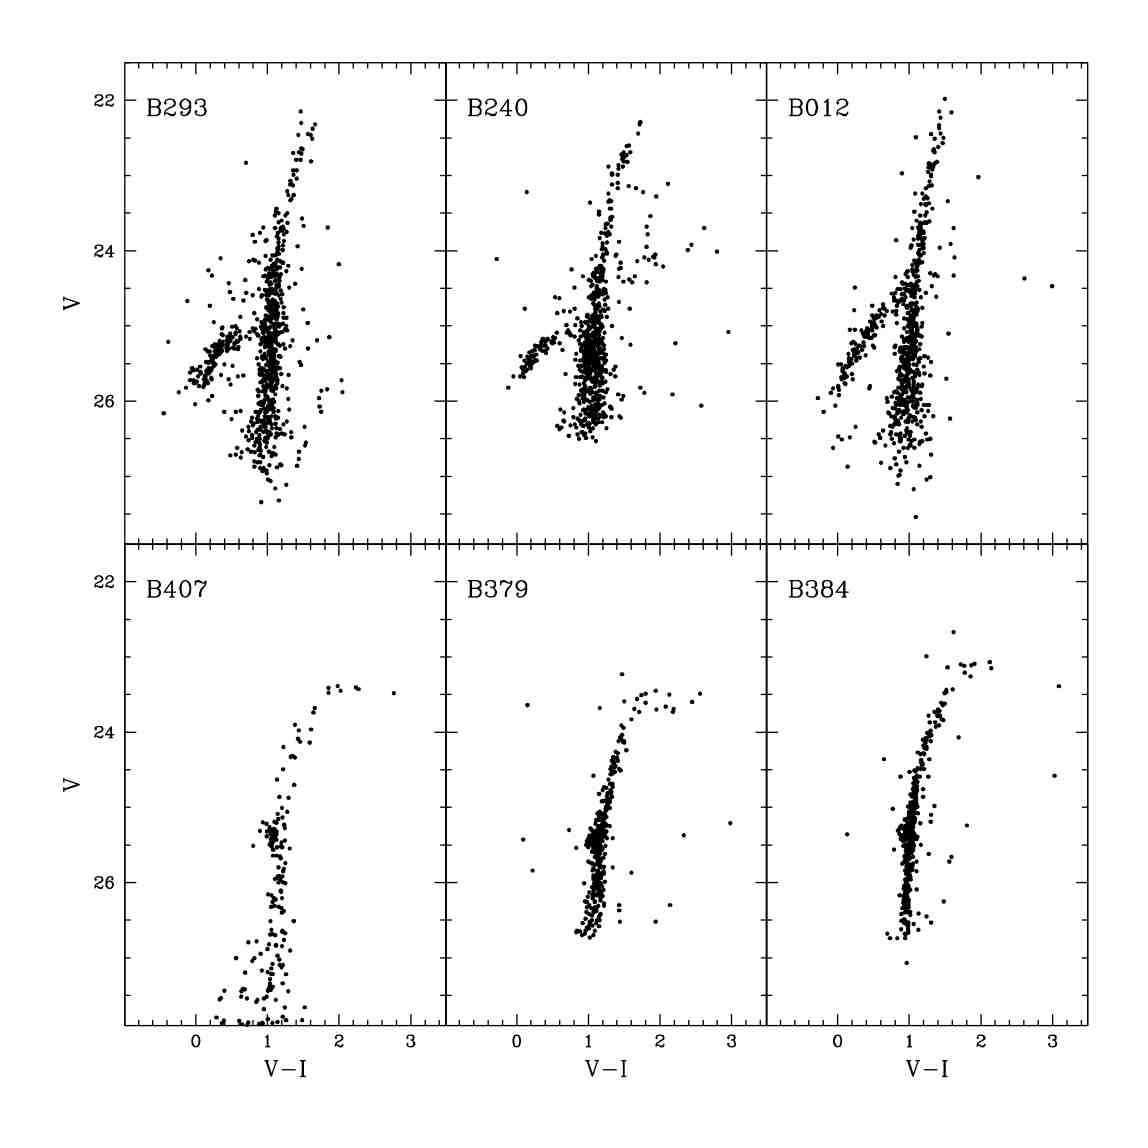
Below we present and discuss the CMDs of the four main target clusters, of the secondary target cluster B336 and of the newly detected cluster B531. The individual CMDs are shown in Figs. 4, 5 (target clusters), and 6 (secondary clusters). The cluster CMDs shown in the left panels sample the stellar population within an annulus around the cluster center. The inner limit of the annulus is set by the crowding level at the center, which prevents us from performing useful photometry in the most central region of the cluster, the outer limit is set by the need to avoid strong contamination by the surrounding field population. The inner and outer radii of the adopted annuli are indicated for each cluster. In the right panels we plot the CMD of the field adjacent to each cluster. The field population is sampled over a wide region outside the outer limit of the cluster and the area of the considered field is reported in units of the area of the annulus enclosing the cluster stars.
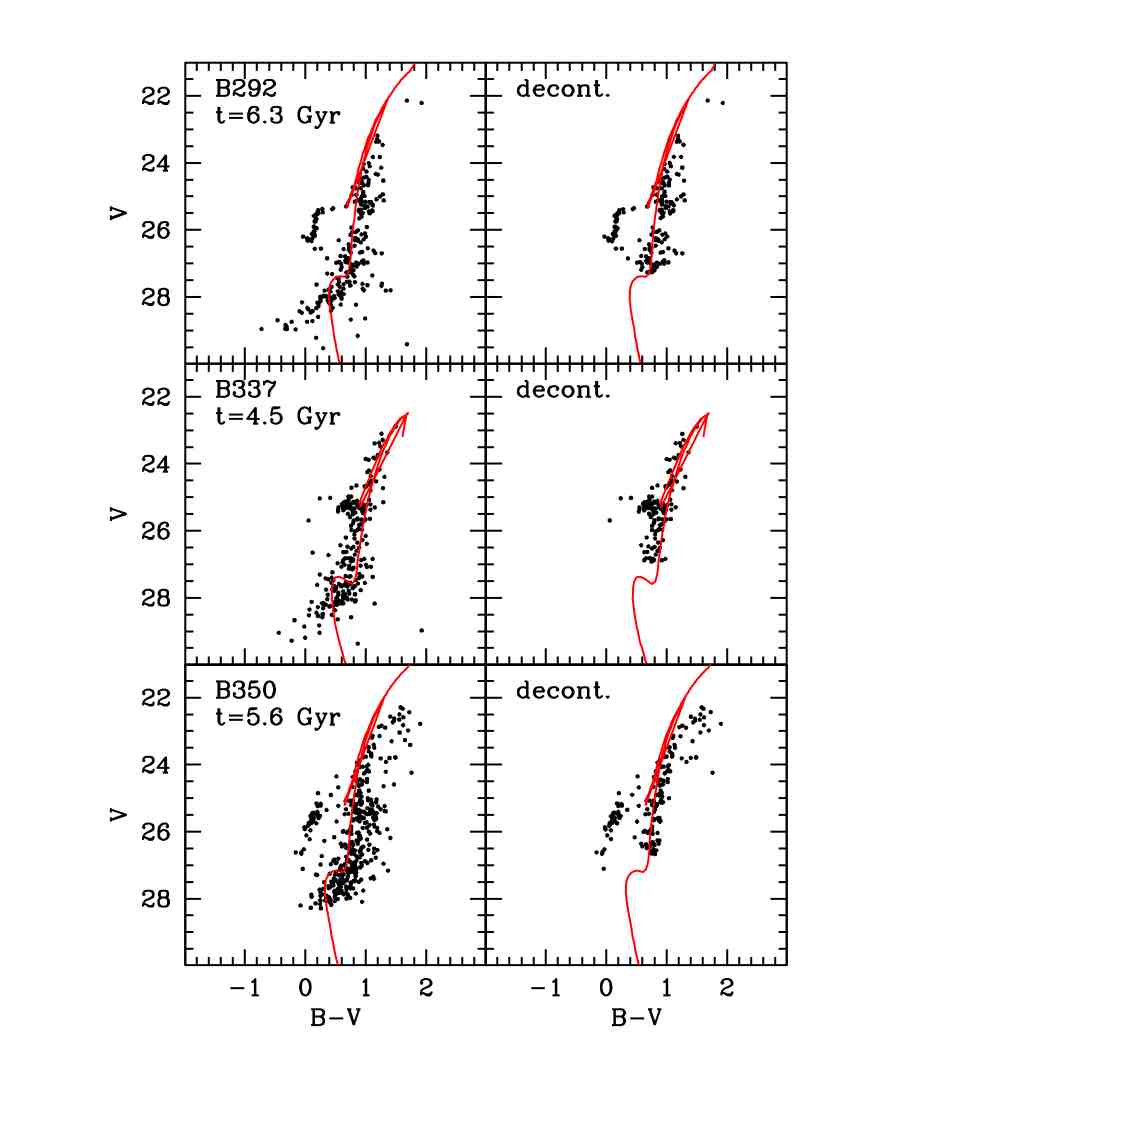
In the left panels of Figs. 4 and 5 we over-plotted the isochrones from the Girardi et al.( isocPD (2002)) set on the cluster CMDs, taking the age and the metallicity estimated by P05 for these clusters. The isochrones have been shifted to the same distance and reddening of the clusters adopting the values derived in Sect. 3.1 and listed in Table 6. Clearly, the CMDs are not deep enough to reliably test the region of the upper MS and MSTO that is expected for populations of that age. The handful of stars lying around the expected sub-giant branch (SGB) level are fully consistent with being largely caused by field contamination (see Fig. 8). In any case, we can obtain strong and meaningful lower limits to the age of three of the four main targets (excluding B58) by searching for the oldest isochrone whose SGB clearly is above the observed candidate SGB stars (see Fig. 8, below). The resulting limits, (age Gyr for B292, age Gyr for B337, and age Gyr for B350) are sufficient to rule out the estimates from integrated photometry by W10 and F10, which point to ages significantly younger than P05 (see Table 2). On the other hand, we have to rely on evolved stars to constrain the age of our clusters in the range invoked by P05.
In most CMDs the evolved population of the cluster can be clearly distinguished from the field (see also the de-contaminated CMD presented in Sect. 3.1). In particular, B292 and B350 display an obvious blue HB that cannot be accounted for by field contamination (see Fig. 7 and Table 7). As said, this is a characteristic feature of very old metal-poor GCs; its mere presence strongly argues against ages younger than 10-11 Gyr. For the same clusters, the over-plotted isochrones predict the (possible) presence of asymptotic giant branch stars brighter than the RGB tip (dashed line) while no such stars are observed, providing further support to the idea that these clusters are indeed older than the considered models. It is worth to stress here that for B292 and B350 an age of 12.5 Gyr (i.e., typical of old MW GCs, Dotter et al. dotter (2010)) is within 1 from the age estimates by P05, hence fully compatible with them (see Table 2). It may be interesting to investigate why the accurate Lick indices analysis performed by those authors singled out these clusters as being younger than the bulk of the others. We will attempt to achieve some insight into this question in Sect. 5. On the other hand, even an age Gyr would strongly disagree with the values provided by W10 and F10, suggesting that these estimates are not only systematically too low, but appear to have unrealistically low associated errors (typically lower than 1 Gyr; Table 2).
| ID | [Fe/H] | E | |
|---|---|---|---|
| mag | mag | ||
| NGC7078 (M15) | –2.16 | 0.10 | 15.37 |
| NGC5824 | –1.87 | 0.13 | 17.93 |
| NGC6205 (M13) | –1.65 | 0.02 | 14.48 |
| NGC5904 (M5) | –1.40 | 0.03 | 14.46 |
| NGC6723 | –1.12 | 0.05 | 14.85 |
| 47 Tuc | –0.71 | 0.04 | 13.37 |
| NGC6624 | –0.35 | 0.28 | 15.36 |
NOTES: Metallicities are from Zinn (1985); all other parameters are from Harris (1996) (online update 2003). B,V photometry is from Piotto et al. (2002).
3.1 Determination of the cluster parameters
Before proceeding with the analysis of the cluster properties, we applied the field decontamination procedure described in Bellazzini et al. (bel99 (1999)). This method is based on a clipping routine which, making use of the local density on the CMDs of the field and of the cluster, computes the probability that a given star is a member of the cluster and retains or rejects stars from the cluster CMD according to that (see P09b for further details).
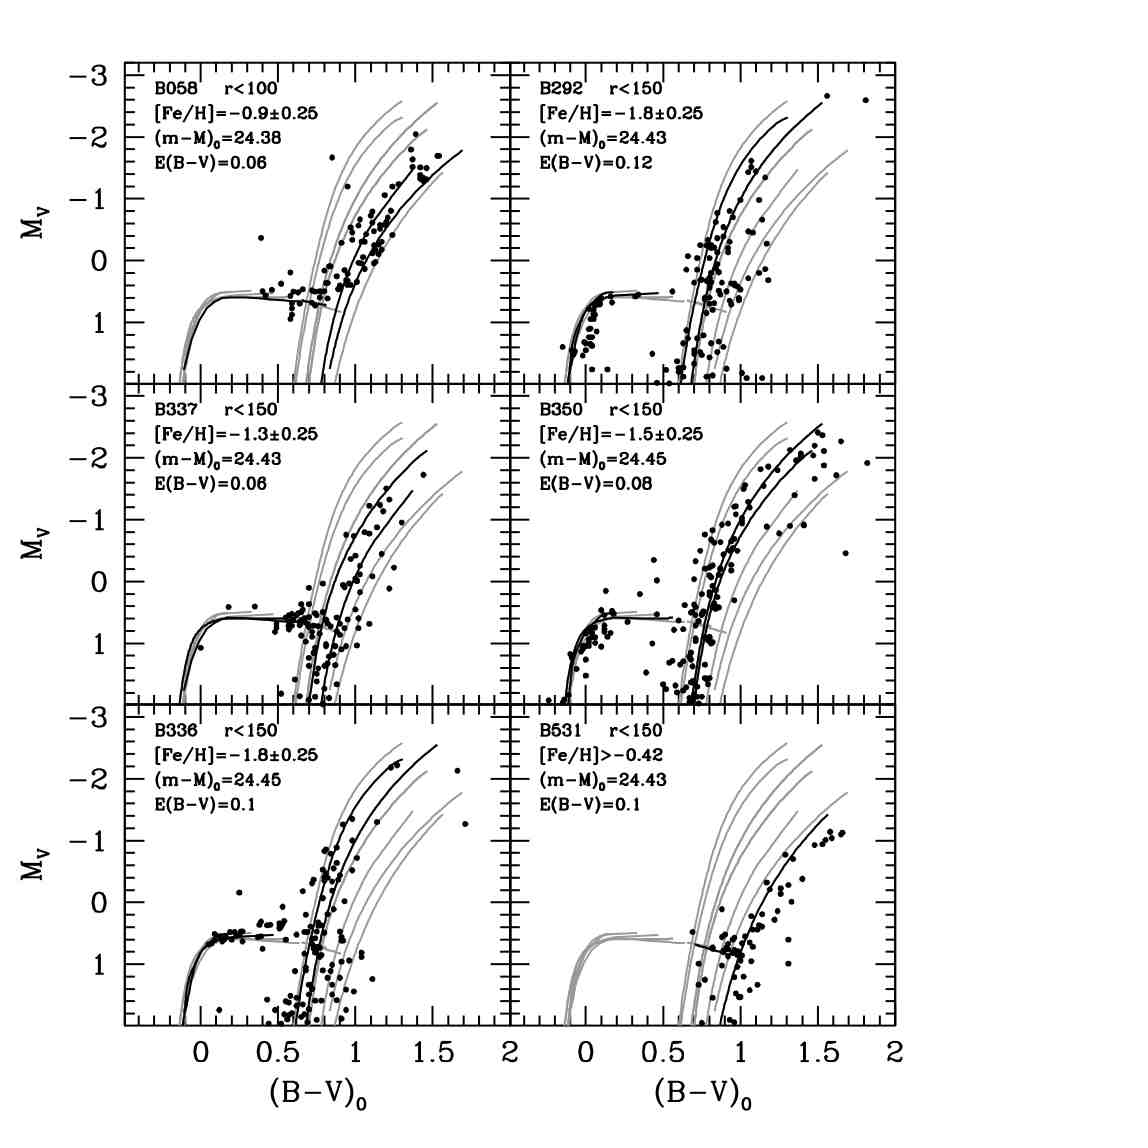
Assuming that the clusters are classical old globulars, we derived a simultaneous estimate of the distance modulus, reddening, and metallicity by comparing them with a set of CMD templates of well studied Galactic GCs, exactly in the same way as in P09b. We searched for the set of parameters ( , E(B-V) and [Fe/H]) producing the best match between the observed RGBs and HBs and the ridge lines of the template clusters in the absolute plane, given the direction of the reddening vector , (Schlegel et al. sch98 (1998)). The best match was judged by eye guided by (extensive) experience. Color and magnitude shifts are applied iteratively until a satisfactory match with any RGB and HB template is found. From these shifts we obtained estimates of the reddening and distance, while the metallicity was estimated by interpolation between the two RGB ridge lines bracketing the observed RGB locus. As starting values for the iterative procedure we used E(B-V) = 0.08 for the foreground reddening (Barmby et al. barm07 (2007); Burstein & Heiles BH84 (1984)) and the distance modulus (McConnachie et al. mcc05 (2005)). The ridge lines of the reference GGCs were derived from publicly available photometry (Piotto et al. pio02 (2002)) and were shifted to the absolute reference frame by correcting for reddening and distance using the values listed in Table 5. These reference GGCs were chosen to provide a sufficiently fine and regular sampling over a wide enough range of metallicities for a correct characterization of the target GCs.
In Fig. 7 we show the field-decontaminated CMDs with the reference grid of GGC ridge lines over-plotted. The values of metallicity, reddening, and distance corresponding to the best match are also reported in each individual panel, as well as in Table 6; the typical uncertainty on the distance modulus is 0.2 mag, 0.04 mag in E(B-V), and 0.25 dex in metallicity. In Sect. 3.2 we briefly discuss each individual cluster.
| ID | E(B-V) | [Fe/H] | |
|---|---|---|---|
| mag | mag | ||
| B292-G010 | 0.12 | 24.43 | -1.800.25 |
| B337-G068 | 0.06 | 24.43 | -1.300.25 |
| B350-G162 | 0.08 | 24.45 | -1.500.25 |
| B336-G067 | 0.10 | 24.45 | -1.8 0.25 |
| B531 | 0.10 | 24.43 | -0.42 |
| ID | |||||
|---|---|---|---|---|---|
| B292-G010 | 30 | 25 | 1.05 0.21 | 5.3 | 0.042 |
| B350-G162 | 37 | 76 | 2.36 0.27 | 5.7 | 0.031 |
| B336-G067 | 23 | 21 | 0.55 0.12 | 4.7 | 0.026 |
is the number of cluster stars expected in a given box from the field population, computed by rescaling the observed counts in the sampled field by the ratio between the sampled GC and field areas (last column). In the fifth column we list the background-subtracted star counts in the GCs sampled areas in unit of .
3.2 Results for individual clusters
3.2.1 B292=G010
The cluster B292 lies at a fairly large projected distance from the center of M31, in a low-density region where the contamination by the field stars is very low. Its CMD (Fig. 4, top-left panel), is characterized by a steep RGB and a well defined and populated BHB that is obviously associated with the cluster: star counts within a box enclosing the feature indicate an overabundance of BHB stars in the cluster with respect to the surrounding field (see Table 7) at 5 level.
The best match with the Galactic RGB and HB ridge lines is obtained by assuming a value of reddening mag and a distance modulus of . With these assumptions, the cluster’s RGB fall between the ridge lines of NGC5824 and M13, indicating that the metallicity of B292 is . This value agrees well with the spectroscopic metallicity estimates by P05 and Galleti et al. (G09 (2009), hereafter G09), while it is just marginally more metal-poor than what was found by Barmby et al. (barm00 (2000), hereafter B00), and 0.45 dex more metal-rich than the value obtained by F10 from integrated photometry. The mismatch in color between the vertical parts of observed and template BHB may suggest a solution with a higher reddening and, consequently, a lower metallicity; this would not change the main conclusions of the present analysis significantly. We preferred the solution presented in Fig. 7, which gives greater weight to the five stars at intermediate color (, around ), because, if interpreted as genuine cluster members, they provide a constraint on the vertical direction (distance) that is otherwise lacking. The best match of the color of the vertical portion of the HB can be obtained by adopting E(B-V)=0.19, and . This solution appears unlikely because it would imply that this cluster is located several kpc above (and in front of) the M31 disk while suffering from a degree of extinction quite typical of clusters embedded in the disk (see Perina et al. ymc (2010)). A small-scale Galactic cloud on this line of sight seems the only possibility to make this solution viable. In any case, this solution also yields a low metallicity () and the old age implied by the presence of BHB.
3.2.2 B350=G162
The CMD of B350 (Fig. 4, bottom-left panel) shows a well populated blue HB clearly associated with the cluster (see Table 7 and Fig. 8). The RGB is steep, which indicates a low metal content.
The best match of the RGB and HB features with the corresponding Galactic ridge lines is obtained by assuming a distance modulus of = 24.45 and maintaining the adopted starting value of mag for the reddening, in good agreement with what was reported by F10 (Table 1). With these assumptions, the cluster RGB fall between the ridge lines of M13 and M5, indicating for B350 a metallicity of . This is compatible with most of the values available in literature, except for the marginal discrepancy with the estimate by F10 from integrated photometry (see Table 3).
3.2.3 B058=G119
Owing to the high degree of crowding, the CMD of B058 is not of sufficient quality to obtain a truly reliable solution. The CMD previously obtained by Rich et al.( rich05 (2005)) from WFPC2 data in the filters F555W (V) and F814W (I) with longer exposure times (5300 s and 5400 s, respectively) seems easier to interpret, because it appears to be slightly deeper and the RGB shape is straighter in the I-band. The solution presented here must be considered as only tentative, we suggest to keep the parameters by Rich et al. (rich05 (2005)) as the best set.
The 6.4 Gyr isochrone shown in Fig. 5 seems fully compatible with the observed CMD, but an old isochrone would fit equally well. The estimate by P05 had a large uncertainty ( Gyr) and the CMD test is completely inconclusive. Ages as low as 4 Gyr or 2 Gyr, as proposed by F10 and W10, respectively, are compatible with the observed CMD as well.
3.2.4 B337=G068
B337 has a very clean CMD characterized by a steep RGB and a well populated red HB (see Fig. 5). The decontamination has little effect on the CMD of this cluster, which is positioned in a quite low-density region (see Figs. 7 and 8).
The best match of these features with the corresponding ridge lines is obtained by assuming a value of reddening of mag (in excellent agreement with F10) and a distance modulus of . With these assumptions, the cluster RGB lies between the ridge lines of M5 and NGC6723, indicating a metallicity of B337 of . This value agree with the estimates by G09 and B00, while it is significantly lower than what was obtained by P05 and F10. (see Table 3). The CMD appears to be incompatible with this high metallicity, if genuinely old.
It is impossible in this case as well to draw a firm conclusion on the age of the cluster. The red HB is bluer than that of the field, compatible with old metal rich population à la 47 Tuc. Three stars lying very close to the BHB templates are preserved in the de-contaminated CMD, but they are too few to be unequivocally attributed to the cluster. As said above, the faint end of the CMD seems already incompatible with the formal best-fit age proposed by P05 (4.9 Gyr; see Fig. 8), but the tension relaxes if the uncertainties are taken into account (the same is true for the estimate of Beasley et al. beas05 (2005)). On the other hand, the values proposed by F10 ( Gyr) and W10 ( Gyr) are clearly too low to be compatible with the CMD.
3.2.5 B336=G067
B336 is a secondary target falling in the field of B337. The CMD of B336 presented here shows a populous intermediate-blue HB population, implying an old age for the cluster (see Table 7). This is also the only cluster in our sample that displays a population of candidate RR Lyrae variables in significant excess with respect to the surrounding field, another indication of old age (Sect. 4). The best fit to the decontaminated CMD with the Galactic templates is obtained assuming a distance modulus of 24.45 and a . The RGB of B336 lies between the ridge lines of NGC5824 and M13, indicating a metallicity (see Fig. 7). Fan et al. (fan10 (2010)) estimates from integrated photometry an age of Gyr, a value incompatible with the observed CMD. The authors obtained a metallicity of in marginal disagreement with the value estimated here, and a reddening . The adoption of this high reddening value would shift all RGB and most BHB cluster stars to the blue of the bluest template, leading to an obvious inconsistency. Caldwell et al. (C11 (2011)) report and , confirming that the cluster is not very reddened and is remarkably metal-poor.
3.2.6 B531
B531 is a newly detected cluster, found in the field of the target B292. Its CMD in Fig. 3 shows a red HB and an RGB quite tilted and redder then the reddest available Galactic template (NGC6624). The fitting procedure of the decontaminated CMD with the Galactic templates provided the best result adopting a distance modulus of 24.43 and mag (similar to what was found for B292 in the same field), indicating B531 as a very metal-rich cluster with (see Fig. 7). A solution with a higher reddening would lead to a lower metallicity estimate, but the match of the red HB level would be lost. Moreover, this line of sight is far from the visible disk of M31 and is unlikely to be associated with high values of intrinsic extinction. B531 lies at a projected distance kpc from the center of M31; the projection along the galaxy minor axis is kpc. In P09b it has been noted that metal-rich clusters located so far away from the galaxy center (and “above” the galaxy disk) are quite rare and may trace substructures associated to past accretion events in the M31 halo (see the case of B407, discussed in P09b, and also Mackey et al. mack10 (2010)). If the high-metallicity of B531 will be confirmed, this cluster would be an interesting candidate “accreted” GC. A spectroscopic study, aimed at estimating the metallicity and the velocity of this cluster would be very valuable to follow-up this hypothesis. The integrated color of B531 is very similar to that of 47 Tuc [, from Harris harris (1996)], thus supporting a (relatively) high metal content.
Integrated B,V, I magnitudes were computed for this cluster by transforming aperture magnitudes obtained from Sloan Digital Sky Survey (Abazajan et al. sdss (2009)) calibrated images, as described in detail in Perina et al. 2009a for VdB0. Adopting an aperture of radius 11 px, we obtained , , and . Lupton (2005) transformations777www.sdss.org/dr4/algorithms/sdssUBVRITransform.html were used to convert from g,r,i to B,V, I magnitudes.
4 Detection of RR Lyrae variables
Another possibility to classify a cluster as very old is to identify a population of RR Lyrae belonging to it. The considered observations were not planned for a search of variables and are far from optimal for this purpose. For each observed field, the observations in the two filters were acquired at a distance of two months, therefore they are not expected to sample the same phase range of any light curve. The four consecutive F435W images (per field) span an interval of hours (i.e., of the typical period of a RR Lyrae); the six consecutive F606W images (per field) span an interval of hours (i.e., of the typical period of a RR Lyrae). Therefore, even if the amplitude of the variation is expected to be larger in F435W, the F606W observations are likely more efficient in detecting RR Lyrae because of the larger number of exposures and larger phase coverage.
With this observational material we can hope to detect ab-type RR Lyrae variables with periods longer then h only if they are caught during the rapid rise to maximum light or in the descending branch of their light curve, while they would go unnoticed if they are observed near their maximum/minimum. Moreover, because the exposures in the two filters are not consecutive, the detection of variability in both passbands is only a serendipitous event. Similar limitations have been encountered also by Clementini et al. (clem01 (2001)), who for the first time, searched for RR Lyrae variables in a sample of M31 GCs using archive HST Wide Field Planetary Camera 2 (WFPC2) data. That study, however, proved the possibility of a successful detection of likely candidates RR Lyrae also with data not optimized for this type of investigation. It is important to stress that the present analysis is not intended to obtain a complete census of the RR Lyrae population in the considered clusters but, instead, is aimed at verifying whether a significant population of RR Lyrae can be identified in some of them.
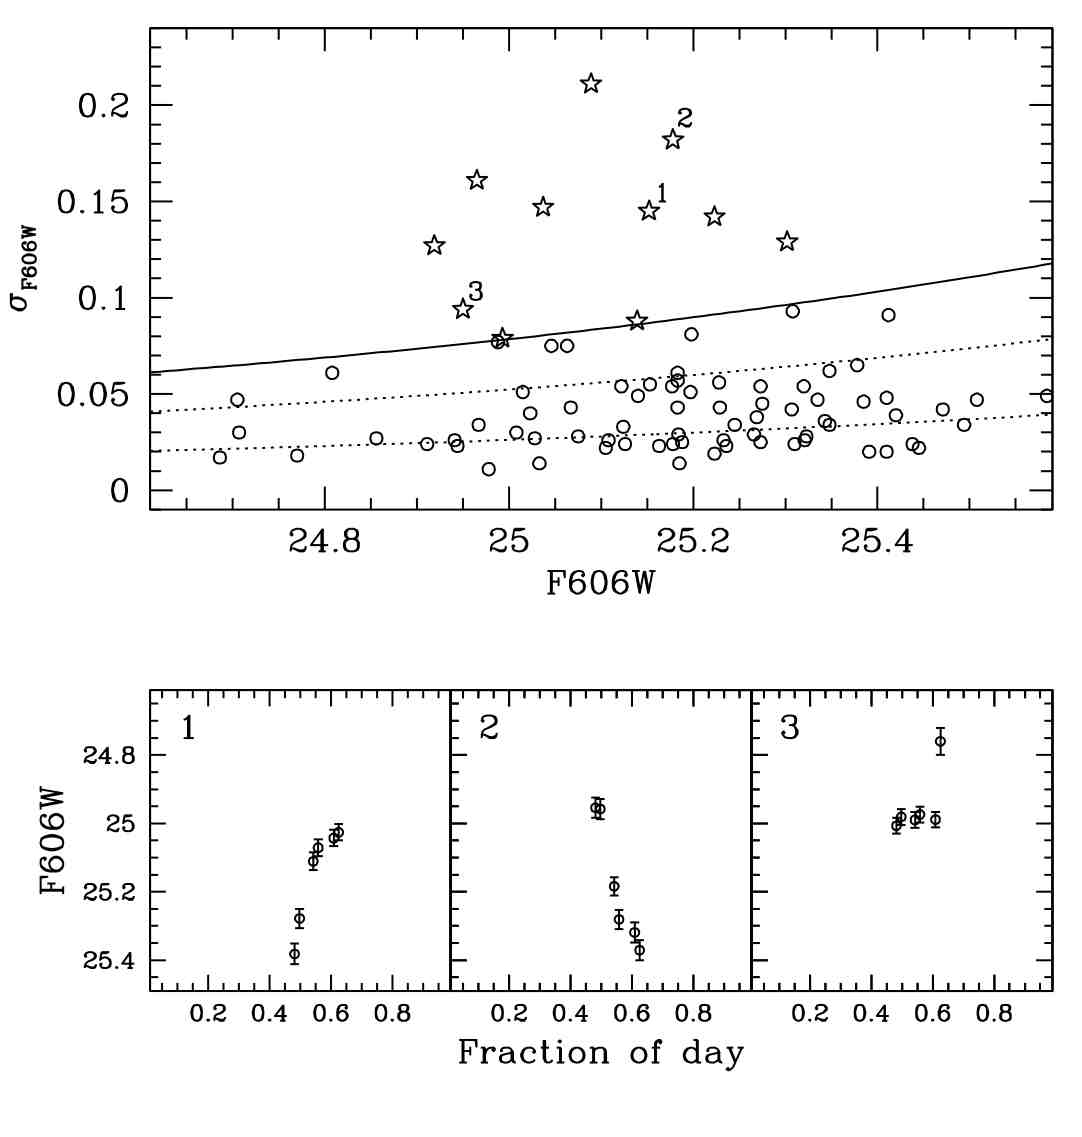
To identify RR Lyrae candidates, we adopted the following criteria, which are ilustrated in Fig. 9 :
-
1.
We searched for variability only in stars lying within of the HB level as estimated in Fig. 7.
-
2.
We considered objects with rms deviations in their estimate of the magnitude larger than or equal to three times the average deviation at their luminosity level. Fig. 9 shows an example of application to the cluster B336: the selection procedure identifies 11 candidate variables (open star symbols) that satisfy this criterion.
-
3.
For the selected stars the sequences of individual measurements were then displayed as a function of the epoch, searching for trends in the light curves that were compatible with RR Lyrae type variations. Fig. 10 shows as an example the light curves of the three candidate variables labeled in Fig. 9. The stars labeled 1 and 2 show a coherent pattern of variations in all sampled epochs, compatible with genuine RR Lyrae variables. On the other hand, candidate 3 is a classical case of spurious detection: F606W is constant at all epochs except one, likely corresponding to the hit of a cosmic ray over the PSF area of the star in the individual image at that epoch.
-
4.
We identified a star as a candidate RR Lyrae variable if it satisfied all three criteria, at least in one of the two passbands.
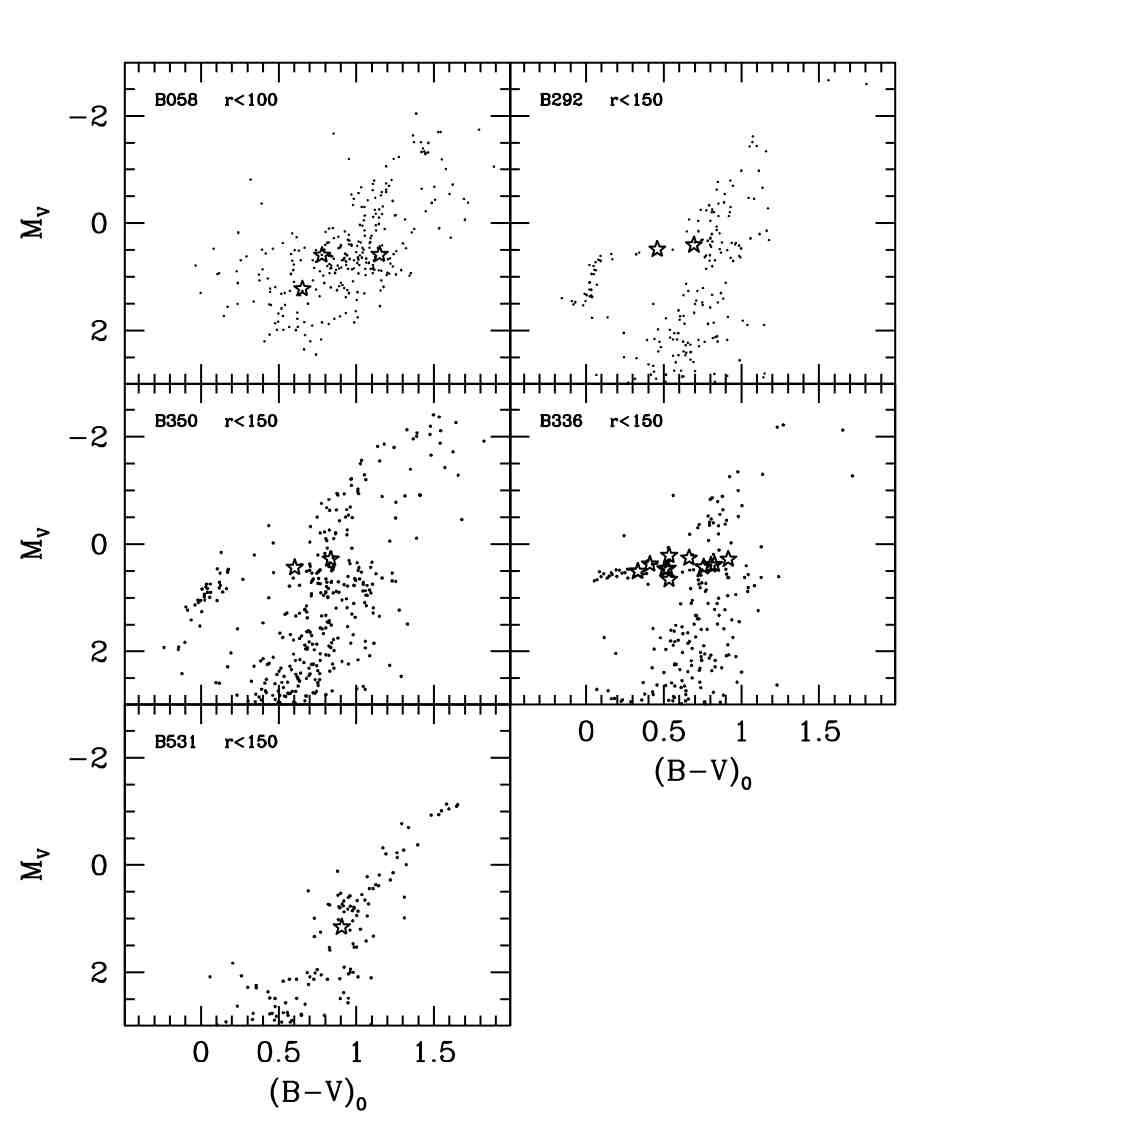
As a result of this analysis, we found 11 (B336), 3 (B058), 2 (B292, B350), 1 (B531) and 0 (B337) candidate RR Lyrae stars in our six clusters, respectively. Their positions in the CMDs are shown in Fig. 10. We searched for candidate RR Lyrae variables also in comparison fields surrounding the clusters to quantify the probability that the variables detected in the cluster can be explained as merely due to the field population. Given the observed frequency of candidate variables in the surrounding fields, the number of field RR Lyrae expected to fall on the cluster area are 0, for the clusters B336, B292, B531, B337, 1, for B350, and 2 for B058. Hence, the only cluster for which a significant excess of RR Lyrae is found with respect to the expectations is B336, providing further evidence supporting a very old age for this system. The very red colors of most of the candidates in B058, B350, and B531 also cast some doubt on their classification as RR Lyrae. Note that the lack of detection of a significant excess of candidate RR Lyrae in the other clusters cannot be taken as evidence that no such variable is present there: our data are clearly not sufficient to reach this conclusion.
5 Summary and discussion
The main aim of this study was to verify whether the intermediate age estimate obtained from integrated spectroscopy and/or photometry by several authors (Table 2) for the M31 clusters B058, B292, B337, and B350 was supported by the CMD obtained from the new HST-ACS observations. The final answer is completely inconclusive for B058 and uncertain for B337, even if in the last case there is marginal evidence for an older age compared to the dating from integrated light. On the other hand, both B292 and B350 show a significant and unequivocal population of blue horizontal branch stars, indicating that they are as old as the classical Galactic GCs (ages older than 11 Gyr; see Dotter et al. dotter (2010), for a recent analysis and discussion). It should be noted that the age estimates provided by P05 are consistent within 1 uncertainties with this conclusion. However, these clusters were singled out as likely younger than the bulk of M31 clusters at similar metallicity and this classification is clearly not confirmed here. On the other hand, ages as young as claimed by W10 and F10 (all Gyr) are clearly ruled out by the observed CMDs for all main targets of the present study except (possibly) B058. The comparison with the results by Be05 significantly depends on the considered set of age estimates provided by these authors (see Table 2). It may be interesting to note that except for B350, their estimates based on the BC03 SPSS models are not compatible (too young) with the observed CMDs, even taking into account the reported uncertainties; on the other hand, the estimates obtained from the T03 models are similar to those by P05, and, in particular, the old age reported for B350 fully agrees with our results.
The sensitivity of colors and/or spectral indices generally used as age diagnostics (like, for example, H) to the morphology of the horizontal branch is known for long time: for example, it was already taken into account in the models of the integrated light of SSPs by Buzzoni (buz (1989)). Bright and hot BHB stars typical of an old population may mimic the effect of a hotter MSTO, i.e., of a younger age (see Lee et al. lee (2000) for a thorough discussion, and Percival & Salaris perci (2010) for a very recent investigation in the context of SPSS modeling). It is tempting to identify this as the main reason at the origin of the erroneous classification of B292 and B350 as intermediate-age clusters (Rey et al. rey07 (2007)).
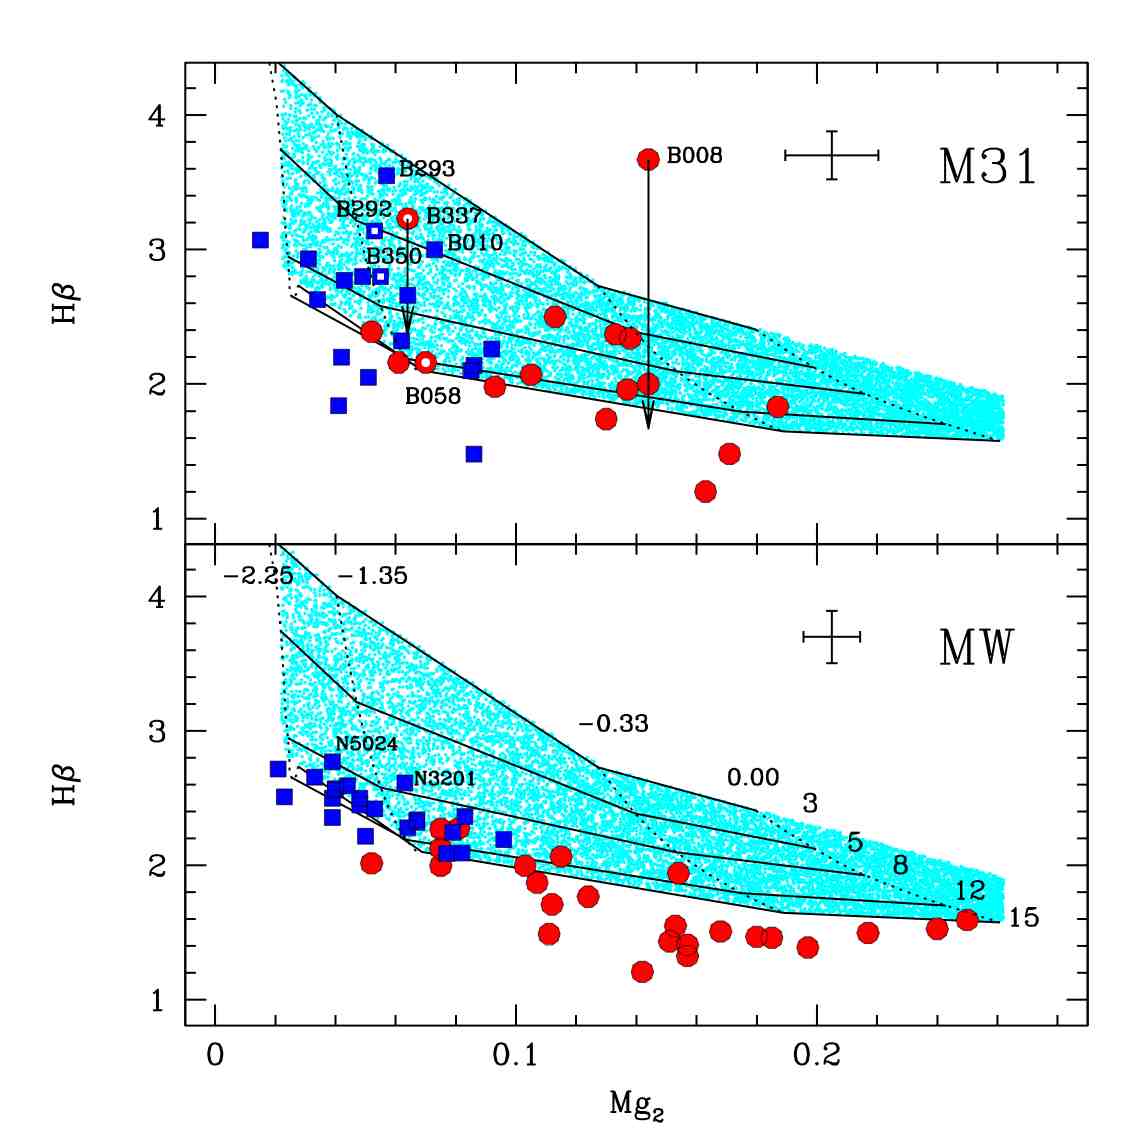
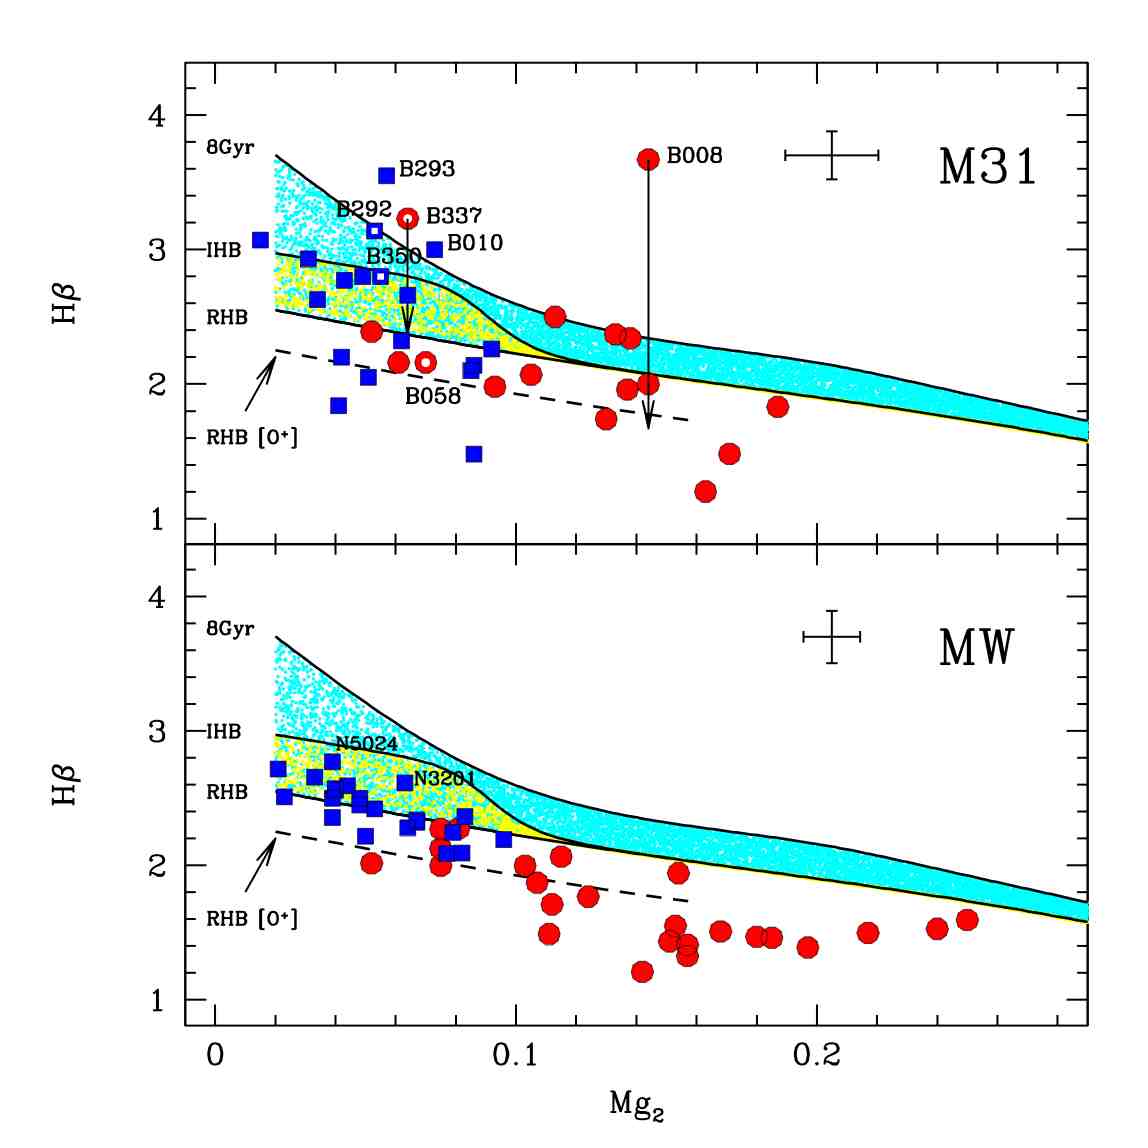
To gain a deeper insight into this hypothesis, we considered all M31 GCs for which a safe classification of their HB morphology can be obtained from their CMDs, taken from different sources (see Sect. 1 for an exhaustive list). We simply divided the clusters into BHB (blue squares) and RHB (red circles) from the inspection of their CMD; our classification criterion is illustrated in Fig. 11. We ended up with a sample of 33 clusters that also have estimates of the H and Mg2 indices reported in the RBC (see G09). The classical age-diagnostic plot Mg2 vs. H for these clusters is shown in the upper panel of Fig. 12; a grid of SSP models from the most recent set by Thomas et al. (thomas (2010)) is over-plotted as a reference. None of the conclusions drawn from this plot is significantly dependent on the actual set of models adopted (see, for example, Fig. 13, below). In the lower panel of Fig. 12 the same diagram is shown for the Galactic GCs. The H and Mg2 indices are taken from G09. In this case we classified as BHB clusters with and as RHB those with , where the values of the classical HB morphology parameter888Where B, R, V are the number of stars to the blue, to the red, and within the RR Lyrae instability strip, see Lee, Demarque & Zinn (leezinn (1990)). are taken from Harris (harris (1996)).
In addition to the obvious correlation between the HB morphology and the metallicity of the clusters999Metallicity is the first parameter driving the HB morphology, see Sandage & Wildey (sand67 (1967)), Fusi Pecci & Bellazzini (fpb97 (1997)), Dotter et al. (dotter (2010)), and reference therein., there are several other interesting features in Fig. 12 that deserve to be commented on in the present context.
-
1.
According to Fig. 12, B292 and B350 appear younger than 8 Gyr, in agreement with P05. These are not the most extreme cases, because B010 and B293 have even larger H values, implying ages as young as Gyr and Gyr, respectively, if the comparisons with models shown in Fig. 12 are taken at face value. Nevertheless, also these clusters, as B292 and B350 (and also B311, discussed in Sect. 1), display an obvious BHB population (see, e.g., Fig. 11, for the case of B293) indicating that they are, in fact, much older than this.
-
2.
In this context it is interesting to note that the well studied BHB Galactic clusters NGC5024 and NGC3201 fall, in the same diagram, on top and just above the age=8 Gyr locus, respectively. We have reliable age estimates for these clusters based on exquisite photometry that reaches well below the MSTO. In the most recent thorough analysis, based on an homogeneous set of HST data, Dotter et al. (dotter (2010)) found an age=12.00.75 Gyr for NGC3201, and an age=13.250.50 Gyr for NGC5024, in an age scale in which the oldest GC has age=13.500.50 Gyr. This shows quite conclusively that even in the best possible case, an age classification based on the classical spectral diagnostic H is not at all able to unambiguously distinguish between old and intermediate-age clusters, because 13 Gyr old BHB clusters can easily have H, i.e., the same as Gyr old clusters (see Lee et al. lee (2000)). In this sense, it appears reasonable the limit H adopted by Fusi Pecci et al. (FP05 (2005), and in the RBC) to identify genuinely young clusters, even if this a conservative choice may still not be completely safe from false positives, like the case of B008, described below.
-
3.
Returning to M31 BHB clusters, the situation shown in Fig. 12 may appear even worse. However, the larger spread of the distribution of M31 points with respect to MW ones is suggestive of the effect of larger observational errors, which would not be unexpected given the large difference in distance between the two sets of GCs. Even if average formal errors provided in the literature are similar in the two cases (see the error-bars in Fig. 12), the fact that the M31 BHB clusters show similar spreads above and below the 12-15 Gyr models is consistent with our hypothesis.
-
4.
Further support of this view was provided by new spectra that were recently obtained for two RHB clusters that appeared to have an anomalously high , B337 (one of our main targets) and B008 (lying straight on the age=1 Gyr locus)101010S. Galleti, private communication. The spectra were obtained at the Cassini Telescope, in Loiano, using the same set-up and data-reduction procedure described in Galleti et al. (loi (2005, 2009)) The H index was measured as in Galleti et al. (G09 (2009)). It is found H instead of H for B008, and H instead of H for B337.. The newly obtained estimates of H for these clusters are much lower than those found in the literature (see the arrows in Fig. 12) and fully agree with ages Gyr. This new finding suggest that large errors in Lick indices taken from the literature may not be such rare occurrences for M31 GCs as one might expect.
To illustrate the effects of the HB morphology on H, we provide in Fig. 13 the same comparison as in Fig. 12 but using models from the set by Buzzoni (buz (1989)). The overall results are similar to those obtained in Fig. 12, hence we do not repeat the discussion. The key point displayed in Fig. 13 is that if the observed range of HB morphology is taken into account, the H values of all Galactic GCs can be reconciled with the old ages estimated from the CMDs by Dotter et al. (dotter (2010)).
In conclusion, a convincing case has still to be provided for the presence of an intermediate-age bright cluster in M31 (see Caldwell et al. C11 (2011), for a closely similar conclusion, reached with a different observational approach). The experiment performed here suggests that HST observations of M31 clusters with “reasonable” exposure times ( HST orbits) can reliably probe only ages lower than 4-5 Gyr, while they would be inconclusive for older ages (except in the case of detection of BHB stars). On the other hand, the results of the present analysis clearly indicate that while the analysis of classical Lick indices remain a valuable technique to identify candidate intermediate-age GCs in external galaxies (including M31), they do not provide sufficient evidence to firmly establish the case of ages in the range , but need independent confirmation from other means.
Acknowledgements.
We are grateful to Thomas Puzia for useful discussions.This research is supported by a PRIN-INAF 2009 grant CRA-1.06.12.10 assigned to the project ”Formation and Early Evolution of Massive Star Cluster” (PI: R. Gratton).
References
- (1) Abazajian, K.N., Adelman-McCarthy, J.K., Agüeros, M.A., et al., 2009, ApJS, 182, 543
- (2) Ajhar, E. A., Grillmair, C. J., Lauer, T. R., Baum, W. A., et al.: 1996, AJ, 111, 1110
- (3) Barmby, P., Huchra, J.P., Brodie J.P., Forbes, D.A., Schroder, L.L., & Grillmair, C.J, 2000, AJ, 119, 727 [B00]
- (4) Barmby, P., Huchra, J.P., & Brodie, J.P. 2001, AJ, 121, 1482
- (5) Barmby, P., in Extragalactic Globular Cluster Systems, ed. M. Kissler-Patig (Berlin: Springer), 2003, 143
- (6) Barmby, P., McLaughlin, D.E., Harris, W.E., & Harris, G.L.H. 2007, AJ, 133, 2764
- (7) Beasley M. A., Hoyle F., Sharples R. M., 2002, MNRAS, 336,168e
- (8) Beasley, M. A., Brodie, J. P., Strader, J., Forbes, D. A., Proctor, R. N., Barmby, P., & Huchra, J. P. 2005, AJ, 129, 1412
- (9) Beccari, G., Lanzoni, B., Ferraro, F.R., et al., 2008, ApJ, 679, 712
- (10) Bellazzini, M., Ferraro, F. R., & Buonanno, R. 1999, MNRAS, 304, 633
- (11) Brown, T.M., Ferguson, H.C., Smith, E., Kimble, R.A., Sweigart, A.V., Renzini, A., Rich, R.M. & VandenBerg, D.A. 2004b, ApJ, 613, L125
- (12) Bruzual, G., & Charlot, S., 2003, MNRAS, 344, 1000 (BC03)
- (13) Burstein D., Heiles C. 1984, ApJS, 54, 33
- (14) Burstein, D., et al. 2004, ApJ, 614, 158
- (15) Burstein, D., Faber, S.M., Gaskell, C.M., & Krumm, N., 1984, ApJ, 287, 586
- (16) Buzzoni, A. 1989, ApJS, 71, 817
- (17) Caldwell, N., Harding, P., Morrison, H., Rose, J., Schiavon, R., & Kriessler, J., 2009, AJ, 137, 94 [C09]
- (18) Caldwell, N., Schiavon, R., Morrison, H., Rose, J.A., Harding, 2011, AJ, 141, 61
- (19) Clementini, G., Federici, L., Corsi, C., Cacciari, C., Bellazzini, M., & Smith, H.A., 2001, AJ, 559, L109
- (20) Dolphin, A. E. 2000a, PASP, 112, 1383
- (21) Dolphin, A. E. 2000b, PASP, 112, 1397
- (22) Dotter, A., Sarajedini, A., Anderson, J., et al., 2010, ApJ, 708, 698
- (23) Faber, S. M., Friel, E. D., Burstein, D., & Gaskell, C. M., 1985, ApJS, 57, 711
- (24) Fan, Z., Ma, J., de Grijs, R., Yang, Y., & Zhou, X. 2006, MNRAS, 371, 1648
- (25) Fan, Z., Ma, J., de Grijs1, R., & Zhou, X., 2008, MNRAS, 385, 1973
- (26) Fan, Z., de Grijs1, R., & Zhou, X., 2010, MNRAS, in press (arXiv:1009.3582) [F10]
- (27) Fusi Pecci, F., Ferraro, F.R., Bellazzini, M., Djorgovski, S., Piotto, G., & Buonanno, R., 1993, AJ, 105, 1145
- (28) Fusi Pecci, F., & Bellazzini, M., 1997, in The Third Conference on Faint Blue Stars (1997), A.G.D. Philip, J. Liebert, R. Saffer and D.S. Hayes Eds., Shenectady: L. Davis Press, p. 255
- (29) Fusi Pecci, F., et al. 1996, AJ, 112, 1461
- (30) Fusi Pecci, F., Bellazzini, M., Buzzoni, A., De Simone, E., Federici, L., & Galleti, S. 2005, AJ, 130, 554
- (31) Girardi, L., Bertelli, G., Bressan, A., Chiosi, C., Groenewegen, M.A.T., Marigo, P., Salasnich, B., & Weiss, A. 2002, A&A, 391, 195
- (32) Galleti, S., Federici, L., Bellazzini, M., et al., 2004, A&A, 416, 917
- (33) Galleti, S., Bellazzini, M., Federici, L., & Fusi Pecci, 2005, A&A, 436, 535
- (34) Galleti, S., Federici, L., Bellazzini, M., Buzzoni, A., Fusi Pecci, F. 2006, ApJ, 650, 107
- (35) Galleti, S., Bellazzini, M., Buzzoni, A., Federici, L., Fusi Pecci, F. 2009, A&A, 508, 1285 [G09]
- (36) Harris, W.E., 1996, AJ, 112, 1487
- (37) Holland, S., Fahlman, G. G., & Richer, R. B. 1997, AJ, 114, 1488 (HFR)
- (38) Huchra, J. P., Kent, S. M., & Brodie, J. P. 1991, ApJ, 370, 495
- (39) Huxor, A., Tanvir, N. R., Irwin, M., Ferguson, A., Ibata, R., Lewis, G., Bridges, T. 2004, ASPC, 327, 118
- (40) Huxor, A. P., Tanvir, N. R., Irwin, M. J., Ibata, R., Collett, J. L., Ferguson, A. M. N., Bridges, T., Lewis, G. F. 2005, MNRAS, 360, 1007
- (41) Huxor, A. P., Tanvir, N. R., Ferguson, A. M. N., Irwin, M. J., Ibata, R., Bridges, T., Lewis, G. F. 2008, MNRAS, 385, 1989
- (42) Ibata, R., Irwin,M., Lewis, G., Ferguson, A. M. N., & Tanvir, N. 2001a, Nature, 412, 49
- (43) Jablonka, P., Courbin, F., Meylan, G., Sarajedini, A., Bridges, T.J. & Magain, P. 2000, A&A, 359, 131
- (44) Jiang, L., Ma, J., Zhou, X., Chen, J., Wu, H., & Jiang, Z. 2003, AJ, 125, 727
- (45) Kravtsov, V., Alcaíno, G., Marconi, G., Alvarado, F., 2009, A&A, 497, 371
- (46) Lee, Y.-W., Demarque, P., Zinn, R.J., 1990, ApJ, 350, 155
- (47) Lee, H.-c., Yoon, S.-Y., Lee, Y.-W., 2000, AJ, 120, 998
- (48) Ma, J., et al. 2007, ApJ, 659, 359
- (49) Ma, J., et al. 2009, AJ, 137, 4884
- (50) Ma, J., et al., 2010, PASP, 122, 1164
- (51) Maraston, C. 1998, MNRAS, 300, 872
- (52) Maraston, C. 2005, MNRAS, 362, 799
- (53) McConnachie, A.W., Irwin, M.J. & Ferguson, A.M.N. 2005, MNRAS, 356, 979
- (54) Mackey, A. D., Huxor, A., Ferguson, A. M. N., Tanvir, N. R., Irwin, M., Ibata, R., Bridges, T., Johnson, R. A., Lewis, G. 2006, ApJ, 653, 105
- (55) Mackey, A. D., Huxor, A., Ferguson, A. M. N., Tanvir, N. R., Irwin, M., Ibata, R., Bridges, T., Johnson, R. A., Lewis, G. 2007, ApJ, 655, 85
- (56) Mackey, A.D., Huxor, A.P., Ferguson, A.M.N., et al., 2010, ApJ, 717, L11
- (57) Martin, N. F., Ibata, R. A., Irwin, M. J., Chapman, S., Lewis, G. F., Ferguson, A. M. N., Tanvir, N., & McConnachie, A. W. 2006, MNRAS, 371, 1983
- (58) Meylan, G., Sarajedini, A., Jablonka, P., Djorgovski, S. G., Bridges, T., & Rich, R. M. 2001, AJ, 122, 830
- (59) Renzini, A., & Fusi Pecci, F. 1988, ARA&A, 26, 199
- (60) Rey, S.-C. et al. 2007, ApJS, 173, 643
- (61) Rich, R.M., Mighell, K.J., Freedman, W., & Neill, J.D. 1996, AJ, 111, 768
- (62) Rich, R.M., in ASP Conf. Ser. 296, New Horizons in Globular Cluster Astronomy, ed. G. Piotto et al. (San Francisco: ASP), 2003, 533
- (63) Rich, R.M, Corsi, C.E., Cacciari, C., Federici, L., Fusi Pecci, Djorgovski, S.G., & Freedman, W., 2005, AJ, 129, 2670
- (64) Percival, S.M., Salaris, M., 2010, MNRAS, in press (arXiv:1012.0004)
- (65) Perina, S., Barmby, P., Beasley, M.A., et al., 2009a, A&A, 494, 933
- (66) Perina, S., Federici, L., Bellazzini, M., Fusi Pecci, F., Cacciari, C., & Galleti, S., 2009b, A&A, 507, 1375 [P09b]
- (67) Perina, S., Bellazzini, M., Barmby, P., Cohen, J. G., Hodge, P. W., Puzia, T. H., & Strader, J. 2010, A&A, 511, 23
- (68) Piotto, G., King, I.R., Djorgovski, S.G., Sosin, C., Zoccali, M. et al. 2002, A&A, 391, 945
- (69) Puzia, T.H, Saglia, R.P., Kissler-Patig, M., Maraston, C., Greggio, L., Renzini, A., & Ortolani, S. 2002, A&A, 395, 45
- (70) Puzia, T.H, Perrett, K.M., Bridges, T.J., 2005, A&A, 434, 909 [P05]
- (71) Sandage, A., & Widley, R., 1967, ApJ, 150, 469
- (72) Sarajedini A., Mancone C.L., AJ, 134, 447
- (73) Schlegel, D.J., Finkbeiner, D.P., & Davis, M. 1998, ApJ, 500, 525
- (74) Sirianni, M., Jee, M. J., Benitez, N., et al. 2005, PASP, 117, 1049
- (75) Strader, J., Smith, G. H., Larsen, S., Brodie, J. P., Huchra, J.P., 2009, AJ, 138, 547
- (76) Thomas, D., Maraston, C., Bender, R., 2003, MNRAS, 339, 897 (T03)
- (77) Thomas, D., Maraston, C., Johansson, J., 2010, MNRAS, in press (arXiv:1010.4569)
- (78) Wang, S., Fan, Z., Ma, J., de Grijs R., Zhou, X., 2010, AJ, 139, 1438 [W10]
- (79) Worthey, G., 1994, ApJS, 95, 107