Galactic Densitometry I: Pilot Survey of Ultracompact H II Regions and Methodology
Abstract
We present a pilot survey of 21 lines of sight towards ultracompact H II (UCH II) regions and three towards continuum-free lines of sight in the formaldehyde () (6 cm) and (2 cm) transitions, using the centimeter lines as a molecular gas densitometer. Using Arecibo and Green Bank beam-matched observations, we measure the density of 51 detected line pairs and present upper limits on density for an additional 24 detected lines. We analyze the systematic uncertainties in the densitometer, achieving density measurements with accuracies dex. The densities measured are not correlated with distance, implying that it is possible to make accurate density measurements throughout the galaxy without a distance bias. We confirm that ultracompact HII regions are associated with, and possibly embedded in, gas at densities . The densities measured in line-of-sight molecular clouds suggest that they consist of low volume filling factor () gas at high ( ) density, which is inconsistent with purely supersonic turbulence and requires high-density clumping greater than typically observed in gravo-turbulent simulations. We observe complex line morphologies that indicate density variations with velocity around UCH II regions, and we classify a subset of the UCH II molecular envelopes as collapsing or expanding. We compare these measurements to Bolocam Galactic Plane Survey 1.1 mm observations, and note that most UCH II regions have 1.1 mm emission consisting of significant (5-70%) free-free emission and are therefore not necessarily dominated by optically thin dust emission as is often assumed when computing clump masses. A comparison of our data with the Mangum et al. (2008) starburst sample shows that the area filling factor of dense ( ) molecular gas in typical starburst galaxies is , but in extreme starburst galaxies like Arp 220, is , suggesting that Arp 220 is physically similar to an oversized UCH II region.
Subject headings:
ISM: HII regions — ISM: molecules — stars: formation1. Introduction
Massive stars are known to form preferentially in clustered environments (de Wit et al. 2005). They therefore likely form from “clumps,” collections of gas and dust more dense and compact than Giant Molecular Clouds (GMCs) but larger and more diffuse than typical low-mass protostellar cores. “Clumps” have been observed with masses ranging from (but more typically ) and with beam-averaged densities in the range and sizes pc (e.g., Rosolowsky et al. 2010; Dunham et al. 2010). While giant molecular clouds in the Galaxy have been surveyed (e.g., Jackson et al. 2006), the process by which these clouds condense into clumps and cores and the mechanisms by which they are dispersed are not understood.
It is still not known what sets the final mass of massive stars, but it is thought that they must ignite while still accreting (McKee & Ostriker 2007). Hot O and B stars emitting strongly in the ultraviolet will ionize their surroundings, creating density-bounded H II regions. They progress from hypercompact through ultracompact and compact and finally diffuse H II region phases, during which they either dissociate or blow out their surrounding medium (Churchwell 2002; Keto 2007). The brightest sources in the Galactic plane in both the free-free continuum in the cm-wavelength regime and the dust continum in the sub-mm to mm-wavelength regime generally host UCH II regions.
While the gas within UCH II regions is hot and ionized, the surrounding gas is initially molecular. At the interface between the molecular cloud and the ionization front, a photon-dominated or photodissociation region appears (Roshi et al. 2005). Churchwell et al. (2010) observed HCO+ towards a sample of UCH II regions and noted both infall and outflow motions in molecular tracers towards these objects. It should be possible to determine whether the UCH II regions still have collapsing envelopes (infall signatures) or only disks (outflow signatures) and thereby determine relative evolutionary states of the regions.
Two centimeter transitions of formaldehyde, (6 cm) and (2 cm)111All references to in this paper, except where otherwise noted, are to the ortho population, as no para p- lines were observed, have been used to measure the density of molecular clouds in massive-star-forming regions (e.g., Dickel et al. 1986; Dickel & Goss 1987), high-latitude Galactic clouds (e.g., Turner et al. 1989), the Galactic Center (e.g., Zylka et al. 1992) starburst galaxies (e.g., Mangum et al. 2008), and molecular clouds in a gravitational lens (e.g., Zeiger & Darling 2010). Studies similar to our own have been performed by Wadiak et al. (1988) and Henkel et al. (1983), in which bright continuum sources were observed in the same transitions with (approximately) beam-matched telescopes at 2′ resolution. Our study delves deeper into the spectral line profiles and systematic uncertainties of densitometry and is performed at higher spatial resolution than past work.
This paper presents a pilot study as a proof-of-concept for a much larger ongoing survey222GBT project code GBT10B-019 towards 400 lines of sight and the methodology applicable to the larger survey.
In section 2 we present the new observations and describe other data sets used in our analysis. Section 3 describes the modeling procedure used to derive density from the line observations. Section 4 presents detailed discussion of the modeling and derivation of physical parameters and their uncertainties. Section 5 describes the derived and measured values. Section 6 discusses the larger implications of our results. We conclude with a brief summary of important results.
2. Observations and Data
2.1. Source Selection
The observed lines-of-sight included 21 sources selected from the Araya et al. (2002) UCH II sample and 3 from the Araya et al. (2004) “massive-star forming candidate” sample. The sources were selected primarily on the basis of having been previously observed with Arecibo333The Arecibo Observatory is part of the National Astronomy and Ionosphere Center, which is operated by Cornell University under a cooperative agreement with the National Science Foundation. in the transition of with the intent of demonstrating the densitometry method within the Galaxy rather than making systematic observations of any source class. Nonetheless, the Araya et al. (2002) sample includes the majority of the bright UCH II regions accessible to Arecibo. Additionally, there are many detected GMCs along the line of sight to these UCH II regions.
The Araya et al. (2004) observations included 15 pointings towards infrared dark cloud (IRDC) candidates and High-Mass Protostellar Object (HMPO) candidates. The sources we selected from this sample include two sources classified as IRDCs based on MSX data and one HMPO candidate. The selection of these sources was arbitrary; we were only able to observe 24 lines-of-sight in our 4 hour observation block. The remaining sources will be discussed in a later paper. The observed lines of sight are listed in Table 1.
| Source NameaaSources are labeled by the line-of-sight followed by the number of the component identified, indexed from zero. The components do not follow a particular order, but are uniquely identifiable by their velocity, width, and amplitude. | 6cm Continuum | Peak | Center | FWHM | RMS | Channel Width | ||
|---|---|---|---|---|---|---|---|---|
| ∘ | ∘ | (Jy) | (Jy) | (km s-1) | (km s-1) | (Jy) | (km s-1) | |
| G32.80+0.19 0 | 0.1904 | 32.7968 | 2.18 (0.01) | -0.393 (0.008) | 15.39 (0.05) | 6.57 (0.06) | 0.0049 | 1.1374 |
| G32.80+0.19 1 | 0.1904 | 32.7968 | 2.18 (0.01) | -0.092 (0.008) | 11.45 (0.26) | 10.25 (0.65) | 0.0049 | 1.1374 |
| G32.80+0.19 2 | 0.1904 | 32.7968 | 2.18 (0.01) | -0.063 (0.008) | 80.63 (0.13) | 2.49 (0.36) | 0.0049 | 1.1374 |
| G32.80+0.19 3 | 0.1904 | 32.7968 | 2.18 (0.01) | -0.254 (0.008) | 84.61 (0.02) | 1.37 (0.06) | 0.0049 | 1.1374 |
| G32.80+0.19 4 | 0.1904 | 32.7968 | 2.18 (0.01) | -0.090 (0.008) | 88.66 (0.09) | 3.21 (0.31) | 0.0049 | 1.1374 |
| G33.13-0.09 0 | -0.0949 | 33.1297 | 0.49 (0.00) | -0.192 (0.007) | 75.92 (0.05) | 3.80 (0.12) | 0.0045 | 1.1374 |
| G33.13-0.09 1 | -0.0949 | 33.1297 | 0.49 (0.00) | -0.023 (0.007) | 81.62 (0.35) | 2.49 (0.88) | 0.0045 | 1.1374 |
| G33.13-0.09 2 | -0.0949 | 33.1297 | 0.49 (0.00) | -0.040 (0.007) | 101.50 (0.40) | 11.30 (0.80) | 0.0045 | 1.1374 |
| G33.13-0.09 3 | -0.0949 | 33.1297 | 0.49 (0.00) | -0.039 (0.007) | 10.39 (0.08) | 2.04 (0.24) | 0.0045 | 1.1374 |
| G33.92+0.11 0 | 0.1112 | 33.914 | 0.83 (0.00) | -0.081 (0.008) | 107.28 (0.18) | 6.62 (0.34) | 0.005 | 1.1374 |
| G33.92+0.11 1 | 0.1112 | 33.914 | 0.83 (0.00) | -0.079 (0.008) | 106.03 (0.06) | 2.41 (0.23) | 0.005 | 1.1374 |
| G33.92+0.11 2 | 0.1112 | 33.914 | 0.83 (0.00) | -0.160 (0.030) | 57.30 (0.40) | 10.60 (0.80) | 0.005 | 1.1374 |
| G34.26+0.15 0 | 0.1538 | 34.2572 | 5.57 (0.01) | -1.828 (0.015) | 60.24 (0.01) | 3.80 (0.03) | 0.0063 | 1.1374 |
| G34.26+0.15 1 | 0.1538 | 34.2572 | 5.57 (0.01) | -0.160 (0.015) | 26.69 (0.08) | 1.04 (0.22) | 0.0063 | 1.1374 |
| G34.26+0.15 2 | 0.1538 | 34.2572 | 5.57 (0.01) | -0.099 (0.015) | 11.25 (0.19) | 2.01 (0.40) | 0.0063 | 1.1374 |
| G34.26+0.15 3 | 0.1538 | 34.2572 | 5.57 (0.01) | -0.126 (0.015) | 51.70 (2.00) | 4.20 (1.00) | 0.0063 | 1.1374 |
| G34.26+0.15 4 | 0.1538 | 34.2572 | 5.57 (0.01) | -0.047 (0.015) | 48.20 (2.00) | 1.80 (1.00) | 0.0063 | 1.1374 |
| G35.20-1.74 0 | -1.7409 | 35.1997 | 5.17 (0.00) | -1.018 (0.008) | 43.37 (0.01) | 3.67 (0.02) | 0.0051 | 1.1374 |
| G35.20-1.74 1 | -1.7409 | 35.1997 | 5.17 (0.00) | -0.147 (0.008) | 36.67 (0.10) | 1.49 (0.27) | 0.0051 | 1.1374 |
| G35.20-1.74 2 | -1.7409 | 35.1997 | 5.17 (0.00) | -0.324 (0.008) | 14.08 (0.01) | 0.93 (0.03) | 0.0051 | 1.1374 |
| G35.20-1.74 3 | -1.7409 | 35.1997 | 5.17 (0.00) | -0.039 (0.008) | 50.59 (0.53) | 4.92 (1.31) | 0.0051 | 1.1374 |
| G35.57-0.03 0 | -0.0306 | 35.5779 | 0.47 (0.00) | -0.064 (0.009) | 52.10 (0.10) | 4.60 (0.30) | 0.0053 | 1.1374 |
| G35.57-0.03 1 | -0.0306 | 35.5779 | 0.47 (0.00) | -0.021 (0.009) | 45.60 (0.30) | 1.90 (0.60) | 0.0053 | 1.1374 |
| G35.57-0.03 2 | -0.0306 | 35.5779 | 0.47 (0.00) | -0.019 (0.009) | 57.60 (0.50) | 2.90 (0.97) | 0.0053 | 1.1374 |
| G35.57-0.03 3 | -0.0306 | 35.5779 | 0.47 (0.00) | -0.031 (0.009) | 12.80 (0.20) | 1.84 (0.41) | 0.0053 | 1.1374 |
| G35.57-0.03 4 | -0.0306 | 35.5779 | 0.47 (0.00) | -0.031 (0.008) | 29.04 (0.11) | 0.82 (0.25) | 0.0053 | 1.1374 |
| G35.58+0.07 0 | 0.0657 | 35.5801 | 0.53 (0.01) | -0.146 (0.004) | 49.37 (0.21) | 5.33 (0.34) | 0.0048 | 1.1374 |
| G35.58+0.07 1 | 0.0657 | 35.5801 | 0.53 (0.01) | -0.049 (0.013) | 53.13 (0.25) | 2.98 (0.64) | 0.0048 | 1.1374 |
| G35.58+0.07 2 | 0.0657 | 35.5801 | 0.53 (0.01) | -0.025 (0.004) | 58.12 (0.29) | 3.63 (0.74) | 0.0048 | 1.1374 |
| G35.58+0.07 3 | 0.0657 | 35.5801 | 0.53 (0.01) | -0.034 (0.004) | 13.24 (0.17) | 2.80 (0.39) | 0.0048 | 1.1374 |
| G37.87-0.40 0 | -0.3993 | 37.873 | 4.40 (0.01) | -0.531 (0.006) | 60.23 (0.11) | 8.73 (0.35) | 0.0069 | 1.1374 |
| G37.87-0.40 1 | -0.3993 | 37.873 | 4.40 (0.01) | -0.124 (0.014) | 53.27 (0.19) | 4.03 (0.46) | 0.0069 | 1.1374 |
| G37.87-0.40 2 | -0.3993 | 37.873 | 4.40 (0.01) | -0.356 (0.019) | 65.13 (0.04) | 2.74 (0.15) | 0.0069 | 1.1374 |
| G37.87-0.40 3 | -0.3993 | 37.873 | 4.40 (0.01) | -0.324 (0.045) | 72.18 (0.04) | 1.35 (0.14) | 0.0069 | 1.1374 |
| G37.87-0.40 4 | -0.3993 | 37.873 | 4.40 (0.01) | -0.424 (0.013) | 73.97 (0.13) | 3.01 (0.22) | 0.0069 | 1.1374 |
| G37.87-0.40 5 | -0.3993 | 37.873 | 4.40 (0.01) | -0.185 (0.012) | 79.98 (0.06) | 1.80 (0.14) | 0.0069 | 1.1374 |
| G37.87-0.40 6 | -0.3993 | 37.873 | 4.40 (0.01) | -0.114 (0.015) | 91.96 (0.08) | 1.21 (0.18) | 0.0069 | 1.1374 |
| G37.87-0.40 7 | -0.3993 | 37.873 | 4.40 (0.01) | -0.175 (0.012) | 14.32 (0.14) | 2.94 (0.20) | 0.0069 | 1.1374 |
| G37.87-0.40 8 | -0.3993 | 37.873 | 4.40 (0.01) | -0.072 (0.022) | 13.16 (0.10) | 0.87 (0.32) | 0.0069 | 1.1374 |
| G37.87-0.40 9 | -0.3993 | 37.873 | 4.40 (0.01) | -0.137 (0.012) | 20.54 (0.06) | 1.37 (0.14) | 0.0069 | 1.1374 |
| G43.89-0.78 0 | -0.7838 | 43.8892 | 0.66 (0.00) | -0.181 (0.004) | 54.86 (0.02) | 2.19 (0.06) | 0.0032 | 1.1374 |
| G43.89-0.78 1 | -0.7838 | 43.8892 | 0.66 (0.00) | -0.020 (0.002) | 50.55 (0.59) | 15.90 (1.20) | 0.0032 | 1.1374 |
| G45.07+0.13 0 | 0.1323 | 45.0711 | 0.47 (0.00) | -0.056 (0.006) | 57.49 (0.10) | 4.24 (0.23) | 0.0035 | 1.1374 |
| G45.07+0.13 1 | 0.1323 | 45.0711 | 0.47 (0.00) | -0.036 (0.006) | 65.44 (0.15) | 4.09 (0.34) | 0.0035 | 1.1374 |
| G45.12+0.13 0 | 0.1326 | 45.1223 | 4.28 (0.01) | -0.188 (0.006) | 55.70 (0.12) | 3.32 (0.24) | 0.0065 | 1.1374 |
| G45.12+0.13 1 | 0.1326 | 45.1223 | 4.28 (0.01) | -0.154 (0.009) | 59.40 (0.13) | 3.11 (0.33) | 0.0065 | 1.1374 |
| G45.12+0.13 2 | 0.1326 | 45.1223 | 4.28 (0.01) | -0.200 (0.010) | 24.86 (0.03) | 1.68 (0.08) | 0.0065 | 1.1374 |
| G45.12+0.13 3 | 0.1326 | 45.1223 | 4.28 (0.01) | -0.027 (0.004) | 65.53 (0.82) | 7.23 (2.03) | 0.0065 | 1.1374 |
| G45.45+0.06 0 | 0.0593 | 45.4548 | 4.77 (0.01) | -1.347 (0.018) | 59.58 (0.02) | 3.18 (0.05) | 0.0063 | 1.1374 |
| G45.45+0.06 1 | 0.0593 | 45.4548 | 4.77 (0.01) | -0.123 (0.040) | 55.34 (0.38) | 3.15 (0.38) | 0.0063 | 1.1374 |
| G45.45+0.06 2 | 0.0593 | 45.4548 | 4.77 (0.01) | -0.056 (0.005) | 25.02 (0.12) | 2.82 (0.28) | 0.0063 | 1.1374 |
| G45.47+0.05 0 | 0.0455 | 45.4655 | 0.75 (0.00) | -0.274 (0.003) | 60.62 (0.03) | 6.59 (0.07) | 0.0039 | 1.1374 |
| G45.47+0.05 1 | 0.0455 | 45.4655 | 0.75 (0.00) | -0.017 (0.004) | 25.55 (0.23) | 2.18 (0.55) | 0.0039 | 1.1374 |
| G48.61+0.02 0 | 0.0229 | 48.6055 | 1.01 (0.00) | -0.067 (0.003) | 18.08 (0.09) | 4.97 (0.22) | 0.0035 | 1.1374 |
| G48.61+0.02 1 | 0.0229 | 48.6055 | 1.01 (0.00) | -0.024 (0.005) | 6.08 (0.13) | 1.20 (0.31) | 0.0035 | 1.1374 |
| G48.61+0.02 2 | 0.0229 | 48.6055 | 1.01 (0.00) | -0.018 (0.003) | 53.73 (0.33) | 4.72 (0.79) | 0.0035 | 1.1374 |
| G50.32+0.68 0 | 0.6761 | 50.3153 | 0.24 (0.00) | -0.011 (0.003) | 26.28 (0.40) | 3.32 (0.94) | 0.0031 | 1.1374 |
| G60.88-0.13 0 | -0.1285 | 60.8826 | 0.66 (0.01) | -0.093 (0.009) | 22.60 (0.15) | 3.24 (0.35) | 0.0096 | 1.1374 |
| G61.48+0.09 0 | 0.0893 | 61.4769 | 6.16 (0.01) | -0.531 (0.009) | 21.45 (0.02) | 2.81 (0.06) | 0.0084 | 1.1374 |
| G69.54-0.98 0 | -0.9759 | 69.5398 | 0.28 (0.01) | -0.280 (0.006) | 10.65 (0.05) | 4.55 (0.11) | 0.0076 | 1.1374 |
| G70.29+1.60 0 | 1.6006 | 70.2927 | 4.37 (0.13) | -0.372 (0.008) | -21.74 (0.07) | 3.92 (0.15) | 0.0108 | 1.1374 |
| G70.29+1.60 1 | 1.6006 | 70.2927 | 4.37 (0.13) | -0.050 (0.007) | -27.17 (0.58) | 4.86 (1.33) | 0.0108 | 1.1374 |
| G70.33+1.59 0 | 1.589 | 70.3296 | 2.21 (0.01) | -1.201 (0.007) | -21.24 (0.01) | 3.65 (0.03) | 0.0115 | 1.1374 |
| IRAS 20051+3435 0 | 0.2088 | 32.4662 | 0.00 (0.01) | -0.019 (0.001) | 10.77 (0.07) | 3.60 (0.18) | 0.00071 | 2.2747 |
| G41.74+0.10 0 | 0.0975 | 41.7415 | 0.34 (0.00) | -0.062 (0.004) | 14.60 (0.09) | 2.56 (0.26) | 0.0033 | 1.1374 |
| G41.74+0.10 1 | 0.0975 | 41.7415 | 0.34 (0.00) | -0.020 (0.004) | 10.99 (0.29) | 2.52 (0.71) | 0.0033 | 1.1374 |
| G41.74+0.10 2 | 0.0975 | 41.7415 | 0.34 (0.00) | -0.066 (0.004) | 34.25 (0.05) | 1.63 (0.13) | 0.0033 | 1.1374 |
| G41.74+0.10 3 | 0.0975 | 41.7415 | 0.34 (0.00) | -0.022 (0.005) | 56.61 (0.13) | 1.15 (0.32) | 0.0033 | 1.1374 |
| G41.74+0.10 4 | 0.0975 | 41.7415 | 0.34 (0.00) | -0.043 (0.005) | 17.57 (0.07) | 1.13 (0.18) | 0.0033 | 1.1374 |
| IRDC 1923+13 0 | -0.4972 | 48.9325 | 0.40 (0.00) | -0.011 (0.001) | 50.20 (0.08) | 1.83 (0.19) | 0.0008 | 0.7582 |
| IRDC 1923+13 1 | -0.4972 | 48.9325 | 0.40 (0.00) | -0.009 (0.001) | 57.56 (0.09) | 2.57 (0.22) | 0.0008 | 0.7582 |
| IRDC 1923+13 2 | -0.4972 | 48.9325 | 0.40 (0.00) | -0.005 (0.001) | 47.32 (0.20) | 2.11 (0.51) | 0.0008 | 0.7582 |
| IRDC 1916+11 0 | -0.2923 | 45.666 | 0.00 (0.01) | -0.005 (0.001) | 25.94 (0.17) | 2.53 (0.41) | 0.00083 | 0.7582 |
| IRDC 1916+11 1 | -0.2923 | 45.666 | 0.00 (0.01) | -0.013 (0.001) | 55.91 (0.13) | 6.21 (0.34) | 0.00083 | 0.7582 |
| IRDC 1916+11 2 | -0.2923 | 45.666 | 0.00 (0.01) | -0.003 (0.001) | 48.85 (0.48) | 3.58 (1.13) | 0.00083 | 0.7582 |
| Source Name | 2cm Continuum | Peakaa The Upper Limit Flag is 1 when the measurement indicated is a upper limit on the line depth when there is a corresponding line detection. | Center | FWHM | RMSbbRMS in 1.011 km s-1 channels. |
|---|---|---|---|---|---|
| (Jy) | (Jy) | (km s-1) | (km s-1) | (Jy) | |
| G32.80+0.19 0 | 3.68 (0.02) | -0.519 (0.032) | 15.65 (0.03) | 5.72 (0.08) | 0.0038 |
| G32.80+0.19 1 | 3.68 (0.02) | -0.076 (0.019) | 11.90 (1.18) | 8.17 (0.98) | 0.0038 |
| G32.80+0.19 2 | 3.68 (0.02) | -0.016 (0.001) | 80.47 (0.14) | 4.35 (0.36) | 0.0038 |
| G32.80+0.19 3 | 3.68 (0.02) | -0.065 (0.002) | 84.96 (0.02) | 1.29 (0.05) | 0.0038 |
| G32.80+0.19 4 | 3.68 (0.02) | -0.026 (0.001) | 88.83 (0.06) | 2.31 (0.14) | 0.0038 |
| G33.13-0.09 0 | 0.47 (0.02) | -0.224 (0.003) | 76.17 (0.02) | 3.31 (0.05) | 0.003 |
| G33.13-0.09 1 | 0.47 (0.02) | 0.000 (0.000) | 0.00 (0.00) | 0.00 (0.00) | 0.003 |
| G33.13-0.09 2 | 0.47 (0.02) | 0.000 (0.000) | 0.00 (0.00) | 0.00 (0.00) | 0.003 |
| G33.13-0.09 3 | 0.47 (0.02) | 0.000 (0.000) | 0.00 (0.00) | 0.00 (0.00) | 0.003 |
| G33.92+0.11 0 | 0.87 (0.02) | -0.086 (0.003) | 106.43 (0.03) | 2.17 (0.09) | 0.0032 |
| G33.92+0.11 1 | 0.87 (0.02) | -0.069 (0.002) | 108.83 (0.11) | 6.82 (0.16) | 0.0032 |
| G33.92+0.11 2 | 0.87 (0.02) | 0.000 (0.000) | 0.00 (0.00) | 0.00 (0.00) | 0.0032 |
| G34.26+0.15 0 | 5.89 (0.02) | -1.356 (0.006) | 60.99 (0.01) | 3.96 (0.02) | 0.0051 |
| G34.26+0.15 1 | 5.89 (0.02) | -0.046 (0.003) | 27.11 (0.04) | 1.03 (0.09) | 0.0051 |
| G34.26+0.15 2 | 5.89 (0.02) | -0.018 (0.002) | 11.23 (0.16) | 3.19 (0.38) | 0.0051 |
| G34.26+0.15 3 | 5.89 (0.02) | -0.025 (0.004) | 52.82 (0.58) | 6.34 (1.53) | 0.0051 |
| G34.26+0.15 4 | 5.89 (0.02) | -0.018 (0.007) | 47.05 (0.47) | 2.47 (1.15) | 0.0051 |
| G35.20-1.74 0 | 5.98 (0.03) | -0.482 (0.004) | 43.38 (0.02) | 3.71 (0.04) | 0.0055 |
| G35.20-1.74 1 | 5.98 (0.03) | -0.028 (0.005) | 37.91 (0.32) | 3.46 (0.76) | 0.0055 |
| G35.20-1.74 2 | 5.98 (0.03) | -0.056 (0.003) | 14.18 (0.02) | 1.00 (0.05) | 0.0055 |
| G35.20-1.74 3 | 5.98 (0.03) | 0.000 (0.000) | 0.00 (0.00) | 0.00 (0.00) | 0.0055 |
| G35.57-0.03 0 | 0.32 (0.15) | -0.075 (0.003) | 52.14 (0.09) | 4.39 (0.21) | 0.0046 |
| G35.57-0.03 1 | 0.32 (0.15) | -0.015 (0.006) | 47.39 (0.25) | 1.31 (0.60) | 0.0046 |
| G35.57-0.03 2 | 0.32 (0.15) | 0.000 (0.000) | 0.00 (0.00) | 0.00 (0.00) | 0.0046 |
| G35.57-0.03 3 | 0.32 (0.15) | 0.000 (0.000) | 0.00 (0.00) | 0.00 (0.00) | 0.0046 |
| G35.57-0.03 4 | 0.32 (0.15) | -0.024 (0.008) | 29.25 (0.11) | 0.43 (0.15) | 0.0046 |
| G35.58+0.07 0 | 0.23 (0.09) | -0.106 (0.002) | 49.21 (0.06) | 5.00 (0.14) | 0.0031 |
| G35.58+0.07 1 | 0.23 (0.09) | 0.000 (0.004) | 0.00 (0.00) | 0.00 (0.00) | 0.0031 |
| G35.58+0.07 2 | 0.23 (0.09) | 0.000 (0.004) | 0.00 (0.00) | 0.00 (0.00) | 0.0031 |
| G35.58+0.07 3 | 0.23 (0.09) | 0.000 (0.004) | 0.00 (0.00) | 0.00 (0.00) | 0.0031 |
| G37.87-0.40 0 | 3.73 (0.02) | -0.221 (0.003) | 59.99 (0.12) | 8.53 (0.14) | 0.0048 |
| G37.87-0.40 1 | 3.73 (0.02) | -0.045 (0.007) | 54.55 (0.25) | 5.99 (0.34) | 0.0048 |
| G37.87-0.40 2 | 3.73 (0.02) | -0.036 (0.007) | 65.06 (0.11) | 2.57 (0.45) | 0.0048 |
| G37.87-0.40 3 | 3.73 (0.02) | -0.053 (0.003) | 72.44 (0.05) | 1.37 (0.08) | 0.0048 |
| G37.87-0.40 4 | 3.73 (0.02) | -0.047 (0.002) | 74.25 (0.07) | 2.07 (0.18) | 0.0048 |
| G37.87-0.40 5 | 3.73 (0.02) | -0.016 (0.001) | 80.04 (0.03) | 1.28 (0.07) | 0.0048 |
| G37.87-0.40 6 | 3.73 (0.02) | -0.010 (0.002) | 91.99 (0.12) | 1.60 (0.28) | 0.0048 |
| G37.87-0.40 7 | 3.73 (0.02) | -0.026 (0.002) | 14.89 (0.12) | 1.40 (0.20) | 0.0048 |
| G37.87-0.40 8 | 3.73 (0.02) | -0.017 (0.002) | 13.29 (0.19) | 1.52 (0.34) | 0.0048 |
| G37.87-0.40 9 | 3.73 (0.02) | -0.017 (0.001) | 20.52 (0.10) | 3.09 (0.23) | 0.0048 |
| G43.89-0.78 0 | 0.53 (0.02) | -0.059 (0.004) | 54.61 (0.08) | 2.85 (0.23) | 0.003 |
| G43.89-0.78 1 | 0.53 (0.02) | -0.015 (0.002) | 49.59 (0.94) | 14.49 (1.69) | 0.003 |
| G45.07+0.13 0 | 0.79 (0.07) | -0.073 (0.003) | 57.18 (0.08) | 3.45 (0.18) | 0.0029 |
| G45.07+0.13 1 | 0.79 (0.07) | -0.011 (0.003) | 65.67 (0.42) | 3.46 (0.98) | 0.0029 |
| G45.12+0.13 0 | 5.20 (0.20) | -0.086 (0.002) | 56.21 (0.11) | 5.22 (0.21) | 0.0044 |
| G45.12+0.13 1 | 5.20 (0.20) | -0.059 (0.005) | 59.70 (0.06) | 2.42 (0.16) | 0.0044 |
| G45.12+0.13 2 | 5.20 (0.20) | -0.047 (0.002) | 25.14 (0.04) | 1.55 (0.09) | 0.0044 |
| G45.12+0.13 3 | 5.20 (0.20) | -0.021 (0.001) | 64.68 (0.39) | 8.15 (0.87) | 0.0044 |
| G45.45+0.06 0 | 3.16 (0.02) | -0.260 (0.003) | 59.58 (0.01) | 2.06 (0.03) | 0.0043 |
| G45.45+0.06 1 | 3.16 (0.02) | -0.042 (0.002) | 57.90 (0.14) | 9.40 (0.31) | 0.0043 |
| G45.45+0.06 2 | 3.16 (0.02) | 0.000 (0.000) | 0.00 (0.00) | 0.00 (0.00) | 0.0043 |
| G45.47+0.05 0 | 0.38 (0.02) | -0.124 (0.003) | 61.67 (0.07) | 5.85 (0.17) | 0.0049 |
| G45.47+0.05 1 | 0.38 (0.02) | -0.000 (0.007) | 0.00 (0.00) | 0.00 (0.00) | 0.0049 |
| G48.61+0.02 0 | 0.41 (0.02) | -0.022 (0.003) | 18.50 (0.25) | 4.39 (0.59) | 0.0033 |
| G48.61+0.02 1 | 0.41 (0.02) | -0.000 (0.000) | 0.00 (0.00) | 0.00 (0.00) | 0.0033 |
| G48.61+0.02 2 | 0.41 (0.02) | -0.005 (0.002) | 52.50 (1.25) | 7.47 (2.94) | 0.0033 |
| G50.32+0.68 0 | 0.16 (0.02) | -0.011 (0.003) | 26.21 (0.44) | 3.10 (1.03) | 0.0036 |
| G60.88-0.13 0 | 0.29 (0.02) | -0.016 (0.003) | 21.63 (0.21) | 2.47 (0.50) | 0.003 |
| G61.48+0.09 0 | 3.42 (0.02) | -0.300 (0.004) | 21.40 (0.02) | 2.39 (0.04) | 0.0037 |
| G69.54-0.98 0 | 0.23 (0.02) | -0.220 (0.002) | 9.97 (0.03) | 5.81 (0.08) | 0.0031 |
| G70.29+1.60 0 | 6.21 (0.02) | -0.159 (0.003) | -23.52 (0.06) | 5.36 (0.13) | 0.0046 |
| G70.29+1.60 1 | 6.21 (0.02) | -0.000 (0.000) | -0.00 (0.00) | 0.00 (0.00) | 0.0046 |
| G70.33+1.59 0 | 2.68 (0.02) | -1.081 (0.005) | -21.17 (0.01) | 2.95 (0.01) | 0.0038 |
| IRAS 20051+3435 0 | 0.00 (0.02) | -0.016 (0.003) | 11.51 (0.37) | 4.14 (0.88) | 0.0032 |
| G41.74+0.10 0 | 0.28 (0.02) | -0.014 (0.002) | 14.36 (0.34) | 3.80 (0.80) | 0.0032 |
| G41.74+0.10 1 | 0.28 (0.02) | 0.000 (0.004) | 0.00 (0.00) | 0.00 (0.00) | 0.0032 |
| G41.74+0.10 2 | 0.28 (0.02) | 0.000 (0.004) | 0.00 (0.00) | 0.00 (0.00) | 0.0032 |
| G41.74+0.10 3 | 0.28 (0.02) | 0.000 (0.004) | 0.00 (0.00) | 0.00 (0.00) | 0.0032 |
| G41.74+0.10 4 | 0.28 (0.02) | 0.000 (0.004) | 0.00 (0.00) | 0.00 (0.00) | 0.0032 |
| IRDC 1923+13 0 | 0.00 (0.02) | 0.000 (0.000) | 0.00 (0.00) | 0.00 (0.00) | 0.0032 |
| IRDC 1923+13 1 | 0.00 (0.02) | 0.000 (0.000) | 0.00 (0.00) | 0.00 (0.00) | 0.0032 |
| IRDC 1923+13 2 | 0.00 (0.02) | 0.000 (0.000) | 0.00 (0.00) | 0.00 (0.00) | 0.0032 |
| IRDC 1916+11 0 | 0.00 (0.02) | 0.000 (0.000) | 0.00 (0.00) | 0.00 (0.00) | 0.0048 |
| IRDC 1916+11 1 | 0.00 (0.02) | 0.000 (0.000) | 0.00 (0.00) | 0.00 (0.00) | 0.0048 |
| IRDC 1916+11 2 | 0.00 (0.02) | 0.000 (0.000) | 0.00 (0.00) | 0.00 (0.00) | 0.0048 |
| Source Name | Distance | Galactocentric | KDAaaThe Kinematic Distance Ambiguity described in Section 5.3. | Source | ScenariobbScenario or scenarios most likely to be consistent with the observed spectrum, as described in Section 6.3. In some cases, the spectrum was consistent with multiple scenarios or some blend of multiple scenarios. In others, the source could not be classified, in which case it is marked with -1 in this column. | ||
|---|---|---|---|---|---|---|---|
| Distance | Resolution | Type | Spectrum | ||||
| (kpc) | (kpc) | (Jy) | Type | ||||
| G32.80+0.19 0 | 12.9 | 7.4 | far | 6.94 | UCHII | red gradient | 2+3 |
| G32.80+0.19 1 | 13.1 | 7.6 | far | 6.94 | UCHII | envelope | 2+3 |
| G32.80+0.19 2 | 9.4 | 5.1 | far | 6.94 | GMC | - | 2+3 |
| G32.80+0.19 3 | 9.2 | 5.0 | far | 6.94 | GMC | - | 2+3 |
| G32.80+0.19 4 | 9.0 | 4.9 | far | 6.94 | GMC | - | 2+3 |
| G33.13-0.09 0 | 9.6 | 5.2 | far | 2.26 | UCHII | red gradient | 2 |
| G33.13-0.09 1 | 9.3 | 5.1 | far | 2.26 | GMC | envelope | 2 |
| G33.13-0.09 2 | 7.1 | 4.7 | tangent | 2.26 | GMC | - | 2 |
| G33.13-0.09 3 | 0.9 | 7.6 | near | 2.26 | GMC | - | 2 |
| G33.92+0.11 0 | 7.0 | 4.6 | tangent | 3.86 | UCHII | red gradient | 2 |
| G33.92+0.11 1 | 7.0 | 4.6 | tangent | 3.86 | UCHII | envelope | 2 |
| G33.92+0.11 2 | 3.6 | 5.8 | near | 3.86 | GMC | - | 2 |
| G34.26+0.15 0 | 3.6 | 5.7 | near | 35.69 | UCHII | red gradient | 2 |
| G34.26+0.15 1 | 1.9 | 6.9 | near | 35.69 | GMC | - | 2 |
| G34.26+0.15 2 | 1.0 | 7.6 | near | 35.69 | GMC | - | 2 |
| G34.26+0.15 3 | 3.6 | 6.0 | near | 35.69 | GMC | envelope | 2 |
| G34.26+0.15 4 | 3.6 | 6.1 | near | 35.69 | GMC | - | 2 |
| G35.20-1.74 0 | 2.8 | 6.3 | near | - | UCHII | single | 4 |
| G35.20-1.74 1 | 2.5 | 6.5 | near | - | GMC | - | 4 |
| G35.20-1.74 2 | 1.1 | 7.5 | near | - | GMC | - | 4 |
| G35.20-1.74 3 | 3.2 | 6.1 | near | - | GMC | - | 4 |
| G35.57-0.03 0 | 10.3 | 6.0 | far | 2.57 | UCHII | single | 2+3 |
| G35.57-0.03 1 | 10.7 | 6.2 | far | 2.57 | GMC | - | 2+3 |
| G35.57-0.03 2 | 3.6 | 5.9 | near | 2.57 | GMC | - | 2+3 |
| G35.57-0.03 3 | 1.1 | 7.6 | near | 2.57 | GMC | - | 2+3 |
| G35.57-0.03 4 | 2.0 | 6.8 | near | 2.57 | GMC | - | 2+3 |
| G35.58+0.07 0 | 10.5 | 6.1 | far | 1.44 | UCHII | blue gradient | 2 |
| G35.58+0.07 1 | 10.3 | 6.0 | far | 1.44 | UCHII | - | 2 |
| G35.58+0.07 2 | 3.6 | 5.8 | near | 1.44 | GMC | - | 2 |
| G35.58+0.07 3 | 1.1 | 7.5 | near | 1.44 | GMC | - | 2 |
| G37.87-0.40 0 | 9.4 | 5.9 | far | 4.14 | UCHII | blue gradient | 1 |
| G37.87-0.40 1 | 9.8 | 6.1 | far | 4.14 | UCHII | blue gradient | 1 |
| G37.87-0.40 2 | 9.2 | 5.7 | far | 4.14 | UCHII | blue gradient | 1 |
| G37.87-0.40 3 | 8.7 | 5.6 | far | 4.14 | GMC | - | 1 |
| G37.87-0.40 4 | 8.6 | 5.5 | far | 4.14 | GMC | - | 1 |
| G37.87-0.40 5 | 8.1 | 5.4 | far | 4.14 | GMC | - | 1 |
| G37.87-0.40 6 | 6.6 | 5.1 | tangent | 4.14 | GMC | - | 1 |
| G37.87-0.40 7 | 1.2 | 7.5 | near | 4.14 | GMC | - | 1 |
| G37.87-0.40 8 | 1.1 | 7.6 | near | 4.14 | GMC | - | 1 |
| G37.87-0.40 9 | 1.5 | 7.2 | near | 4.14 | GMC | - | 1 |
| G43.89-0.78 0 | 8.3 | 6.2 | far | - | UCHII | blue gradient | 3 |
| G43.89-0.78 1 | 8.6 | 6.3 | far | - | GMC | envelope | 3 |
| G45.07+0.13 0 | 7.6 | 6.2 | far | 4.26 | UCHII | single | 2 |
| G45.07+0.13 1 | 6.5 | 6.0 | far | 4.26 | GMC | - | 2 |
| G45.12+0.13 0 | 7.4 | 6.2 | far | 6.78 | UCHII | other | 1 |
| G45.12+0.13 1 | 7.4 | 6.1 | far | 6.78 | UCHII | envelope | 1 |
| G45.12+0.13 2 | 1.9 | 7.2 | near | 6.78 | GMC | - | 1 |
| G45.12+0.13 3 | 7.4 | 6.0 | far | 6.78 | GMC | envelope | 1 |
| G45.45+0.06 0 | 7.2 | 6.1 | far | 3.71 | UCHII | blue gradient | 2 |
| G45.45+0.06 1 | 7.6 | 6.2 | far | 3.71 | GMC | envelope | 2 |
| G45.45+0.06 2 | 1.9 | 7.2 | near | 3.71 | GMC | - | 2 |
| G45.47+0.05 0 | 7.1 | 6.1 | far | 3.34 | UCHII | red gradient | 1+2+3 |
| G45.47+0.05 1 | 1.9 | 7.2 | near | 3.34 | GMC | - | 1+2+3 |
| G48.61+0.02 0 | 9.6 | 7.5 | far | 2.20 | UCHII | red gradient | 2+3 |
| G48.61+0.02 1 | 0.7 | 8.0 | near | 2.20 | GMC | - | 2+3 |
| G48.61+0.02 2 | 6.5 | 6.4 | far | 2.20 | GMC | - | 2+3 |
| G50.32+0.68 0 | 2.1 | 7.2 | near | - | UCHII | - | 1 |
| G60.88-0.13 0 | 2.8 | 7.4 | near | 4.90 | UCHII | limit | 2 |
| G61.48+0.09 0 | 5.2 | 7.5 | far | 7.86 | UCHII | single | 4 |
| G69.54-0.98 0 | 2.57 | 7.9 | tangent | - | UCHII | thick | 4+5 |
| G70.29+1.60 0 | 7.3 | 9.1 | far | - | UCHII | blue gradient | 2 |
| G70.29+1.60 1 | 7.8 | 9.3 | far | - | GMC | envelope | 2 |
| G70.33+1.59 0 | 7.3 | 9.1 | far | - | UCHII | single | 1+2 |
| IRAS 20051+3435 0 | 2.6 | 7.6 | tangent | - | GMC | limit | -1 |
| G41.74+0.10 0 | 11.3 | 7.6 | far | 0.56 | UCHII | limit | -1 |
| G41.74+0.10 1 | 11.6 | 7.7 | far | 0.56 | UCHII | - | -1 |
| G41.74+0.10 2 | 2.4 | 6.8 | near | 0.56 | GMC | - | -1 |
| G41.74+0.10 3 | 3.8 | 6.1 | near | 0.56 | GMC | - | -1 |
| G41.74+0.10 4 | 11.2 | 7.4 | far | 0.56 | UCHII | - | -1 |
| IRDC 1923+13 0 | 4.2 | 6.5 | near | - | GMC | limit | -1 |
| IRDC 1923+13 1 | 5.5 | 6.3 | tangent | - | GMC | - | -1 |
| IRDC 1923+13 2 | 3.8 | 6.6 | near | - | GMC | - | -1 |
| IRDC 1916+11 0 | 2.0 | 7.2 | near | - | GMC | limit | -1 |
| IRDC 1916+11 1 | 4.2 | 6.2 | near | - | GMC | - | -1 |
| IRDC 1916+11 2 | 3.6 | 6.4 | near | - | GMC | - | -1 |
| Source Name | (FFC) | (FFC) | 2-2 Upper | 2cm AreaaaThe beam area is 2747.75″2, which is used when the CMB is the only background continuum illumination | 6cm Area aaThe beam area is 2747.75″2, which is used when the CMB is the only background continuum illumination | FFC Error | ||
|---|---|---|---|---|---|---|---|---|
| Limit Flag | ″2 | ″2 | ||||||
| G32.80+0.19 0 | 0.18 (0.055) | 0.2 (0.059) | 0.12 (0.024) | 0.15 (0.031) | 0 | 88.0 | 226.2 | 0.1 |
| G32.80+0.19 1 | 0.04 (0.013) | 0.043 (0.013) | 0.016 (0.0051) | 0.021 (0.0065) | 0 | 88.0 | 226.2 | 0.1 |
| G32.80+0.19 2 | 0.027 (0.0089) | 0.029 (0.0095) | 0.0033 (0.00069) | 0.0042 (0.00088) | 0 | 88.0 | 226.2 | 0.1 |
| G32.80+0.19 3 | 0.11 (0.035) | 0.12 (0.037) | 0.014 (0.0028) | 0.018 (0.0035) | 0 | 88.0 | 226.2 | 0.1 |
| G32.80+0.19 4 | 0.039 (0.012) | 0.042 (0.013) | 0.0055 (0.0011) | 0.0071 (0.0014) | 0 | 88.0 | 226.2 | 0.1 |
| G33.13-0.09 0 | 0.34 (0.1) | 0.49 (0.15) | 0.16 (0.032) | 0.63 (0.12) | 0 | 33.5 | 33.5 | 0.2 |
| G33.13-0.09 1 | 0.035 (0.015) | 0.047 (0.02) | 0 (0.0059) | 0 (0.0031) | 1 | 33.5 | 33.5 | 0.2 |
| G33.13-0.09 2 | 0.062 (0.022) | 0.084 (0.029) | 0 (0.0059) | 0 (0.0031) | 1 | 33.5 | 33.5 | 0.2 |
| G33.13-0.09 3 | 0.061 (0.021) | 0.082 (0.028) | 0 (0.0059) | 0 (0.0031) | 1 | 33.5 | 33.5 | 0.2 |
| G33.92+0.11 0 | 0.084 (0.027) | 0.1 (0.031) | 0.045 (0.0091) | 0.094 (0.018) | 0 | 214.0 | 214.0 | 0.2 |
| G33.92+0.11 1 | 0.082 (0.026) | 0.098 (0.031) | 0.036 (0.0072) | 0.075 (0.014) | 0 | 214.0 | 214.0 | 0.2 |
| G33.92+0.11 2 | 0.17 (0.062) | 0.21 (0.074) | 0 (0.0049) | 0 (0.0031) | 1 | 214.0 | 214.0 | 0.2 |
| G34.26+0.15 0 | 0.38 (0.12) | 0.4 (0.12) | 0.22 (0.043) | 0.26 (0.052) | 0 | 10.9 | 10.9 | 0.2 |
| G34.26+0.15 1 | 0.028 (0.0089) | 0.029 (0.0092) | 0.0067 (0.0014) | 0.0079 (0.0017) | 0 | 10.9 | 10.9 | 0.2 |
| G34.26+0.15 2 | 0.017 (0.0059) | 0.018 (0.006) | 0.0026 (0.00059) | 0.0031 (0.0007) | 0 | 10.9 | 10.9 | 0.2 |
| G34.26+0.15 3 | 0.022 (0.0072) | 0.023 (0.0074) | 0.0036 (0.00092) | 0.0043 (0.0011) | 0 | 10.9 | 10.9 | 0.2 |
| G34.26+0.15 4 | 0.0082 (0.0036) | 0.0085 (0.0037) | 0.0026 (0.0011) | 0.003 (0.0013) | 0 | 10.9 | 10.9 | 0.2 |
| G35.20-1.74 0 | 0.21 (0.063) | 0.22 (0.066) | 0.071 (0.014) | 0.084 (0.017) | 0 | 39.5 | 39.5 | 0.2 |
| G35.20-1.74 1 | 0.028 (0.0085) | 0.029 (0.0088) | 0.0039 (0.0011) | 0.0046 (0.0013) | 0 | 39.5 | 39.5 | 0.2 |
| G35.20-1.74 2 | 0.063 (0.019) | 0.065 (0.019) | 0.008 (0.0017) | 0.0095 (0.0019) | 0 | 39.5 | 39.5 | 0.2 |
| G35.20-1.74 3 | 0.0073 (0.0027) | 0.0075 (0.0028) | 0 (0.0023) | 0 (0.0031) | 1 | 39.5 | 39.5 | 0.2 |
| G35.57-0.03 0 | 0.11 (0.035) | 0.15 (0.049) | 0.056 (0.011) | 0.26 (0.054) | 0 | 6.7 | 6.7 | 0.1 |
| G35.57-0.03 1 | 0.034 (0.018) | 0.046 (0.024) | 0.011 (0.0047) | 0.047 (0.02) | 0 | 6.7 | 6.7 | 0.1 |
| G35.57-0.03 2 | 0.03 (0.017) | 0.042 (0.023) | 0 (0.0099) | 0 (0.019) | 1 | 6.7 | 6.7 | 0.1 |
| G35.57-0.03 3 | 0.05 (0.021) | 0.069 (0.029) | 0 (0.0099) | 0 (0.019) | 1 | 6.7 | 6.7 | 0.1 |
| G35.57-0.03 4 | 0.051 (0.02) | 0.069 (0.028) | 0.017 (0.0065) | 0.077 (0.029) | 0 | 6.7 | 6.7 | 0.1 |
| G35.58+0.07 0 | 0.24 (0.071) | 0.32 (0.097) | 0.085 (0.017) | 0.61 (0.12) | 0 | 2.1 | 2.1 | 0.2 |
| G35.58+0.07 1 | 0.072 (0.029) | 0.096 (0.038) | 0 (0.0072) | 0 (0.019) | 1 | 2.1 | 2.1 | 0.2 |
| G35.58+0.07 2 | 0.037 (0.012) | 0.049 (0.016) | 0 (0.0072) | 0 (0.019) | 1 | 2.1 | 2.1 | 0.2 |
| G35.58+0.07 3 | 0.05 (0.016) | 0.066 (0.021) | 0 (0.0072) | 0 (0.01) | 1 | 2.1 | 2.1 | 0.2 |
| G37.87-0.40 0 | 0.12 (0.037) | 0.13 (0.038) | 0.047 (0.0095) | 0.061 (0.012) | 0 | 27.5 | 170.9 | 0.2 |
| G37.87-0.40 1 | 0.028 (0.0089) | 0.029 (0.0092) | 0.0095 (0.0024) | 0.012 (0.0031) | 0 | 27.5 | 170.9 | 0.2 |
| G37.87-0.40 2 | 0.081 (0.025) | 0.084 (0.026) | 0.0075 (0.0021) | 0.0096 (0.0027) | 0 | 27.5 | 170.9 | 0.2 |
| G37.87-0.40 3 | 0.074 (0.024) | 0.076 (0.025) | 0.011 (0.0023) | 0.014 (0.003) | 0 | 27.5 | 170.9 | 0.2 |
| G37.87-0.40 4 | 0.097 (0.029) | 0.1 (0.03) | 0.0098 (0.002) | 0.013 (0.0026) | 0 | 27.5 | 170.9 | 0.2 |
| G37.87-0.40 5 | 0.041 (0.013) | 0.043 (0.013) | 0.0033 (0.00068) | 0.0043 (0.00087) | 0 | 27.5 | 170.9 | 0.2 |
| G37.87-0.40 6 | 0.025 (0.0083) | 0.026 (0.0086) | 0.0021 (0.00052) | 0.0026 (0.00066) | 0 | 27.5 | 170.9 | 0.2 |
| G37.87-0.40 7 | 0.039 (0.012) | 0.04 (0.012) | 0.0054 (0.0012) | 0.0069 (0.0015) | 0 | 27.5 | 170.9 | 0.2 |
| G37.87-0.40 8 | 0.016 (0.0069) | 0.016 (0.0071) | 0.0035 (0.00081) | 0.0046 (0.001) | 0 | 27.5 | 170.9 | 0.2 |
| G37.87-0.40 9 | 0.03 (0.0095) | 0.031 (0.0098) | 0.0035 (0.00073) | 0.0045 (0.00094) | 0 | 27.5 | 170.9 | 0.2 |
| G43.89-0.78 0 | 0.25 (0.074) | 0.32 (0.096) | 0.037 (0.0078) | 0.12 (0.024) | 0 | 13.5 | 13.5 | 0.1 |
| G43.89-0.78 1 | 0.025 (0.0077) | 0.031 (0.0097) | 0.0097 (0.0022) | 0.029 (0.0067) | 0 | 13.5 | 13.5 | 0.1 |
| G45.07+0.13 0 | 0.092 (0.029) | 0.13 (0.04) | 0.04 (0.0081) | 0.096 (0.02) | 0 | 2.5 | 2.5 | 0.2 |
| G45.07+0.13 1 | 0.058 (0.02) | 0.08 (0.027) | 0.0061 (0.0019) | 0.014 (0.0045) | 0 | 2.5 | 2.5 | 0.2 |
| G45.12+0.13 0 | 0.043 (0.013) | 0.045 (0.013) | 0.014 (0.0028) | 0.017 (0.0033) | 0 | 15.4 | 516.6 | 0.2 |
| G45.12+0.13 1 | 0.035 (0.011) | 0.036 (0.011) | 0.0095 (0.002) | 0.011 (0.0025) | 0 | 15.4 | 516.6 | 0.2 |
| G45.12+0.13 2 | 0.046 (0.014) | 0.048 (0.014) | 0.0075 (0.0015) | 0.009 (0.0019) | 0 | 15.4 | 516.6 | 0.2 |
| G45.12+0.13 3 | 0.006 (0.002) | 0.0062 (0.0021) | 0.0033 (0.00068) | 0.004 (0.00082) | 0 | 15.4 | 516.6 | 0.2 |
| G45.45+0.06 0 | 0.32 (0.096) | 0.32 (0.095) | 0.063 (0.013) | 0.069 (0.012) | 0 | 1963.0 | 1963.0 | 0.2 |
| G45.45+0.06 1 | 0.025 (0.011) | 0.026 (0.011) | 0.01 (0.0021) | 0.011 (0.0019) | 0 | 1963.0 | 1963.0 | 0.2 |
| G45.45+0.06 2 | 0.011 (0.0036) | 0.012 (0.0035) | 0 (0.0031) | 0 (0.01) | 1 | 1963.0 | 1963.0 | 0.2 |
| G45.47+0.05 0 | 0.35 (0.11) | 0.45 (0.14) | 0.089 (0.018) | 0.39 (0.079) | 0 | 3.0 | 3.0 | 0.2 |
| G45.47+0.05 1 | 0.018 (0.0068) | 0.023 (0.0084) | 0 (0.01) | 0 (0.01) | 1 | 3.0 | 3.0 | 0.2 |
| G48.61+0.02 0 | 0.058 (0.018) | 0.068 (0.021) | 0.015 (0.0034) | 0.053 (0.012) | 0 | 25.5 | 25.5 | 0.2 |
| G48.61+0.02 1 | 0.02 (0.0075) | 0.023 (0.0088) | 0 (0.0067) | 0 (0.0026) | 1 | 25.5 | 25.5 | 0.2 |
| G48.61+0.02 2 | 0.016 (0.0052) | 0.018 (0.0061) | 0.0033 (0.0013) | 0.012 (0.0046) | 0 | 25.5 | 25.5 | 0.2 |
| G50.32+0.68 0 | 0.027 (0.01) | 0.045 (0.017) | 0.0089 (0.0031) | 0.058 (0.019) | 0 | 108.0 | 108.0 | 0.2 |
| G60.88-0.13 0 | 0.12 (0.037) | 0.14 (0.043) | 0.011 (0.0031) | 0.031 (0.0071) | 0 | 615.0 | 615.0 | 0.2 |
| G61.48+0.09 0 | 0.088 (0.026) | 0.09 (0.027) | 0.069 (0.014) | 0.088 (0.017) | 0 | 355.0 | 355.0 | 0.2 |
| G69.54-0.98 0 | 0.98 (0.29) | 5.7 (1.7) | 0.18 (0.037) | 2.9 (0.57) | 0 | 0.5 | 0.5 | 0.2 |
| G70.29+1.60 0 | 0.086 (0.026) | 0.089 (0.027) | 0.022 (0.0044) | 0.026 (0.0052) | 0 | 52.8 | 52.8 | 0.1 |
| G70.29+1.60 1 | 0.011 (0.0037) | 0.012 (0.0038) | 0 (0.0019) | 0 (0.0026) | 1 | 52.8 | 52.8 | 0.1 |
| G70.33+1.59 0 | 0.7 (0.21) | 0.78 (0.24) | 0.34 (0.068) | 0.52 (0.1) | 0 | 16.4 | 16.4 | 0.1 |
| IRAS 20051+3435 0 | 0.12 (0.036) | 0.13 (0.014) | 0.015 (0.0041) | 0.016 (0.0034) | 0 | 2747.75 | 2747.75 | 0.0 |
| G41.74+0.10 0 | 0.13 (0.04) | 0.2 (0.06) | 0.01 (0.0027) | 0.045 (0.012) | 0 | 75.2 | 75.2 | 0.2 |
| G41.74+0.10 1 | 0.04 (0.014) | 0.06 (0.021) | 0 (0.0071) | 0 (0.0026) | 1 | 75.2 | 75.2 | 0.2 |
| G41.74+0.10 2 | 0.14 (0.043) | 0.21 (0.065) | 0 (0.0071) | 0 (0.0026) | 1 | 75.2 | 75.2 | 0.2 |
| G41.74+0.10 3 | 0.045 (0.017) | 0.067 (0.025) | 0 (0.0071) | 0 (0.0026) | 1 | 75.2 | 75.2 | 0.2 |
| G41.74+0.10 4 | 0.089 (0.029) | 0.13 (0.043) | 0 (0.0071) | 0 (0.0028) | 1 | 75.2 | 75.2 | 0.2 |
| IRDC 1923+13 0 | 0.02 (0.0062) | 0.02 (0.0047) | 0 (0.009) | 0 (0.0028) | 1 | 2747.75 | 2747.75 | 0.0 |
| IRDC 1923+13 1 | 0.016 (0.0051) | 0.017 (0.0038) | 0 (0.009) | 0 (0.0028) | 1 | 2747.75 | 2747.75 | 0.0 |
| IRDC 1923+13 2 | 0.0081 (0.0028) | 0.0083 (0.0023) | 0 (0.009) | 0 (0.0028) | 1 | 2747.75 | 2747.75 | 0.0 |
| IRDC 1916+11 0 | 0.033 (0.011) | 0.036 (0.0062) | 0 (0.014) | 0 (0.042) | 1 | 2747.75 | 2747.75 | 0.0 |
| IRDC 1916+11 1 | 0.082 (0.025) | 0.089 (0.0095) | 0 (0.014) | 0 (0.042) | 1 | 2747.75 | 2747.75 | 0.0 |
| IRDC 1916+11 2 | 0.017 (0.0064) | 0.018 (0.0046) | 0 (0.014) | 0 (0.042) | 1 | 2747.75 | 2747.75 | 0.0 |
| Source Name | N()aaThe values used in this paper are shown in boldface. Uncorrected values are listed in this column. The filling-factor corrected values are shown for comparison in the next column even though they were not used for analysis. | N() (FFC)bbThe values used in this paper are shown in boldface. Filling-factor corrected values are listed in this column. The uncorrected values are shown for comparison in the previous column even though they not used for analysis. | n() aaThe values used in this paper are shown in boldface. Uncorrected values are listed in this column. The filling-factor corrected values are shown for comparison in the next column even though they were not used for analysis. | n() (FFC)bbThe values used in this paper are shown in boldface. Filling-factor corrected values are listed in this column. The uncorrected values are shown for comparison in the previous column even though they not used for analysis. | XaaThe values used in this paper are shown in boldface. Uncorrected values are listed in this column. The filling-factor corrected values are shown for comparison in the next column even though they were not used for analysis. | X (FFC)bbThe values used in this paper are shown in boldface. Filling-factor corrected values are listed in this column. The uncorrected values are shown for comparison in the previous column even though they not used for analysis. | FlagccFlags: 1. No filling factor correction (no FFC) is the most reliable. 2. Filling factor correction (FFC) is the most reliable 3. There is an ambiguity between low density / high abundance and low abundance / high density (no FFC) 4. There is an ambiguity between low density / high abundance and low abundance / high density (FFC) 5. Upper Limit (No FFC) 6. Upper Limit (FFC) 7. Lower Limit (No FFC) 8. Lower Limit (FFC) 9. Unreliable estimate because of continuum / filling factor uncertainty. 10. No limit (S/N) 11. Optically Thick |
|---|---|---|---|---|---|---|---|
| () | () | () | () | ||||
| G32.80+0.19 0 | 2 | ||||||
| G32.80+0.19 1 | 2 | ||||||
| G32.80+0.19 2 | 2 | ||||||
| G32.80+0.19 3 | 2 | ||||||
| G32.80+0.19 4 | 2 | ||||||
| G33.13-0.09 0 | 8 | ||||||
| G33.13-0.09 1 | 6 | ||||||
| G33.13-0.09 2 | 5 | ||||||
| G33.13-0.09 3 | 5 | ||||||
| G33.92+0.11 0 | 8 | ||||||
| G33.92+0.11 1 | 2 | ||||||
| G33.92+0.11 2 | - | - | - | - | - | - | 9 |
| G34.26+0.15 0 | 2 | ||||||
| G34.26+0.15 1 | 2 | ||||||
| G34.26+0.15 2 | 2 | ||||||
| G34.26+0.15 3 | 2 | ||||||
| G34.26+0.15 4 | 2 | ||||||
| G35.20-1.74 0 | 2 | ||||||
| G35.20-1.74 1 | 2 | ||||||
| G35.20-1.74 2 | 2 | ||||||
| G35.20-1.74 3 | 6 | ||||||
| G35.57-0.03 0 | 8 | ||||||
| G35.57-0.03 1 | 8 | ||||||
| G35.57-0.03 2 | 6 | ||||||
| G35.57-0.03 3 | 6 | ||||||
| G35.57-0.03 4 | 8 | ||||||
| G35.58+0.07 0 | 8 | ||||||
| G35.58+0.07 1 | 6 | ||||||
| G35.58+0.07 2 | 6 | ||||||
| G35.58+0.07 3 | 6 | ||||||
| G37.87-0.40 0 | 2 | ||||||
| G37.87-0.40 1 | 2 | ||||||
| G37.87-0.40 2 | 4 | ||||||
| G37.87-0.40 3 | 2 | ||||||
| G37.87-0.40 4 | 2 | ||||||
| G37.87-0.40 5 | 4 | ||||||
| G37.87-0.40 6 | 4 | ||||||
| G37.87-0.40 7 | 2 | ||||||
| G37.87-0.40 8 | 2 | ||||||
| G37.87-0.40 9 | 2 | ||||||
| G43.89-0.78 0 | 2 | ||||||
| G43.89-0.78 1 | 1 | ||||||
| G45.07+0.13 0 | 2 | ||||||
| G45.07+0.13 1 | - | - | - | - | - | - | 9 |
| G45.12+0.13 0 | 2 | ||||||
| G45.12+0.13 1 | 2 | ||||||
| G45.12+0.13 2 | 2 | ||||||
| G45.12+0.13 3 | 2 | ||||||
| G45.45+0.06 0 | 2 | ||||||
| G45.45+0.06 1 | 2 | ||||||
| G45.45+0.06 2 | 6 | ||||||
| G45.47+0.05 0 | 2 | ||||||
| G45.47+0.05 1 | 5 | ||||||
| G48.61+0.02 0 | 2 | ||||||
| G48.61+0.02 1 | 5 | ||||||
| G48.61+0.02 2 | 2 | ||||||
| G50.32+0.68 0 | 8 | ||||||
| G60.88-0.13 0 | 2 | ||||||
| G61.48+0.09 0 | 8 | ||||||
| G69.54-0.98 0 | - | - | - | - | - | - | 11 |
| G70.29+1.60 0 | 2 | ||||||
| G70.29+1.60 1 | 6 | ||||||
| G70.33+1.59 0 | 2 | ||||||
| IRAS 20051+3435 0 | 3 | ||||||
| G41.74+0.10 0 | 2 | ||||||
| G41.74+0.10 1 | 5 | ||||||
| G41.74+0.10 2 | 5 | ||||||
| G41.74+0.10 3 | 5 | ||||||
| G41.74+0.10 4 | 5 | ||||||
| IRDC 1923+13 0 | 5 | ||||||
| IRDC 1923+13 1 | 5 | ||||||
| IRDC 1923+13 2 | 5 | ||||||
| IRDC 1916+11 0 | 5 | ||||||
| IRDC 1916+11 1 | 5 | ||||||
| IRDC 1916+11 2 | 5 |
2.2. Green Bank Telescope
We observed the line at 2 cm (14.488789 GHz) with the Green Bank Telescope (GBT)444 The National Radio Astronomy Observatory operates the GBT and VLA and is a facility of the National Science Foundation operated under cooperative agreement by Associated Universities, Inc. dual-beam Ku-band receiver as part of project GBT09C-049. The GBT dual-beam Ku-band receiver was used for 4 hours on January 18th, 2010 in beam-switched nodding mode. System temperatures ranged from 27 to 38 K in the band centered on the line. A bandwidth of 12.5 MHz (258.8 km s-1) and channel width of 3.052 kHz (0.063 km s-1) were used with 9-level sampling, with receiver temperature K. Three additional tunings were acquired simultaneously, centered between the H and He 75, 76, and 77 radio recombination lines (RRLs) with the same channel widths and bandwidths as above at 14.1315, 14.6930, and 15.2846 GHz. Each source was observed for 150 seconds in each receiver for a total on-source integration time of 300 seconds. Each observation in the pair was independently inspected to search for emission/absorption in the off position, which was 5.5′ away in azimuth. When absorption was detected in one of the off positions, that on/off pair was discarded if one of the detected lines was affected, but otherwise was noted and ignored. Pointing and focus observations on the calibrator source 1822-0938 were taken at the start of and two hours into the observations.
The gain was assumed to be 1.91 K/Jy based on previous calibration observations on point sources in Ku-band; our flux density measurements will therefore be overestimates for extended sources. The aperture efficiency was , and the main beam efficiency , so our main-beam corrected measurements could overestimate extended source flux densities by at most (ignoring atmospheric absorption). The data were calibrated using the normal getnod procedure in GBTIDL 555 GBTIDL (http://gbtidl.nrao.edu/) is the data reduction package produced by NRAO and written in the IDL language for the reduction of GBT data. The National Radio Astronomy Observatory is a facility of the National Science Foundation operated under cooperative agreement by Associated Universities, Inc. , which assumes an atmospheric opacity at zenith at 14.488 GHz.
We assume primary beam per the GBT observers manual. We assume a conservative 10% error in the beam area sr, which governs the flux density received from the CMB over the observed area. Beam size error should be dominated by small errors in focus. By utilizing the 305 m Arecibo telescope at 6 cm and the 100 m GBT at 2 cm, we acquired beam-matched (FWHM) observations of the and lines.
2.2.1 GBT Data Reduction
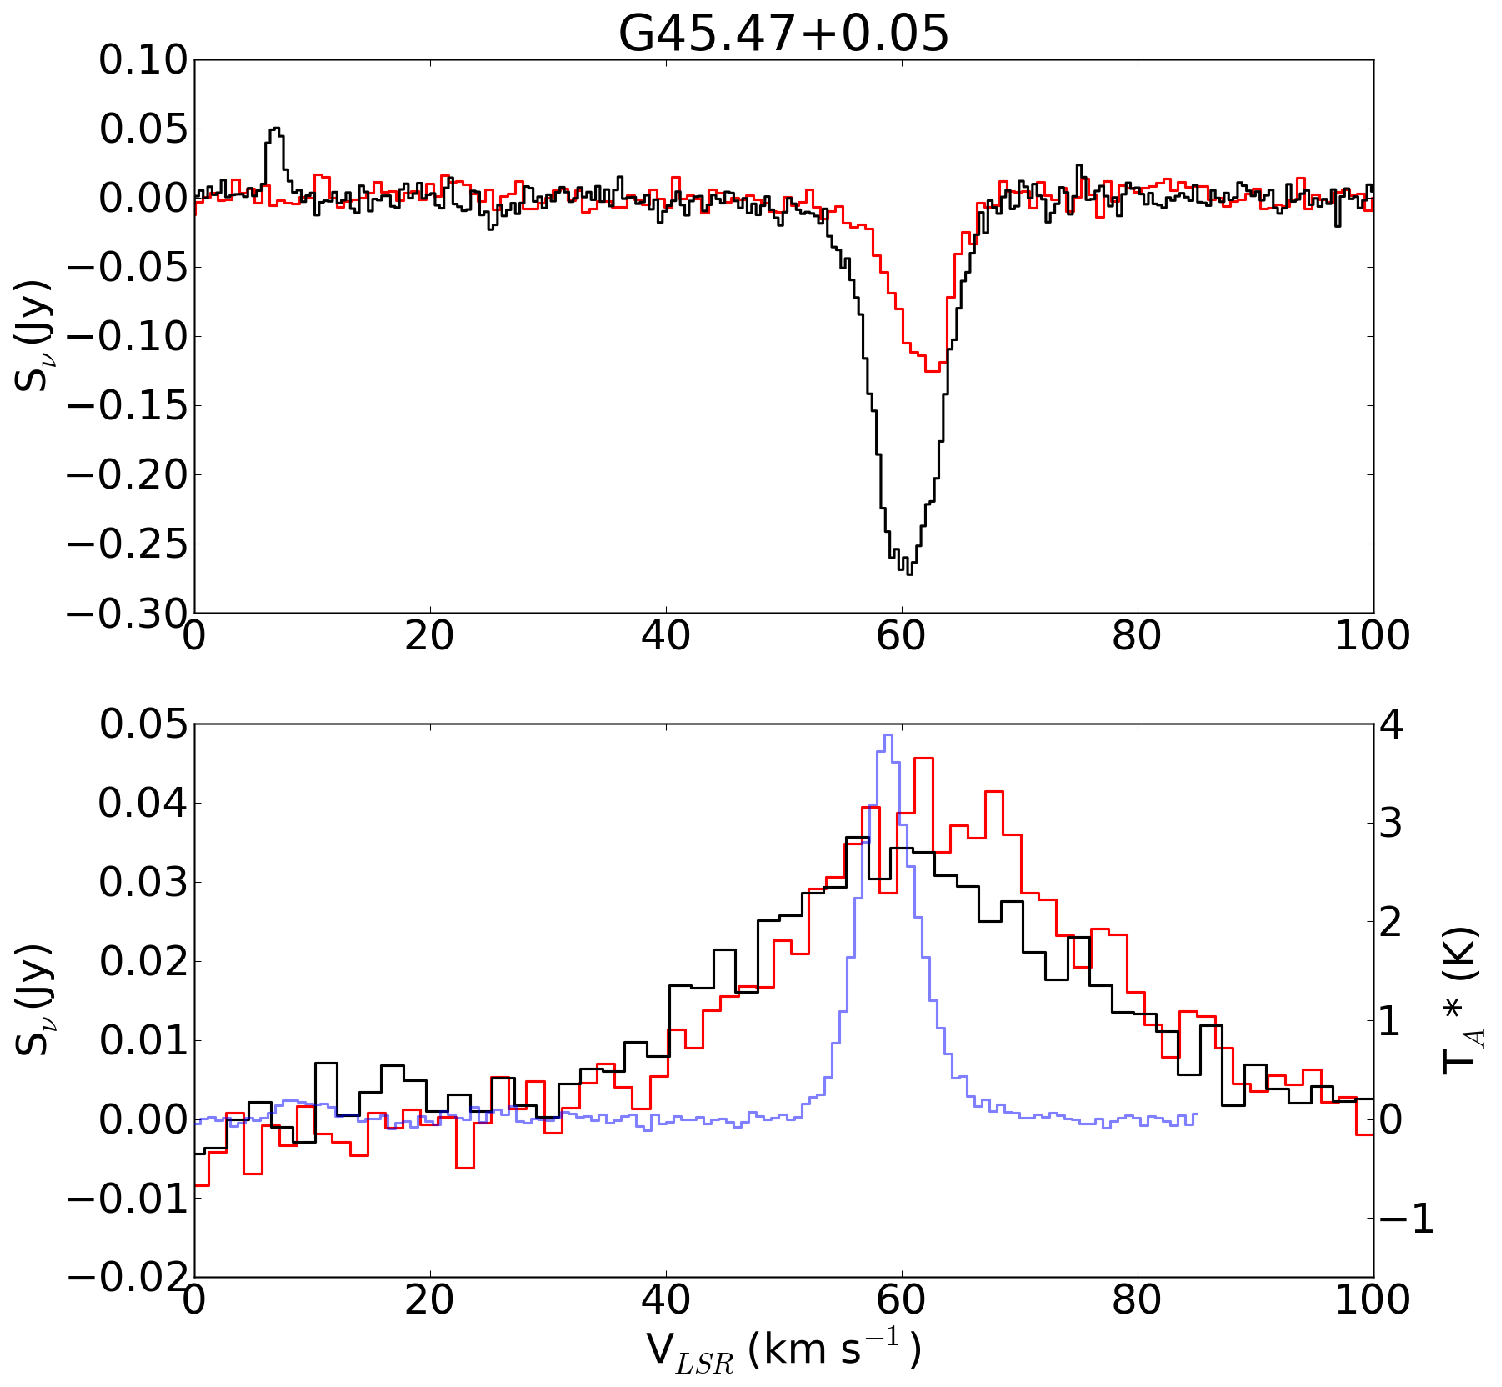
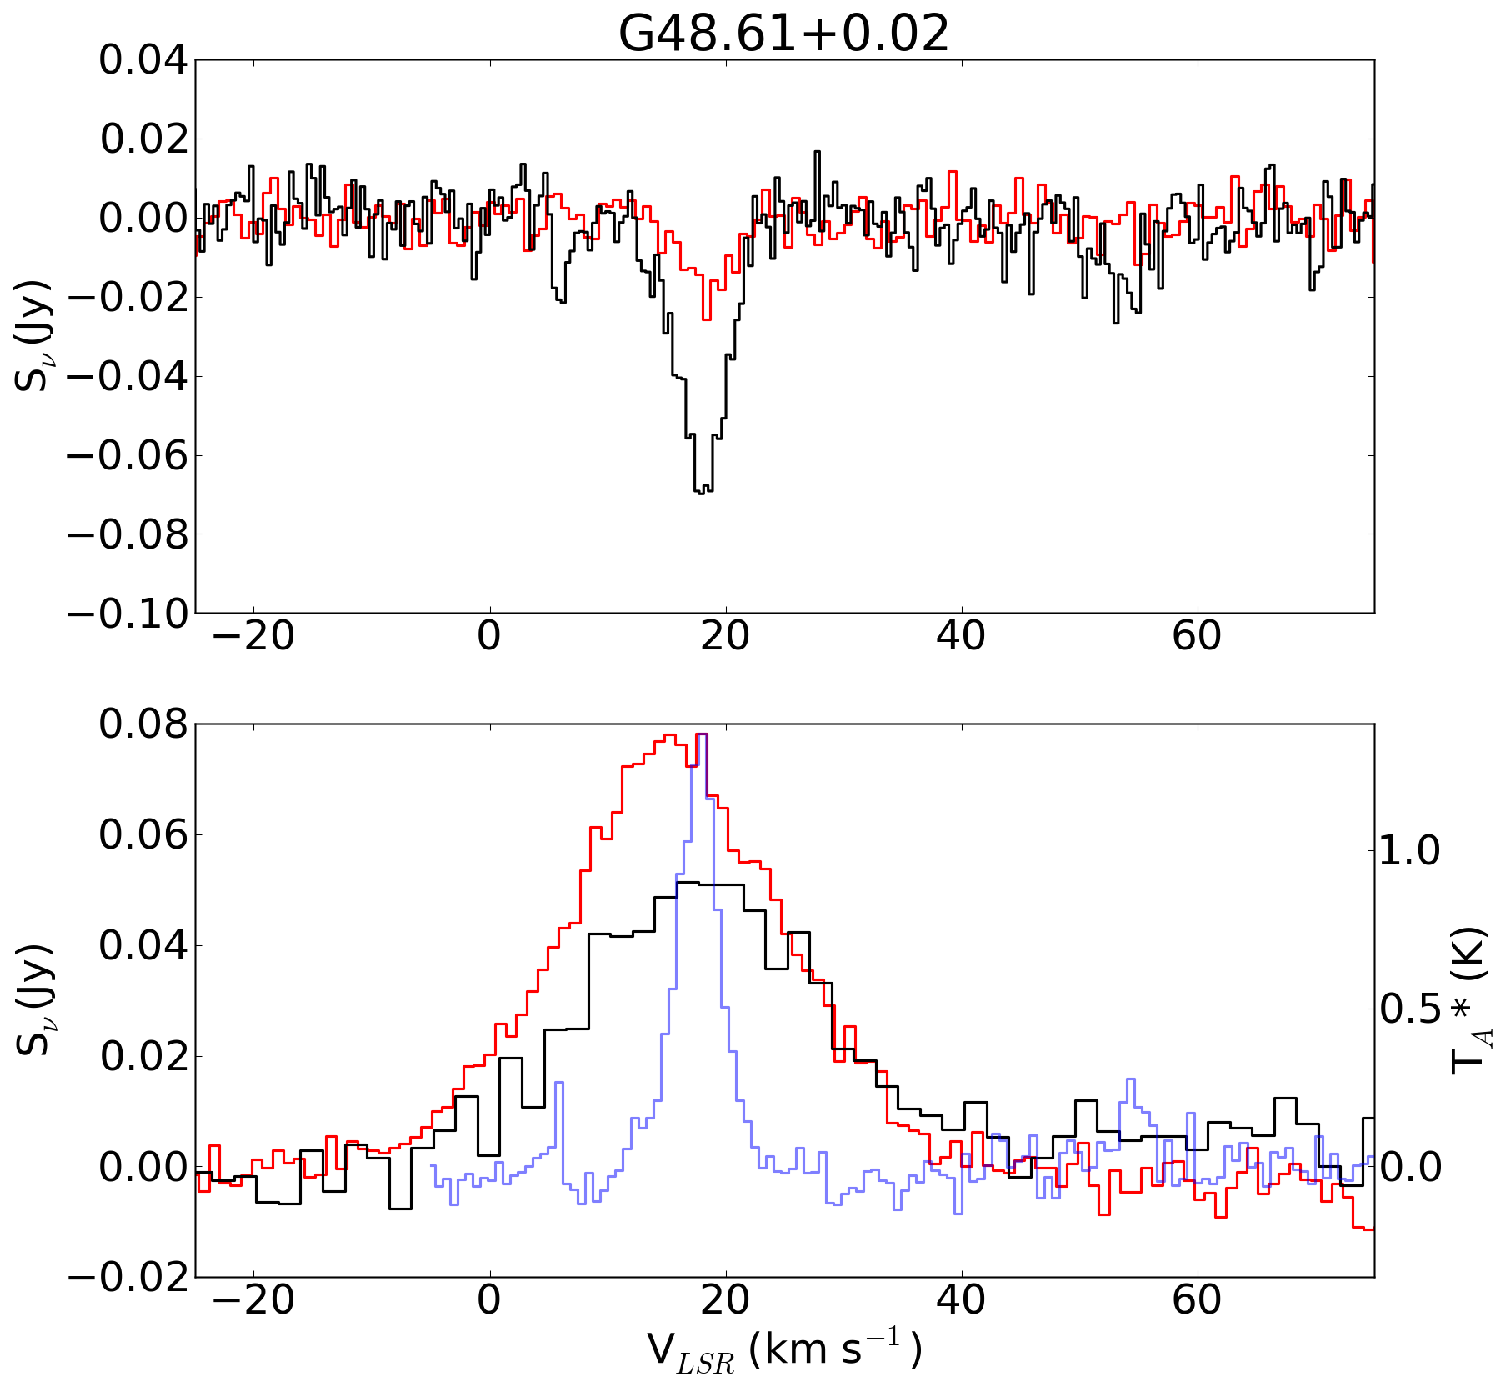
In the 24 lines of sight, 75 independent components were identified from the spectra. These were fit with gaussians using GBTIDL’s fitgauss routine. Out of these 75 components, 51 had corresponding detections. The fitted gaussian spectral lines are listed by line of sight in Table 1. The gaussian fits may not be representative of the true spectral line profile; complex spectral line profiles are discussed in Section 6.2.
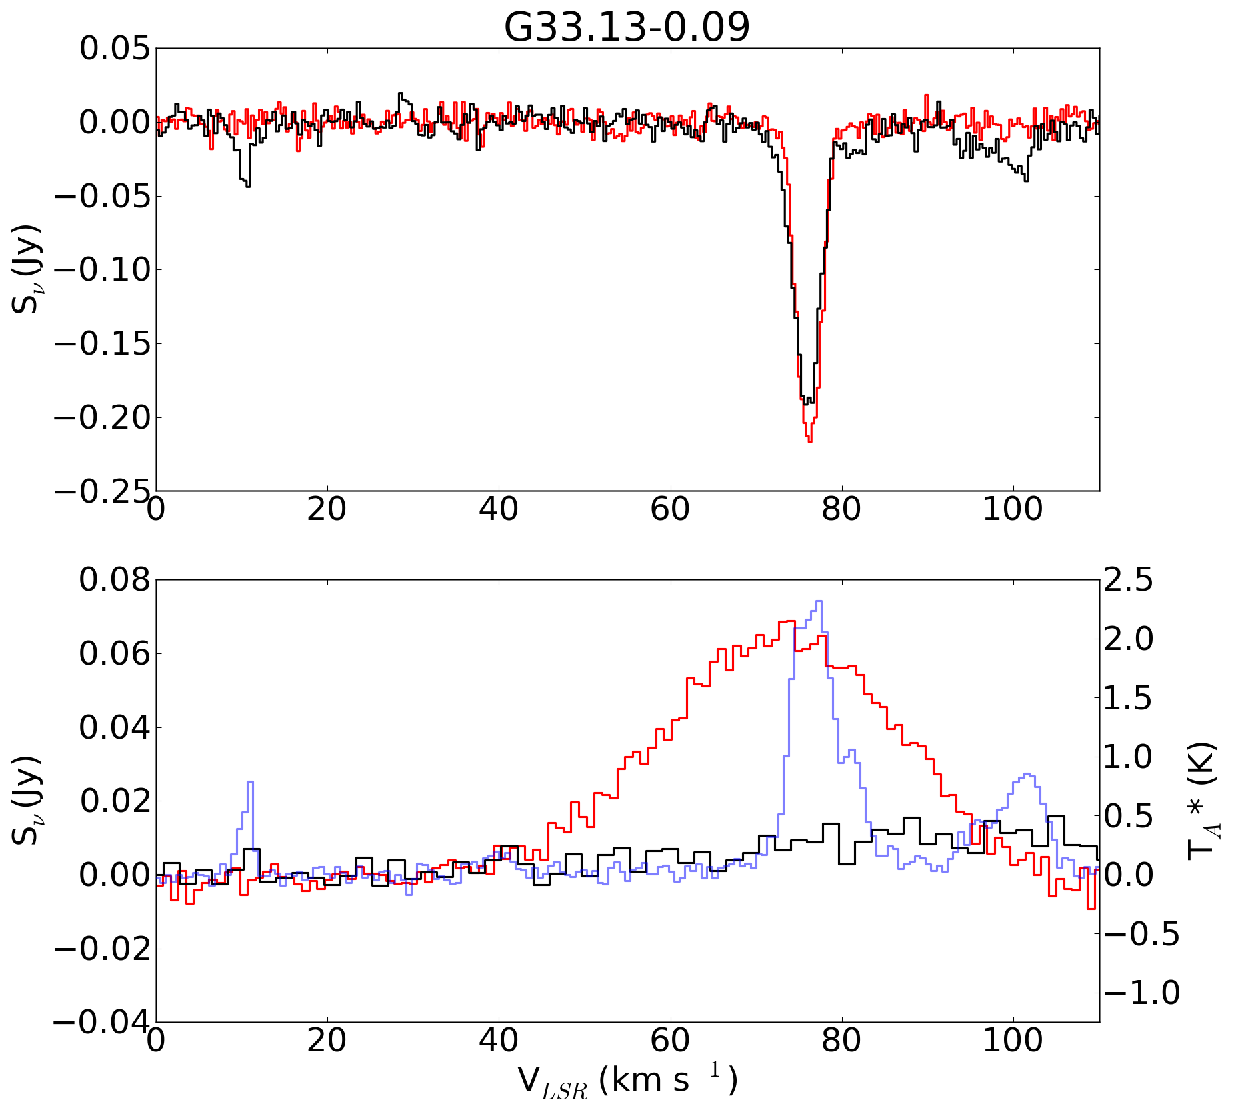
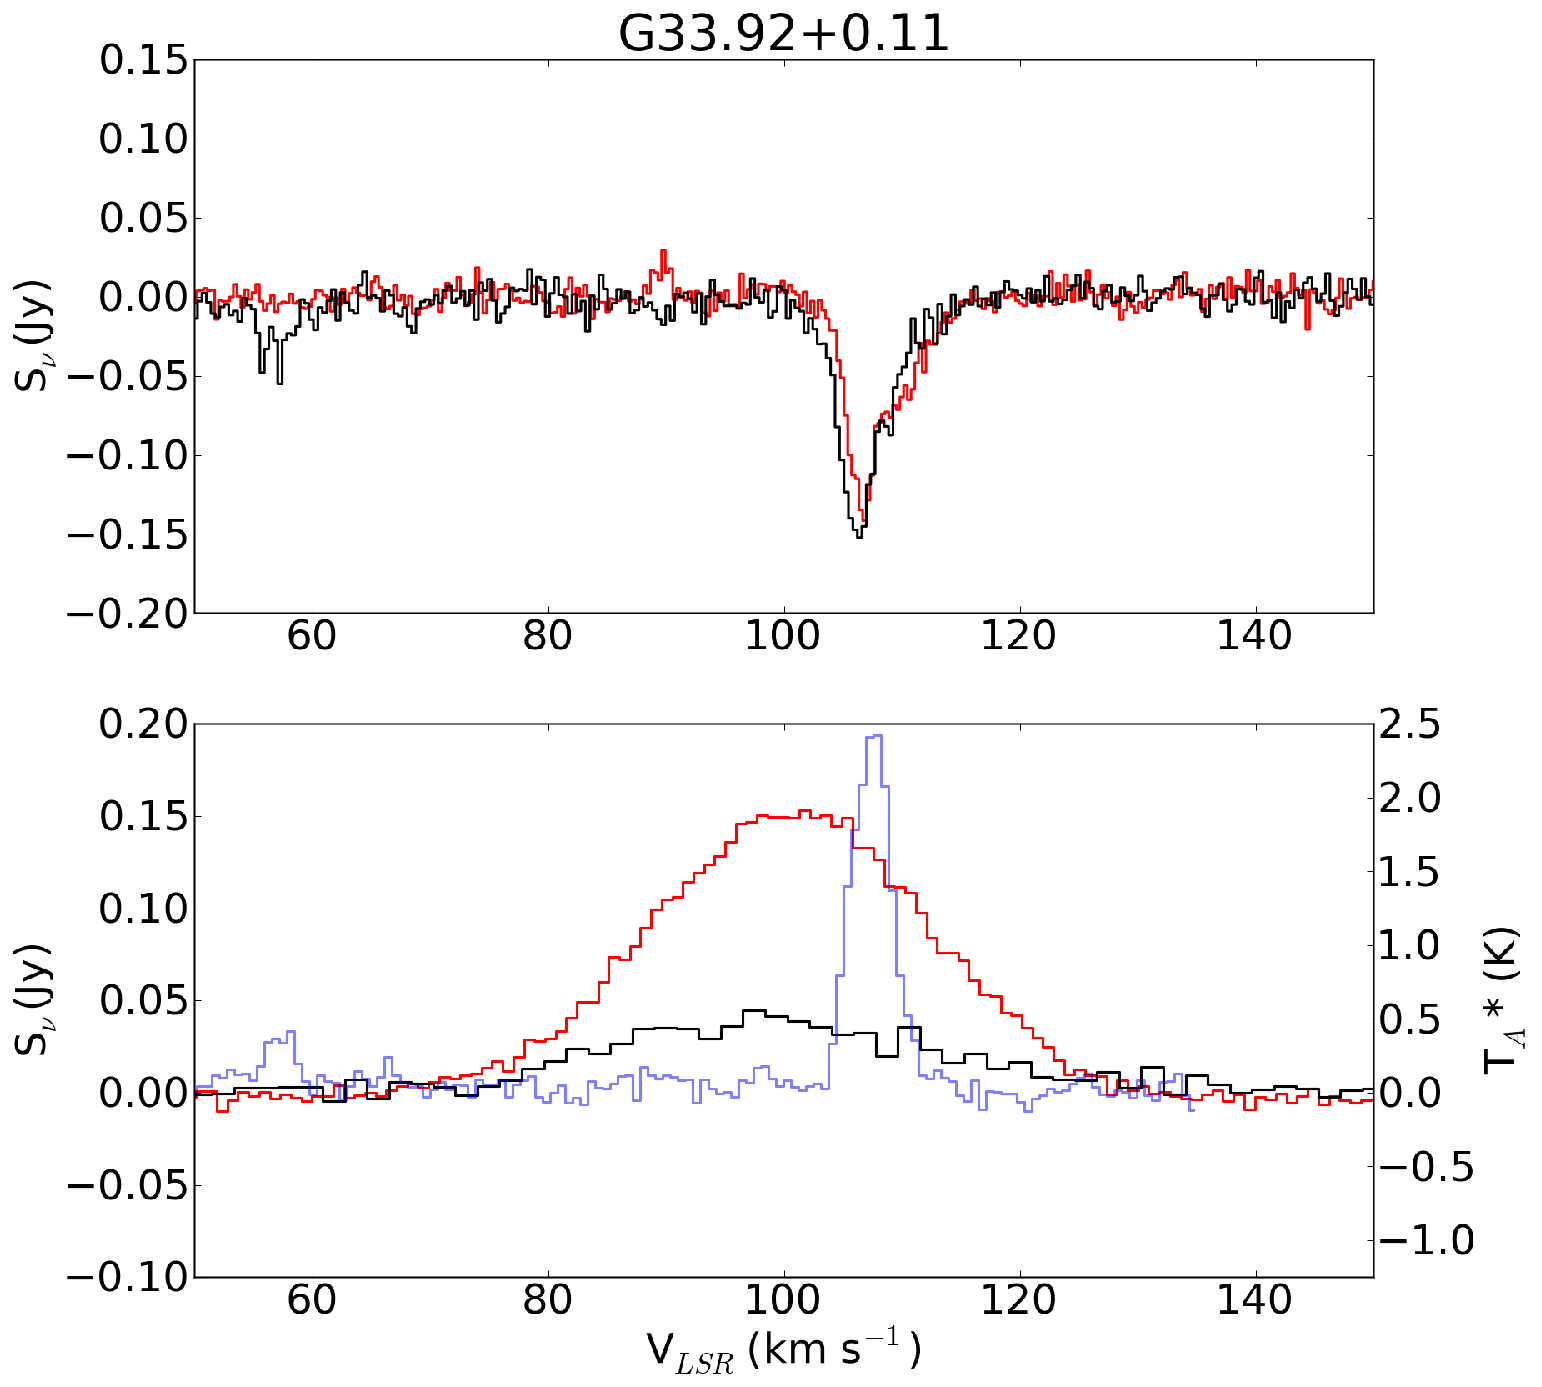
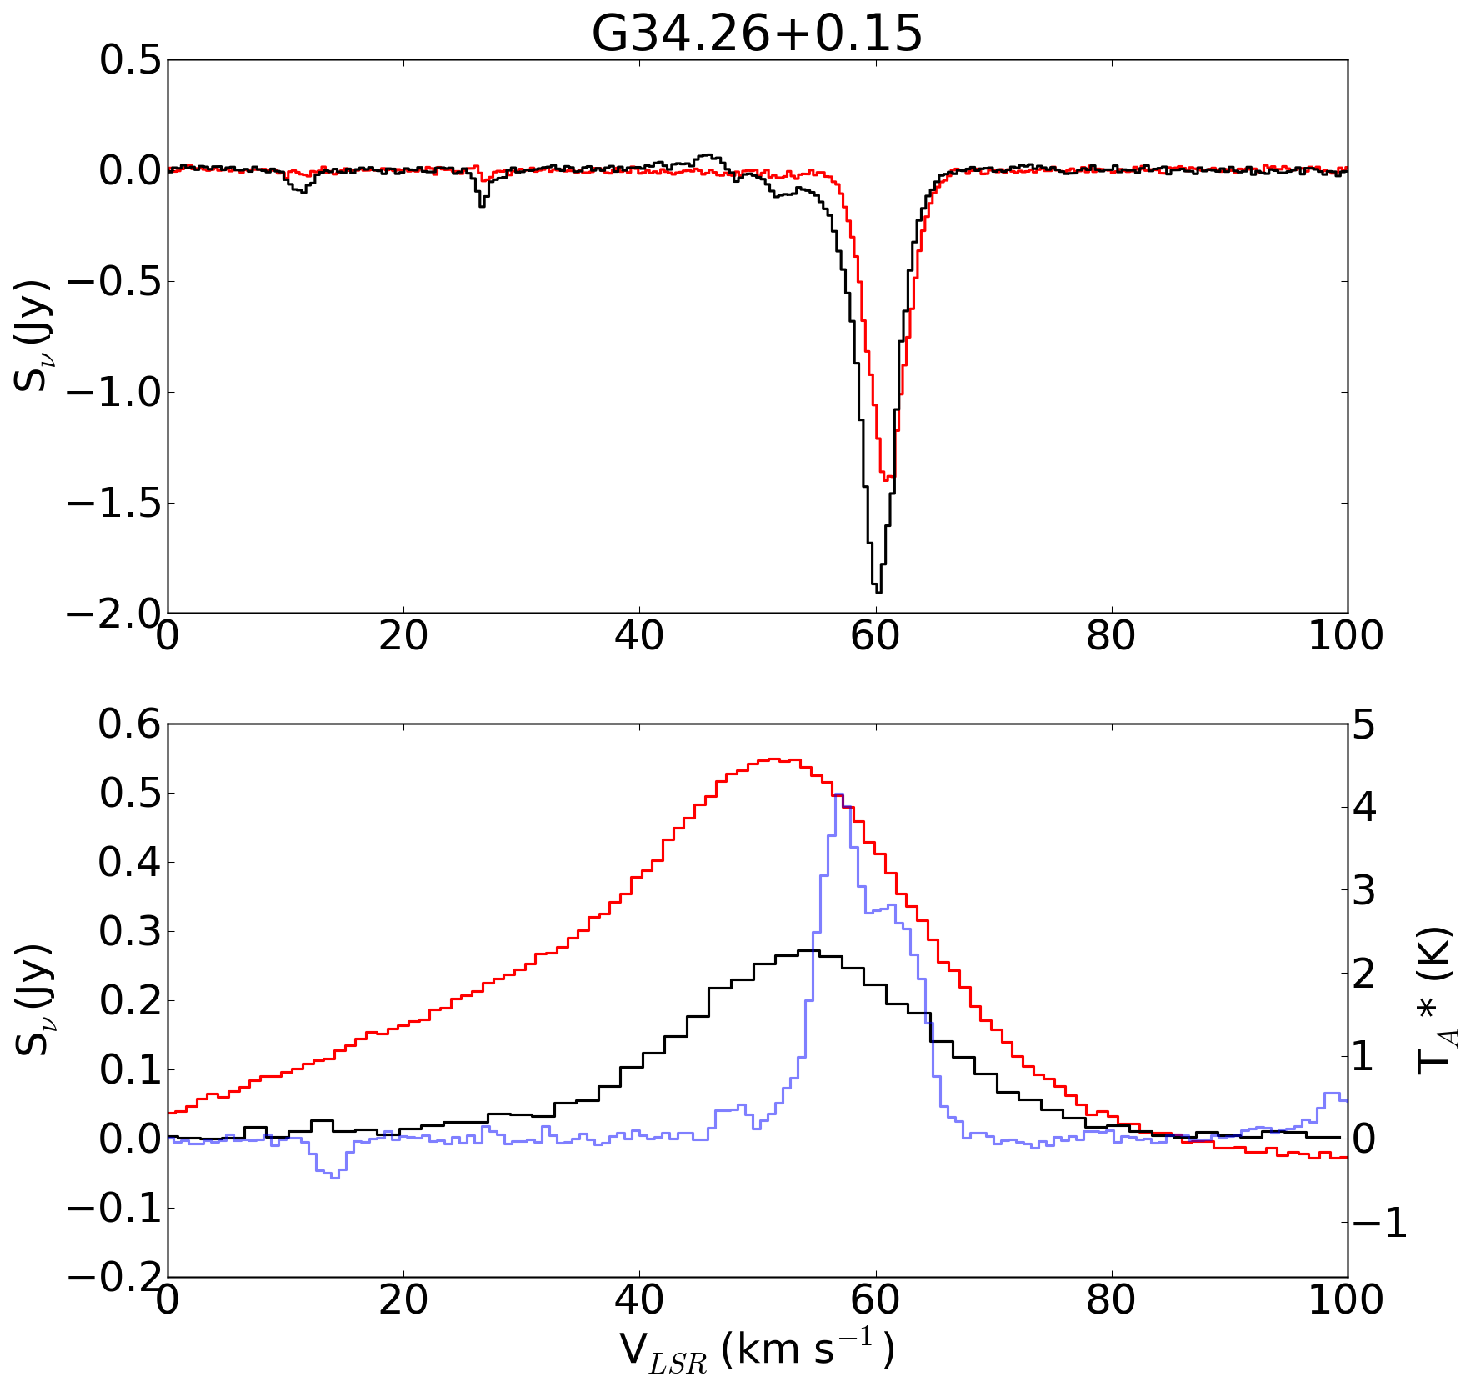
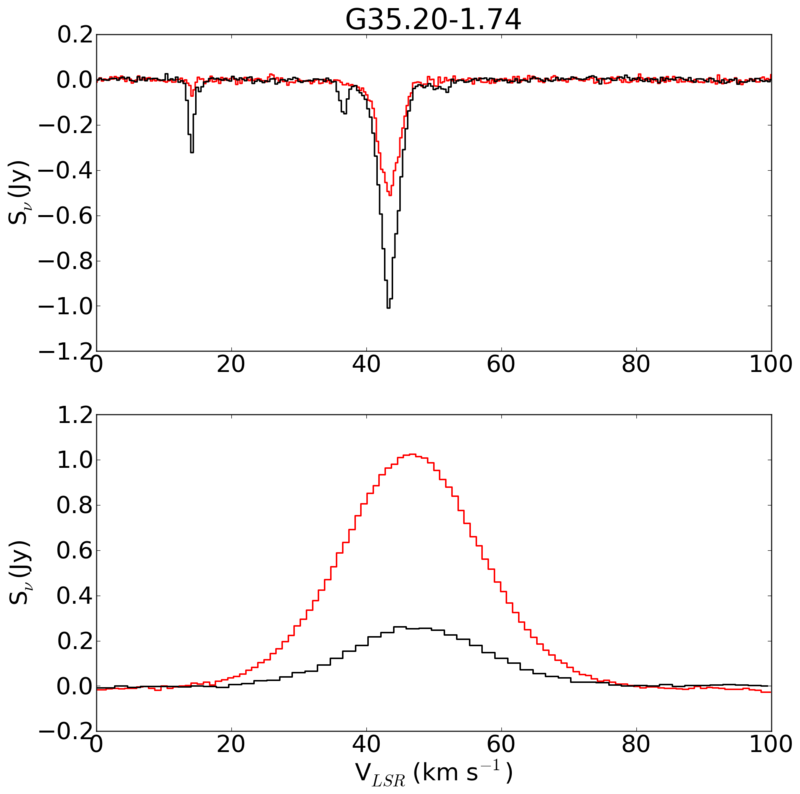
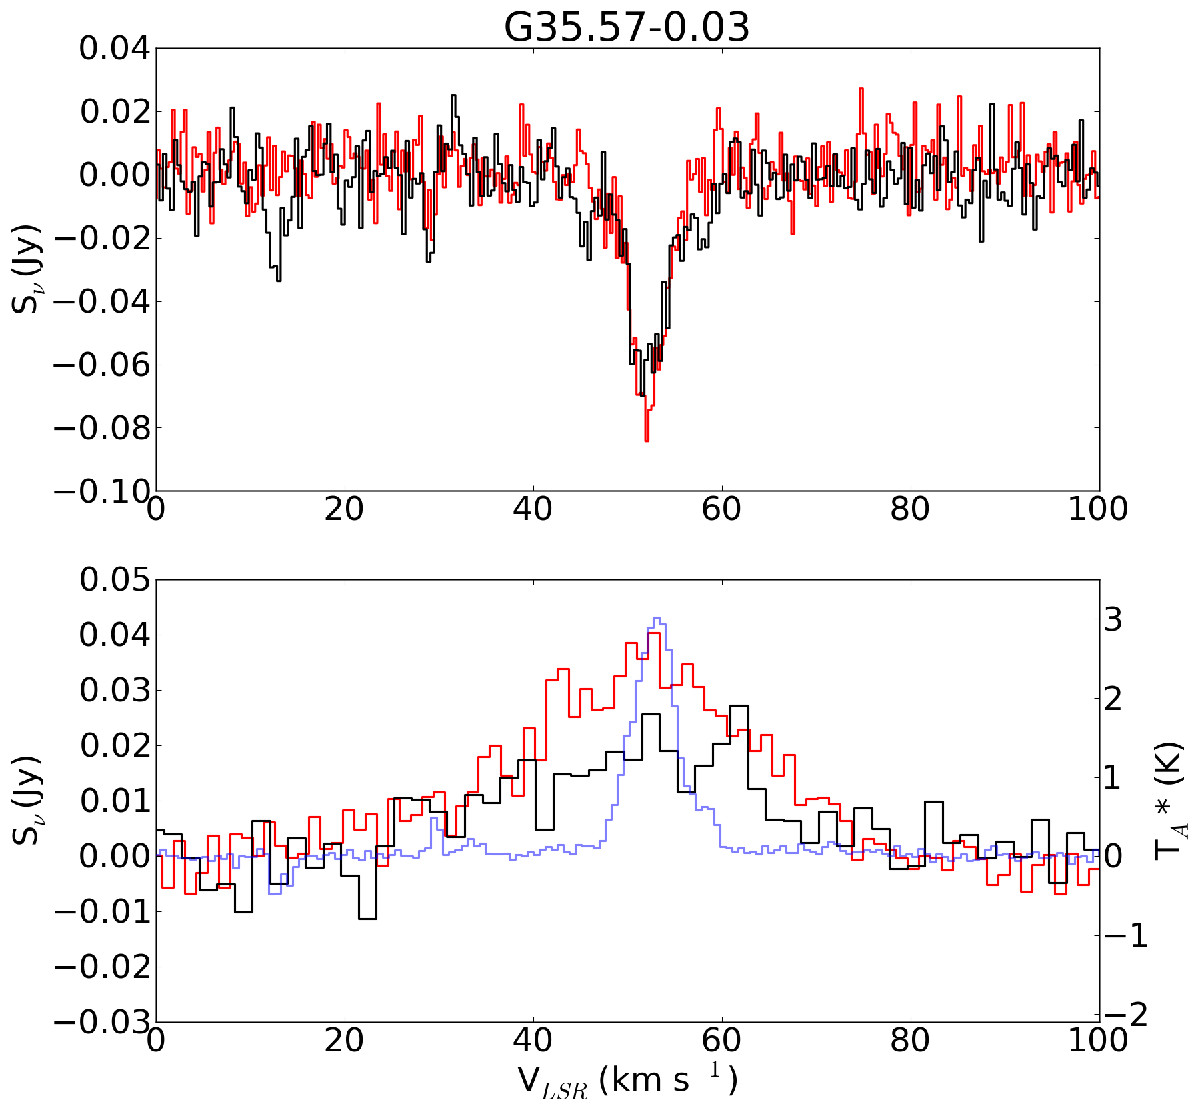
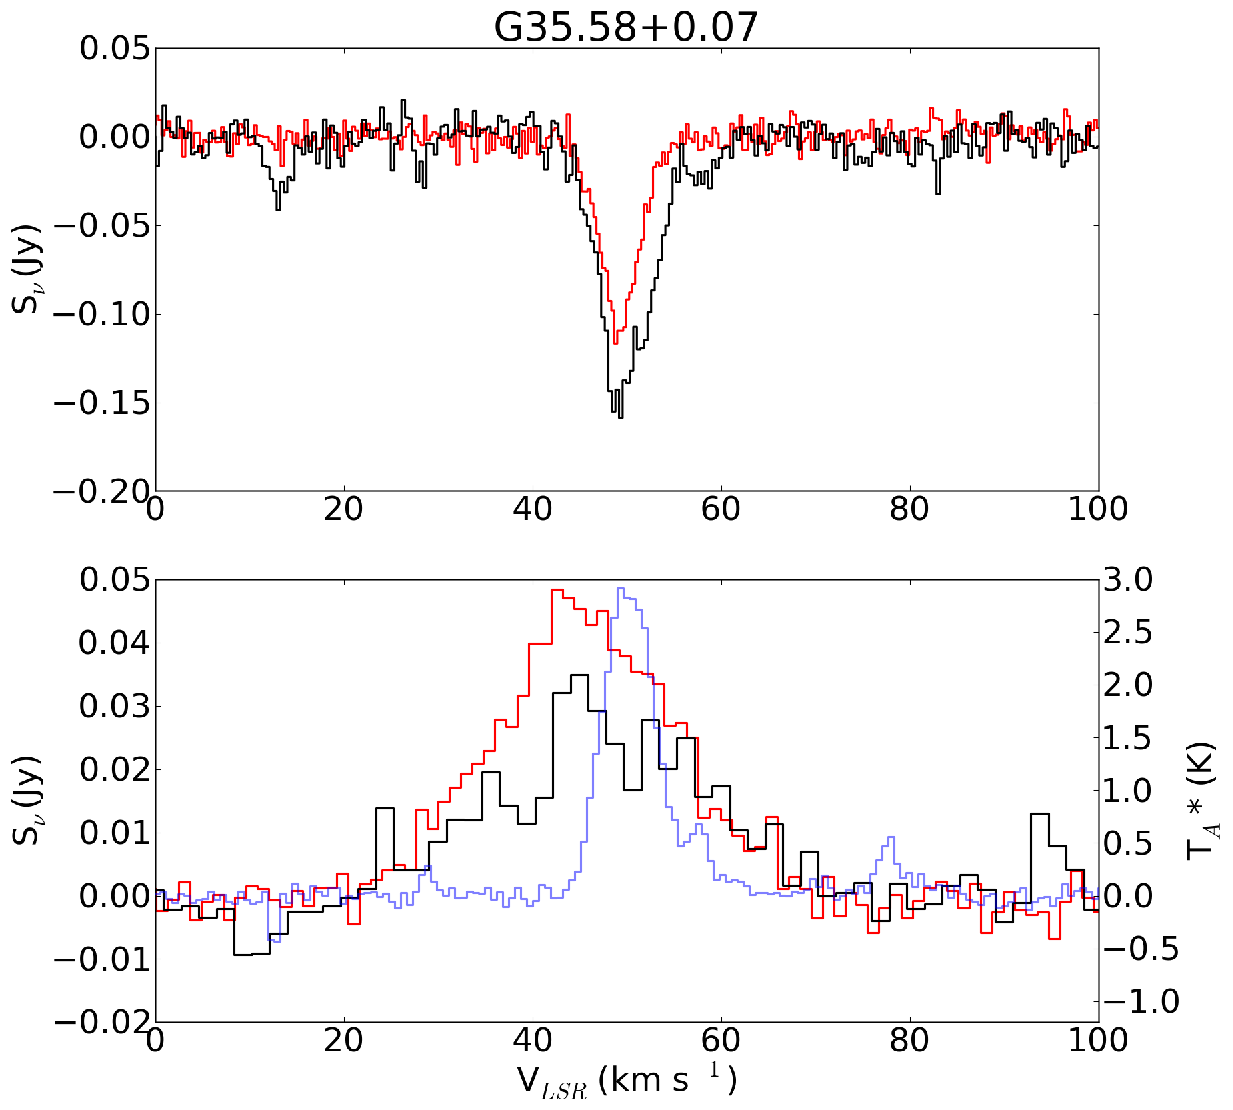
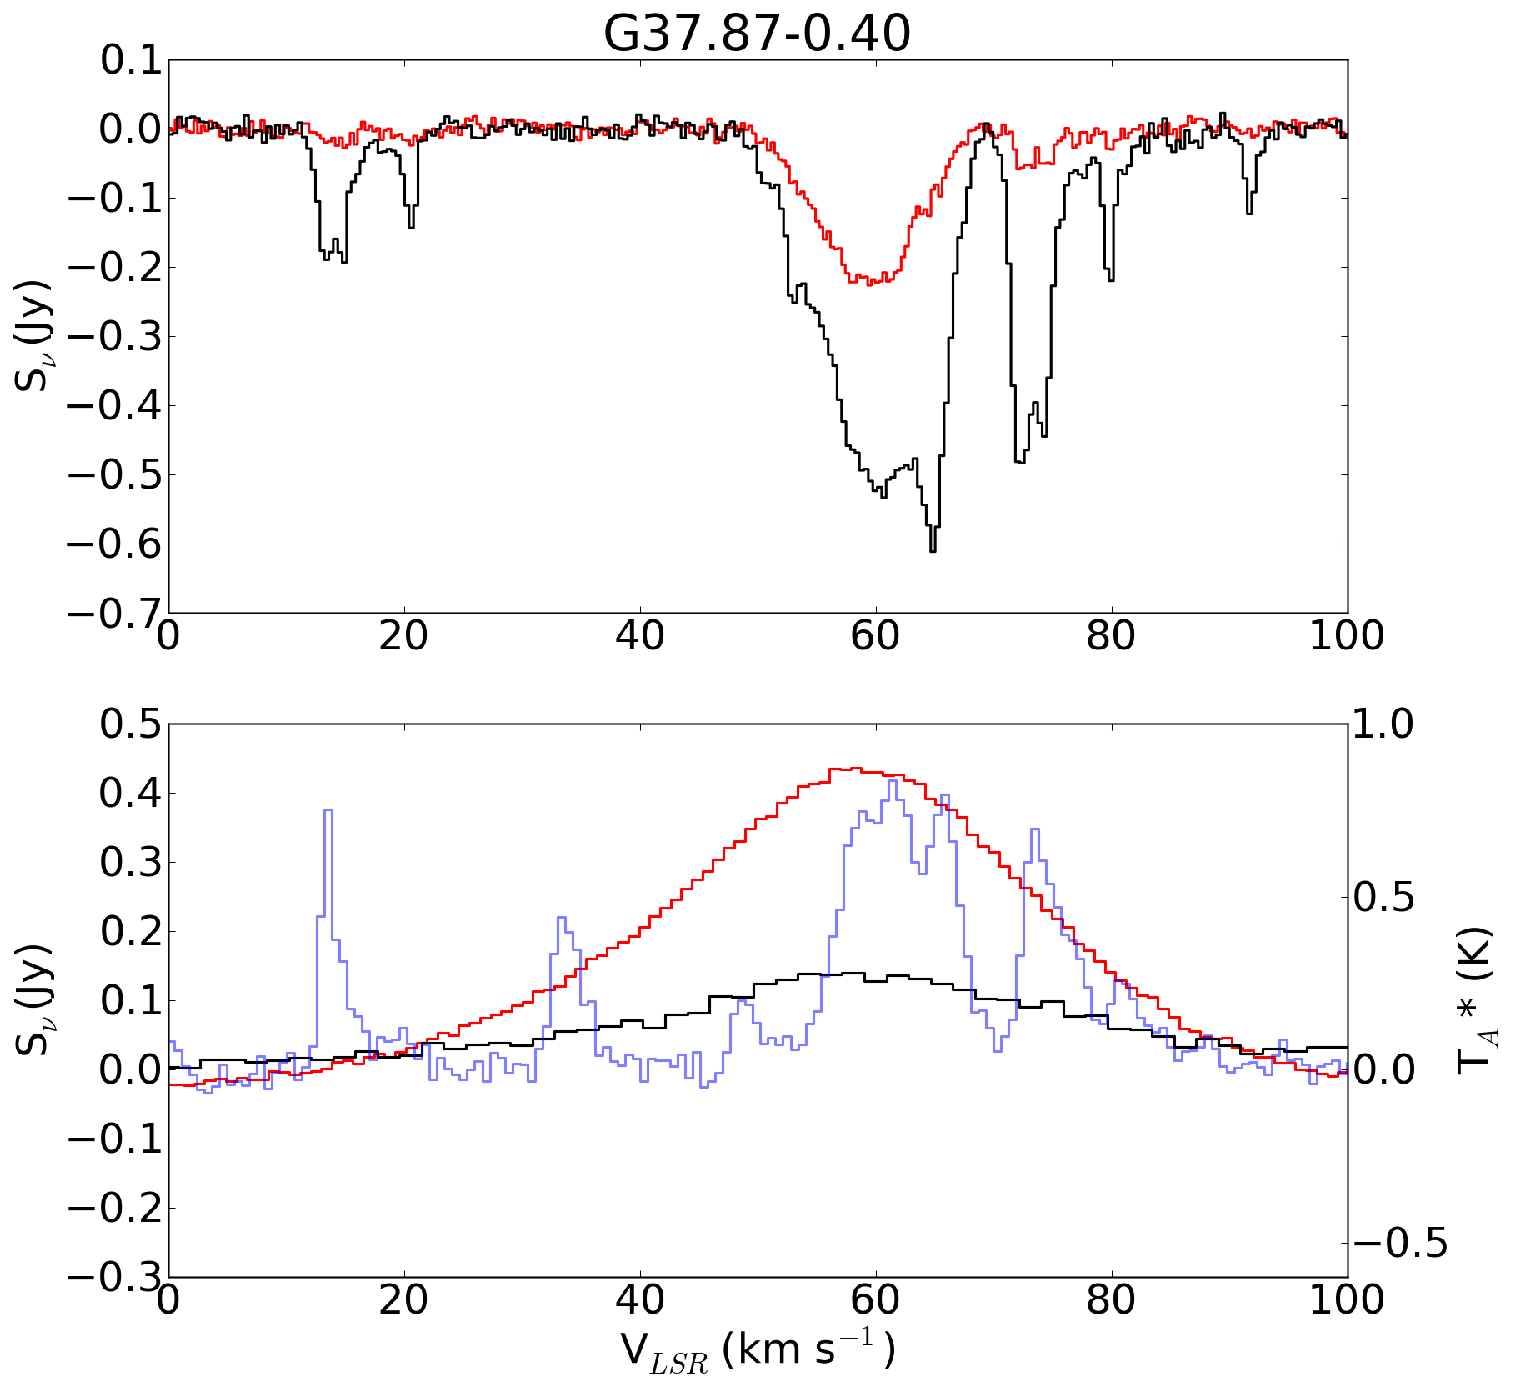
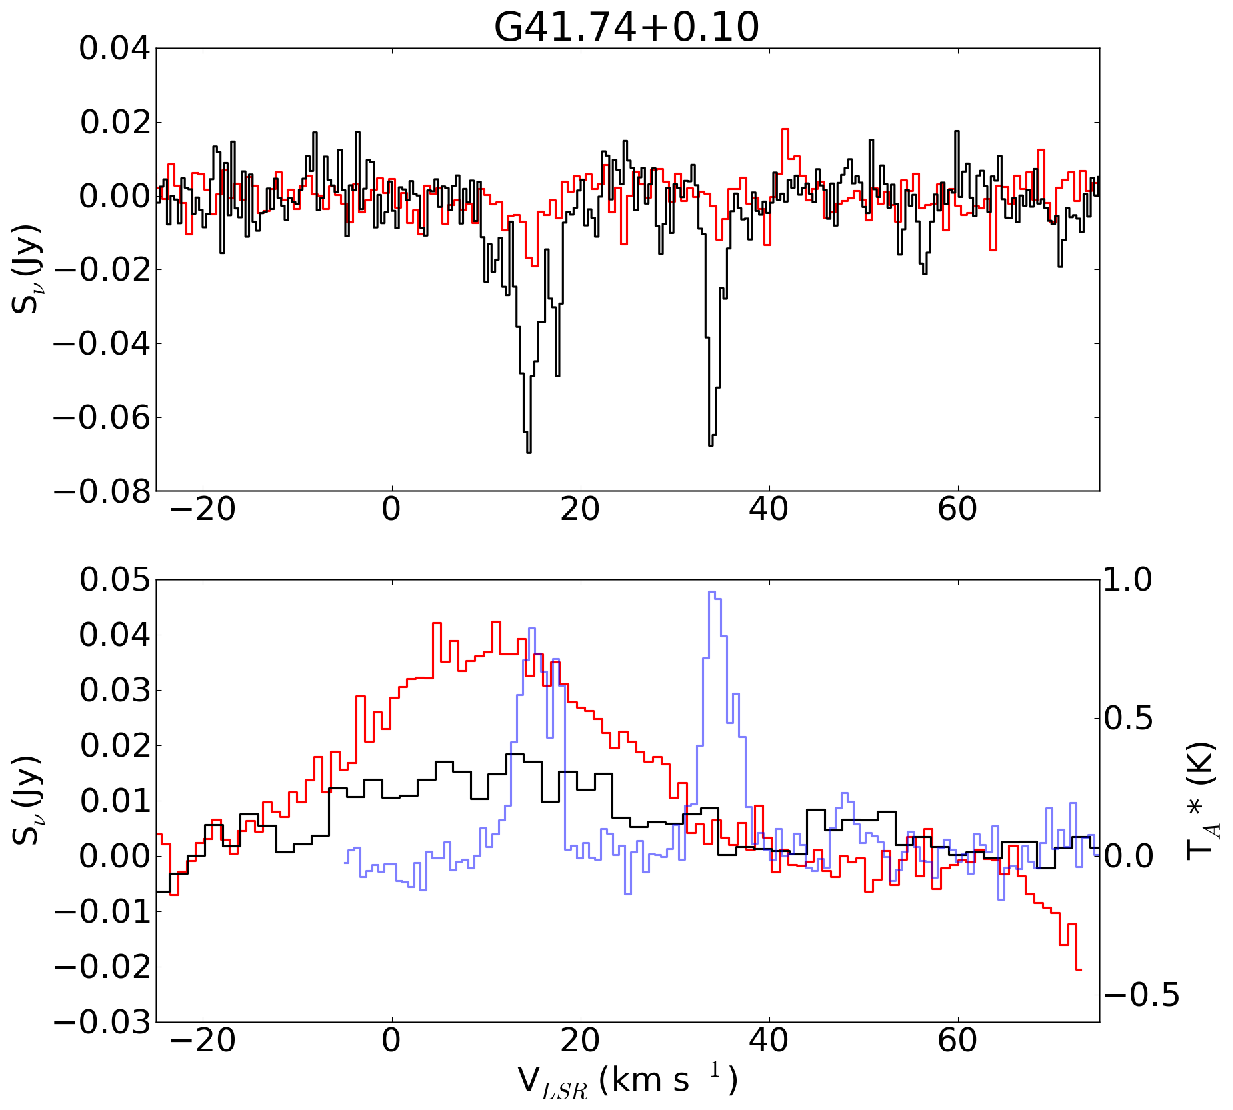
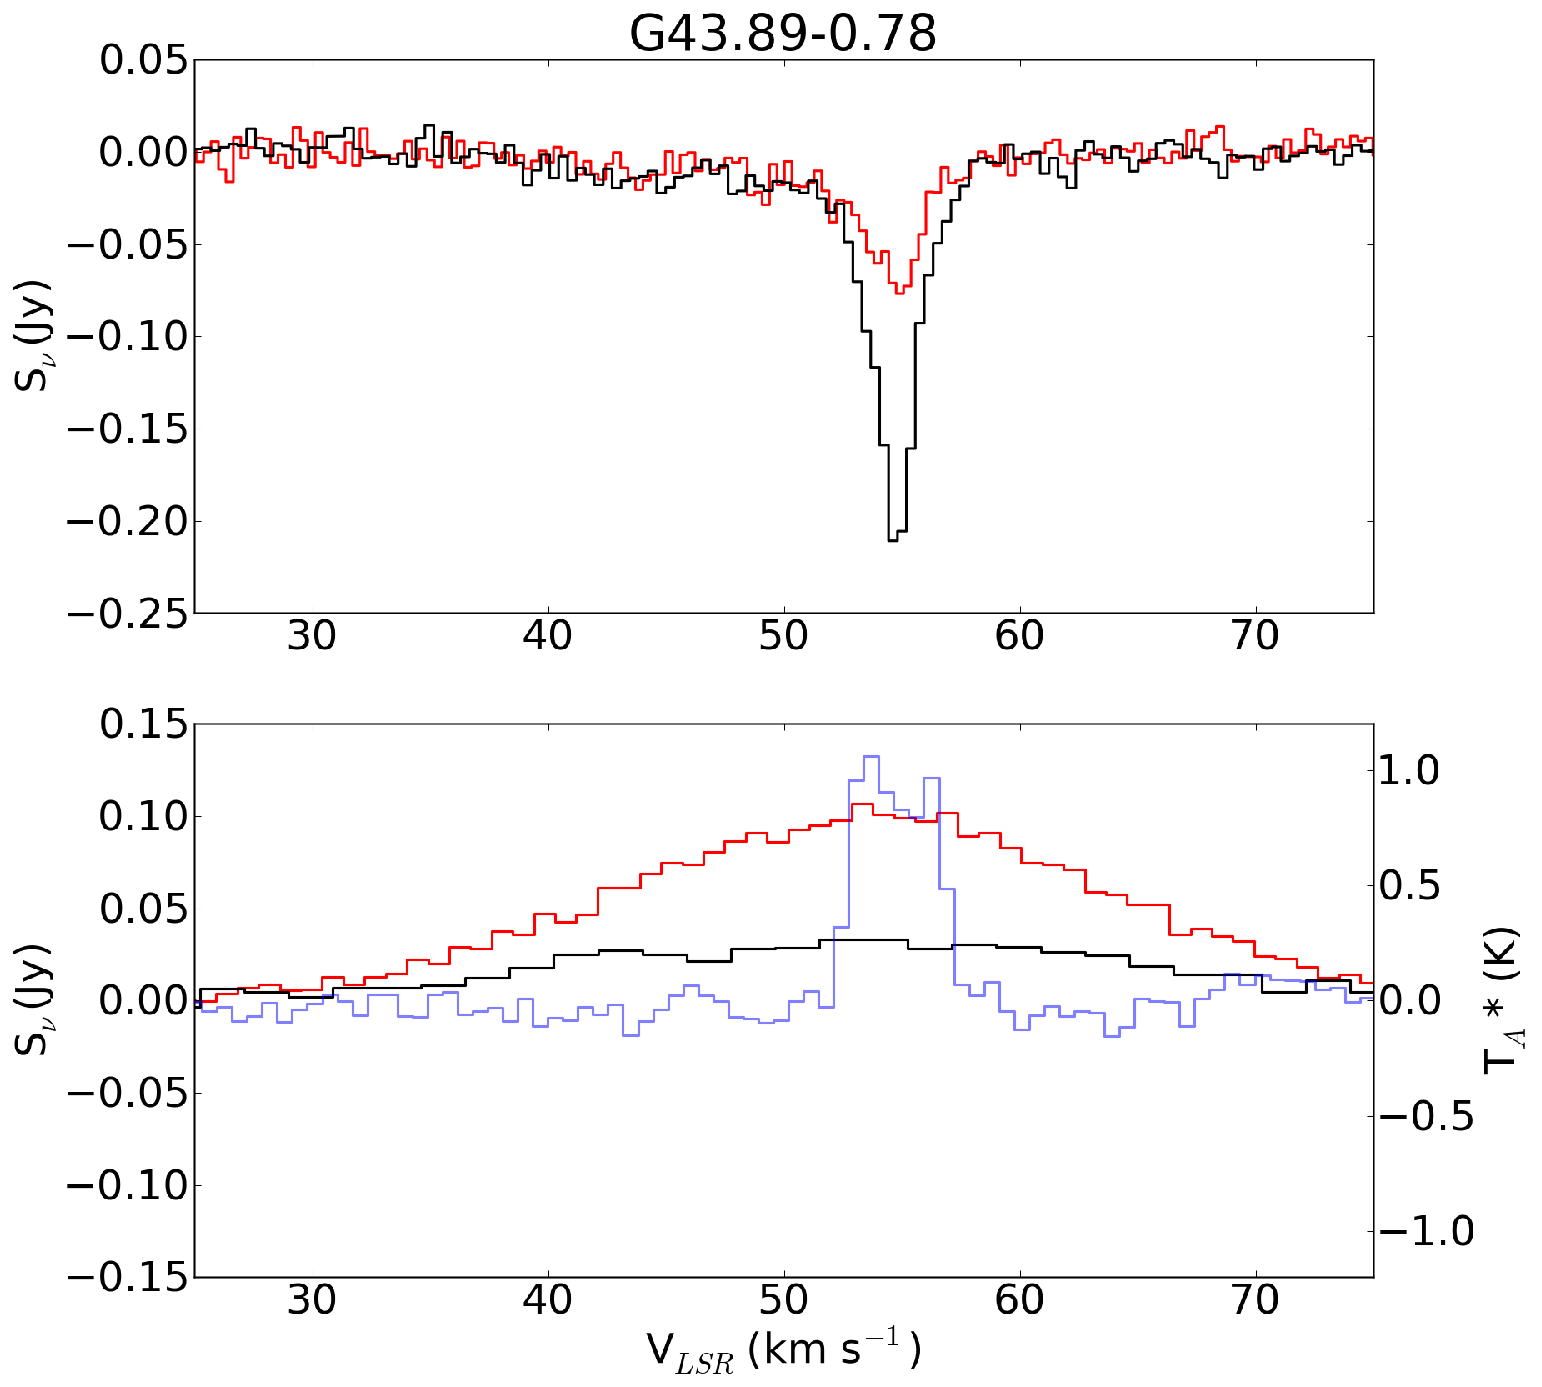
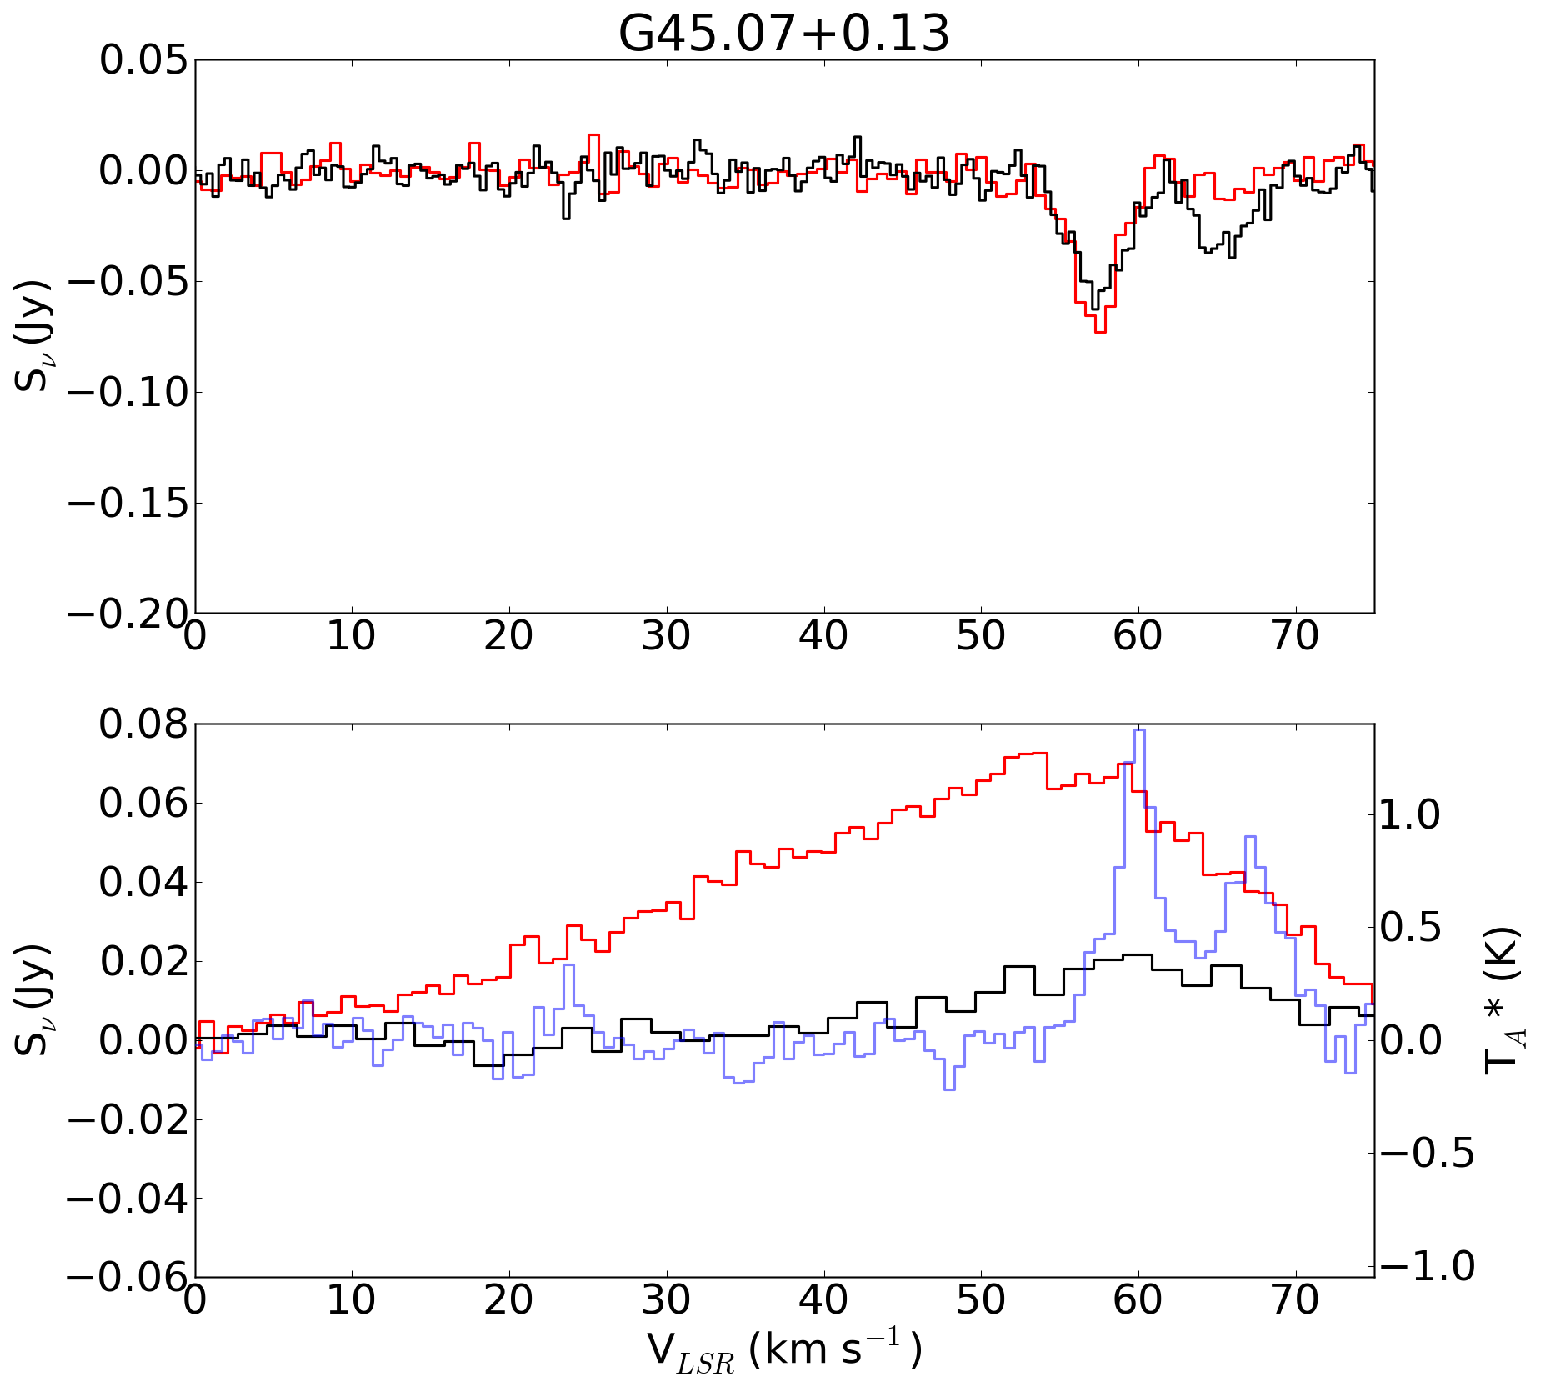
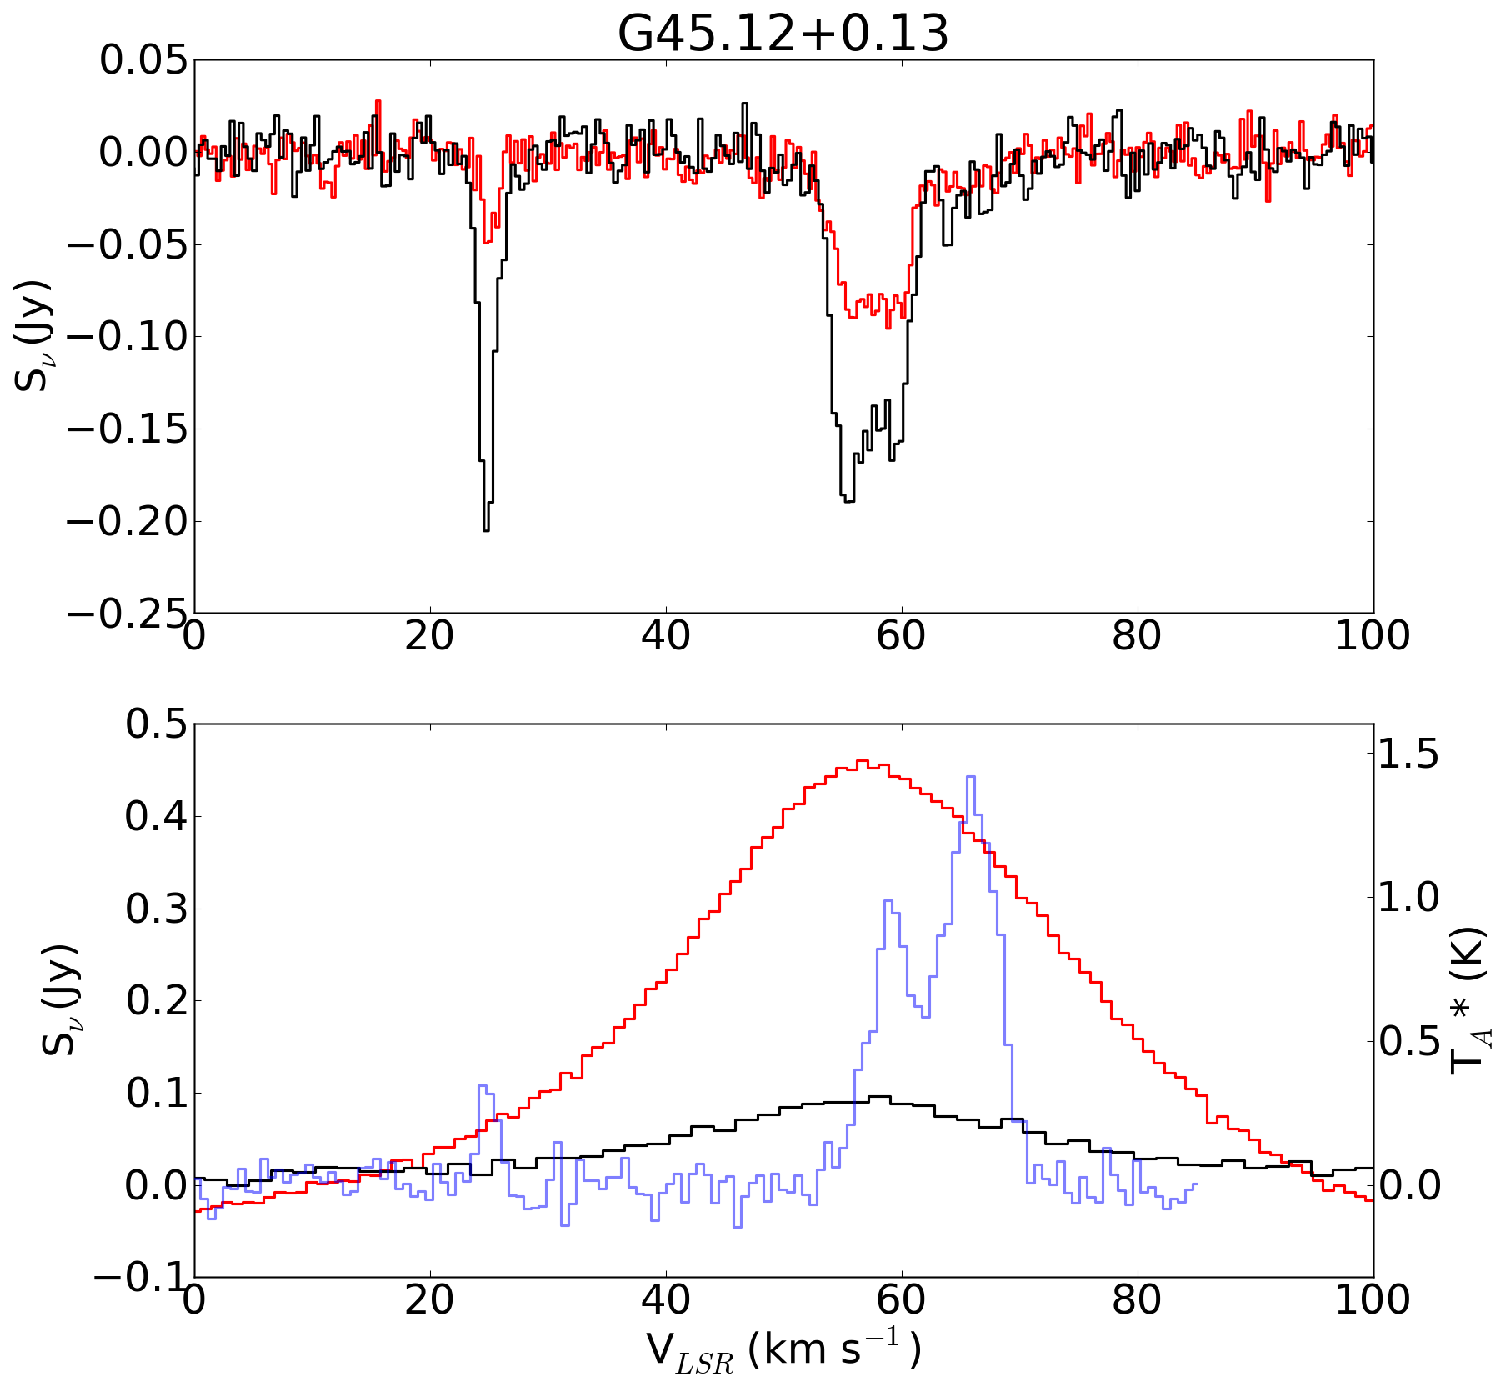
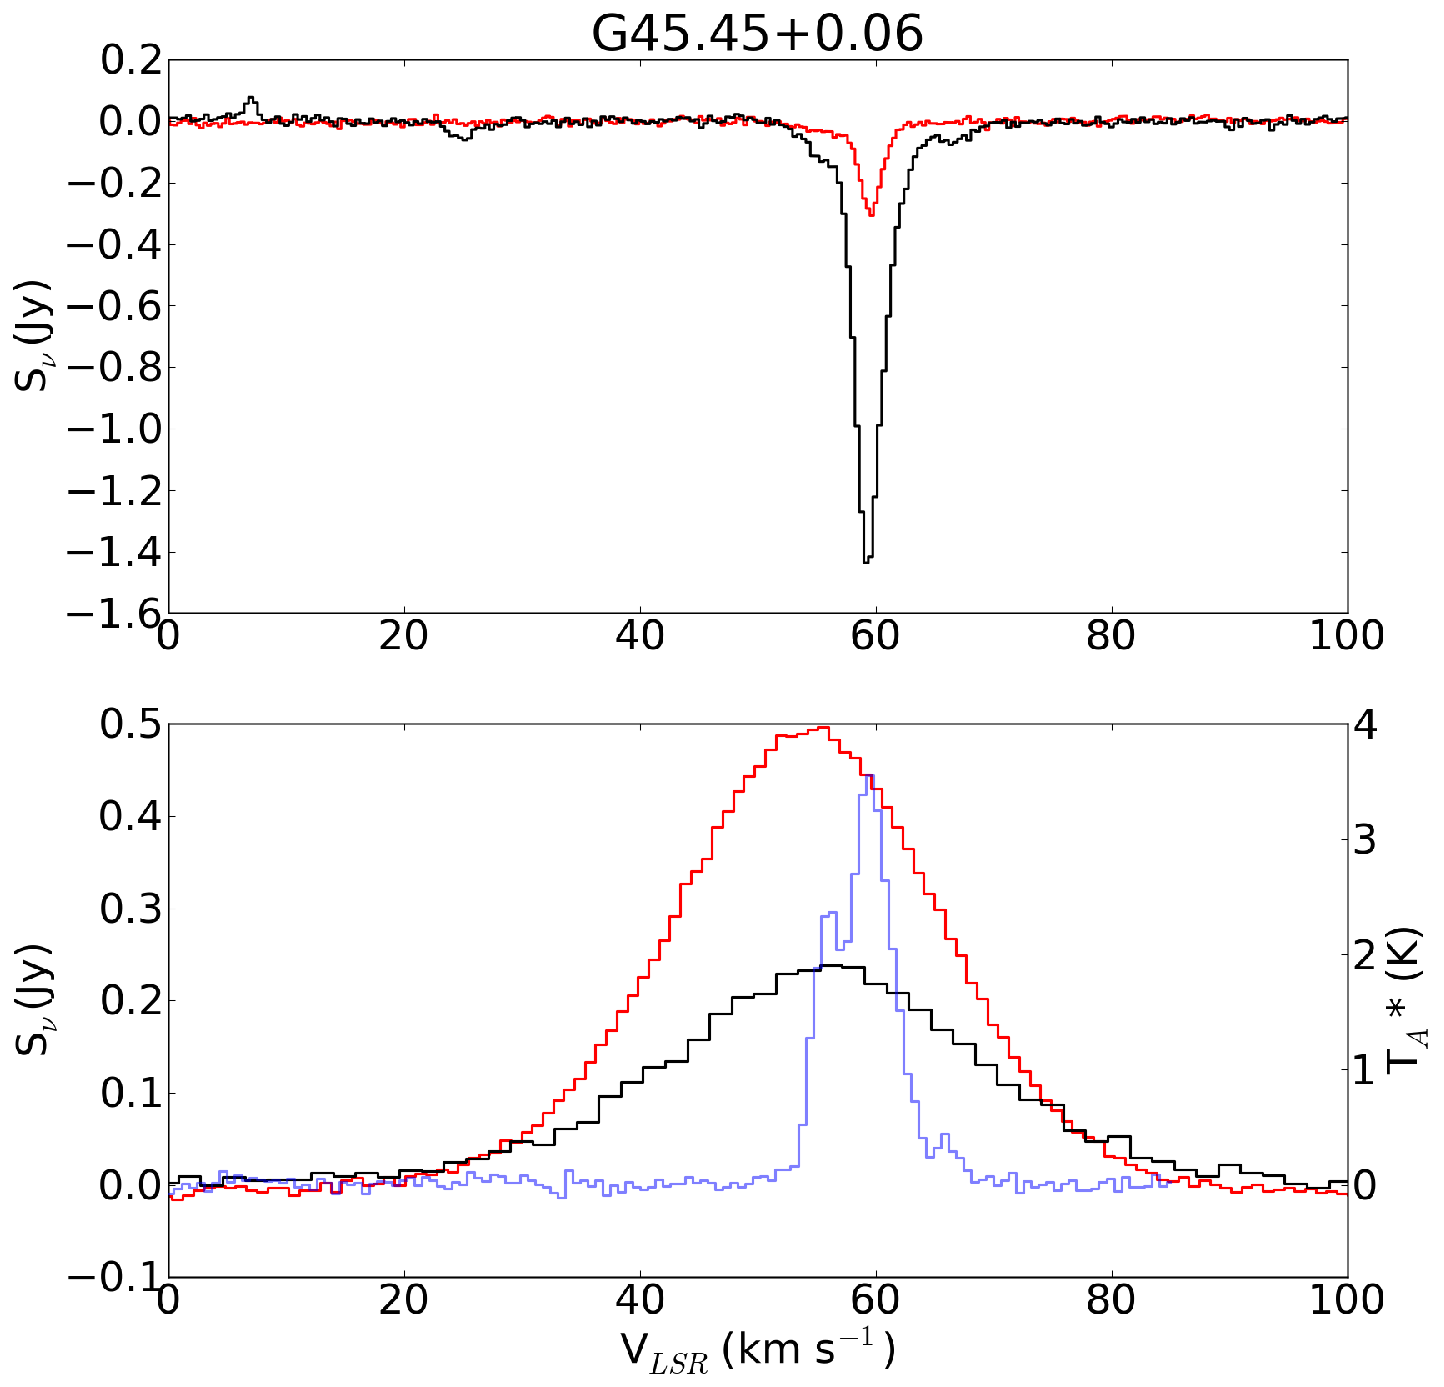
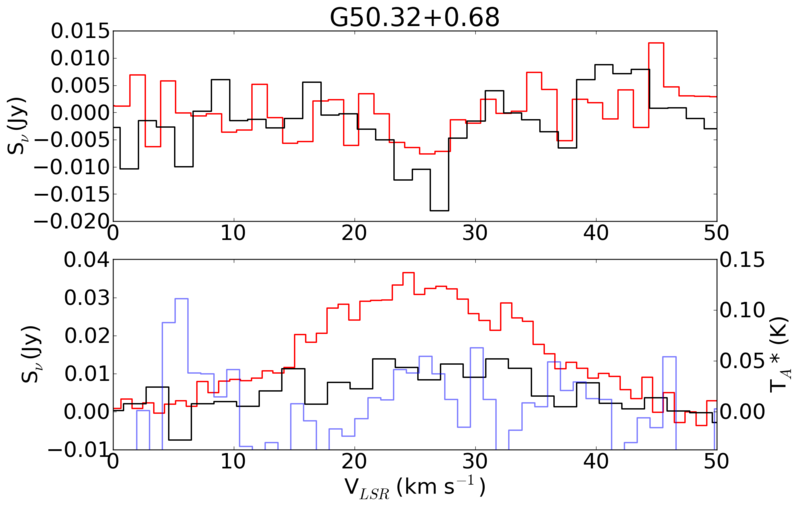
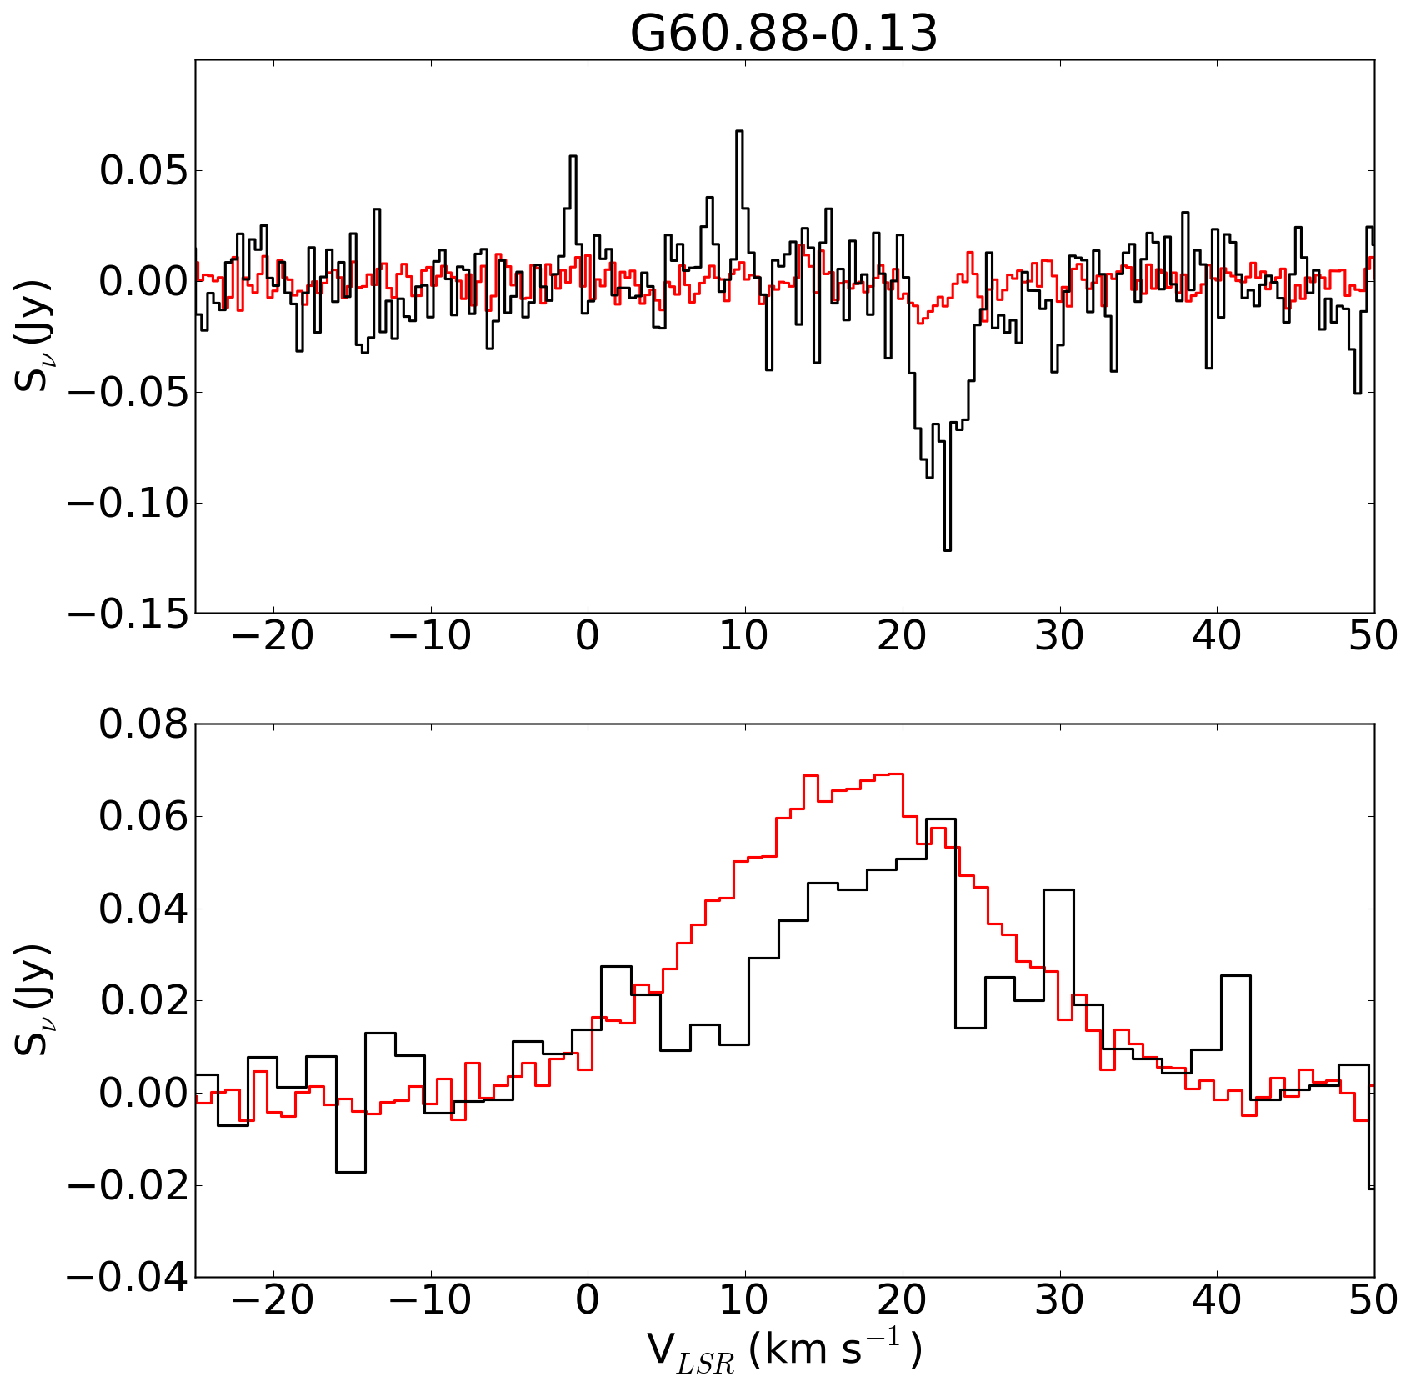
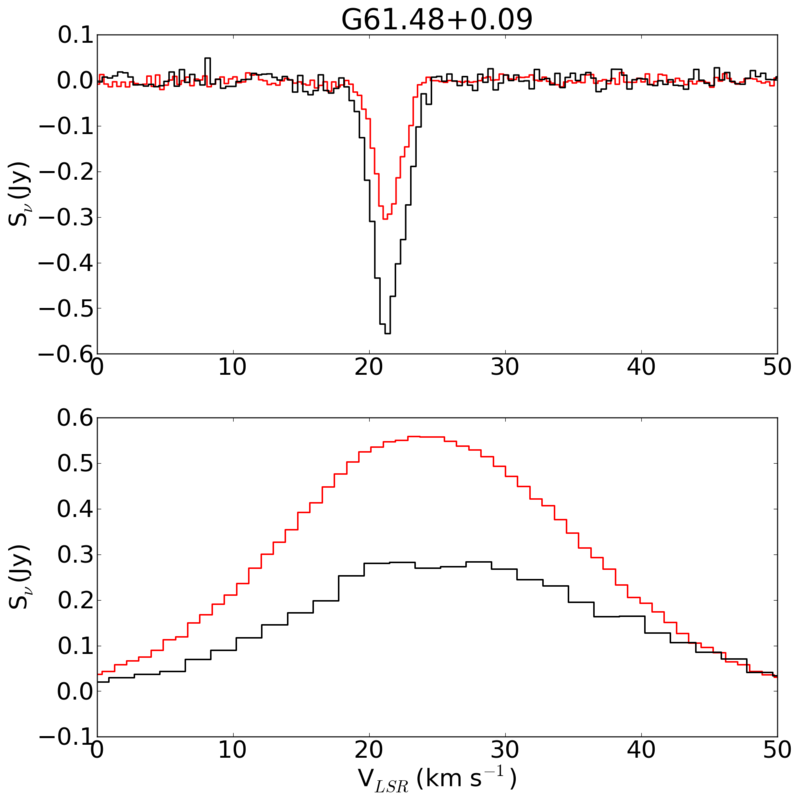
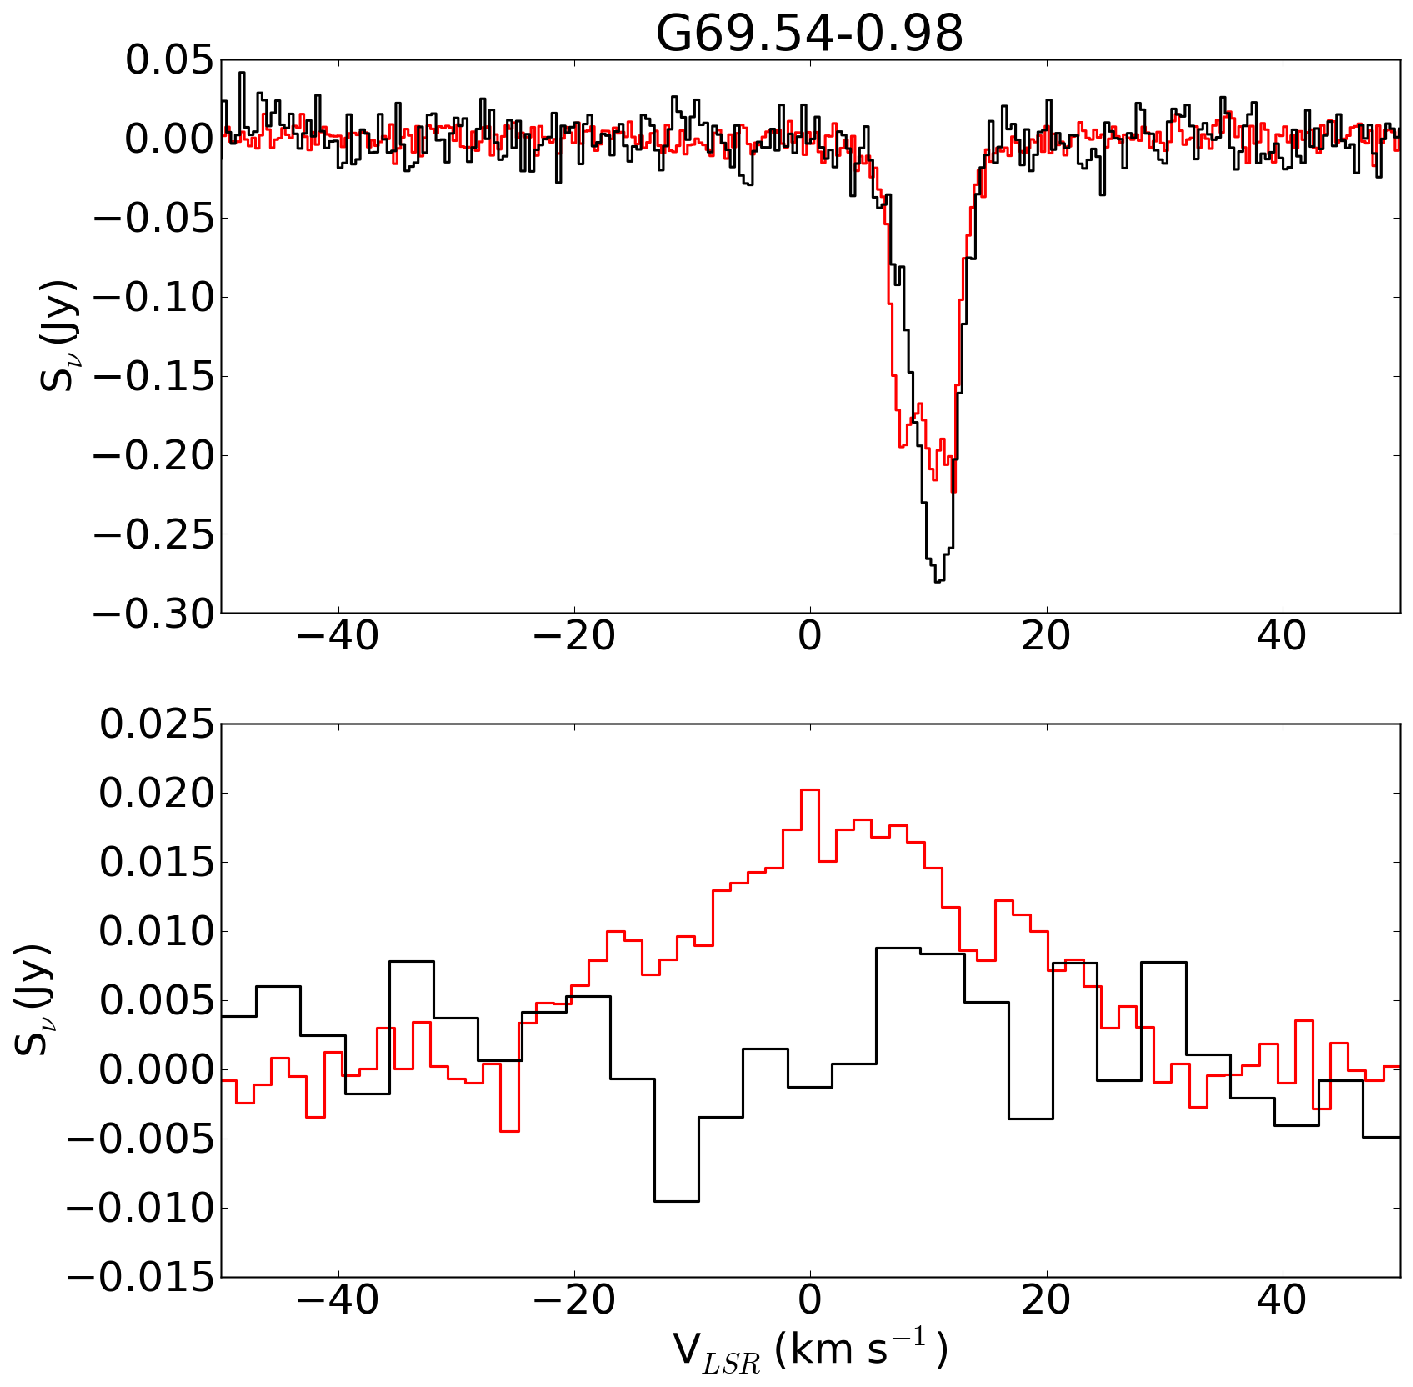
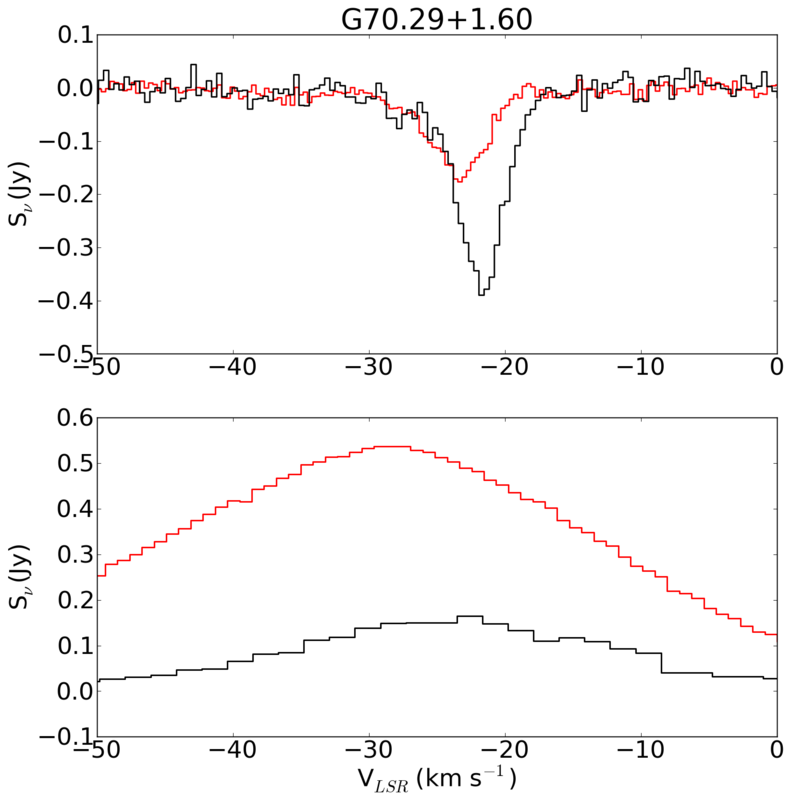
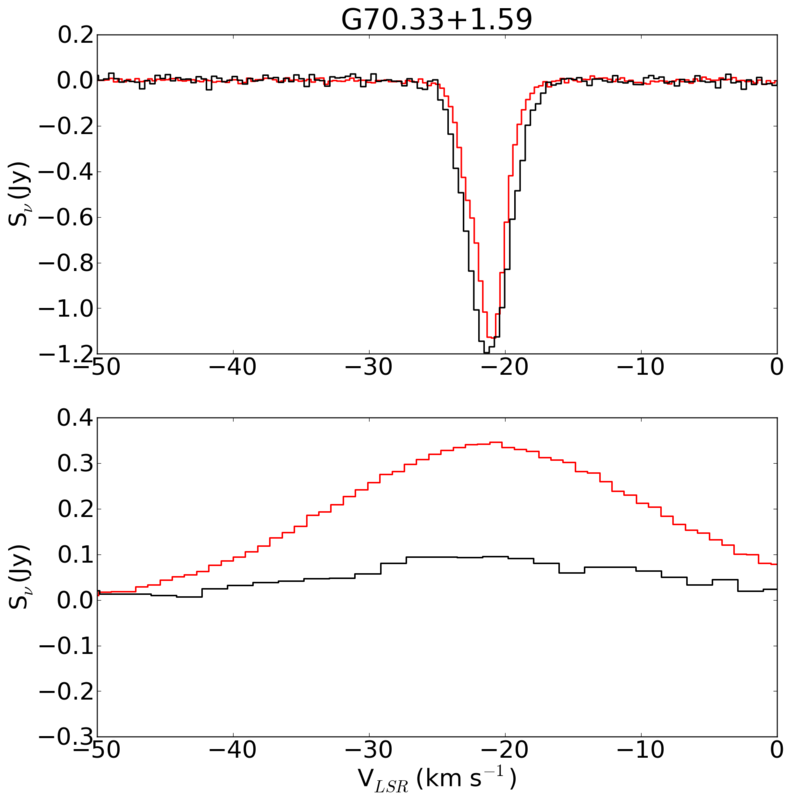
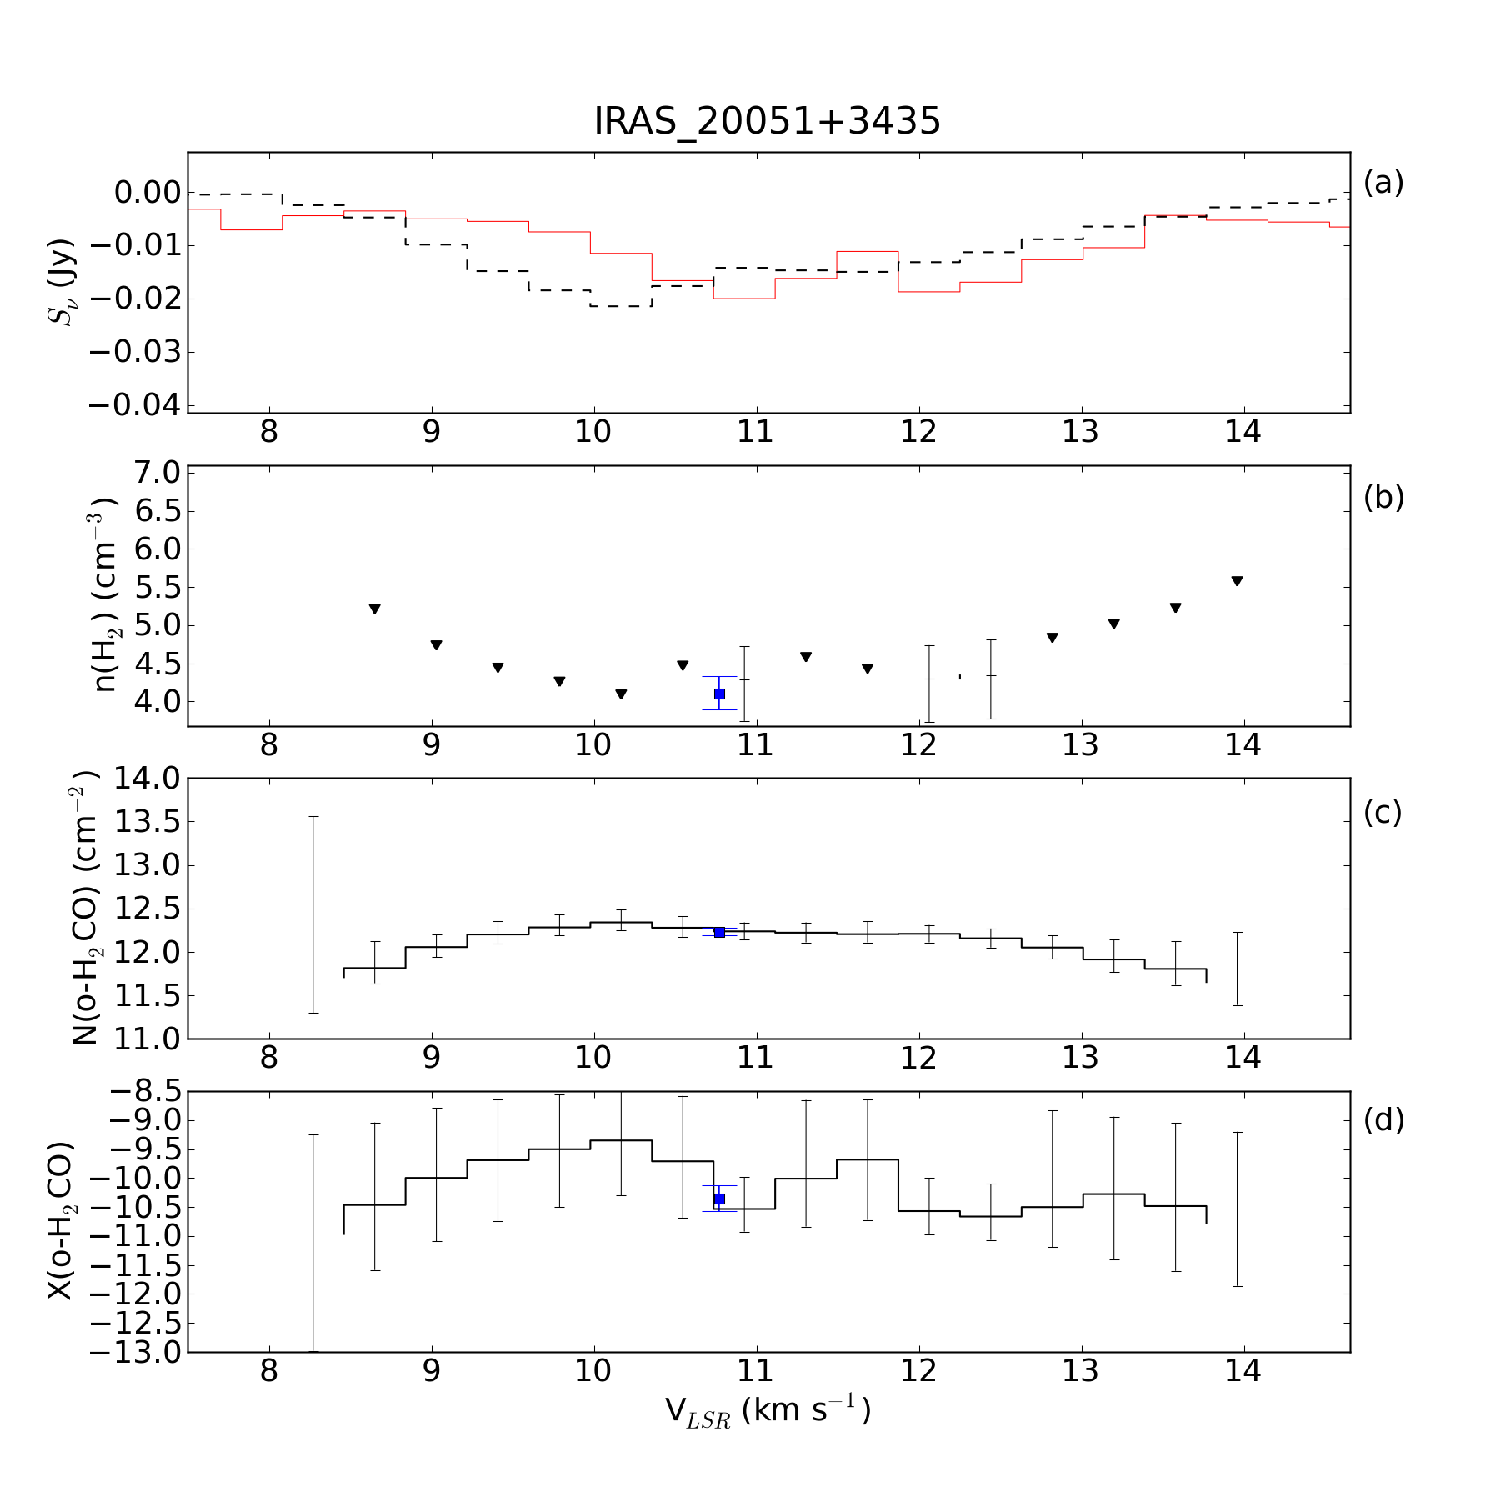
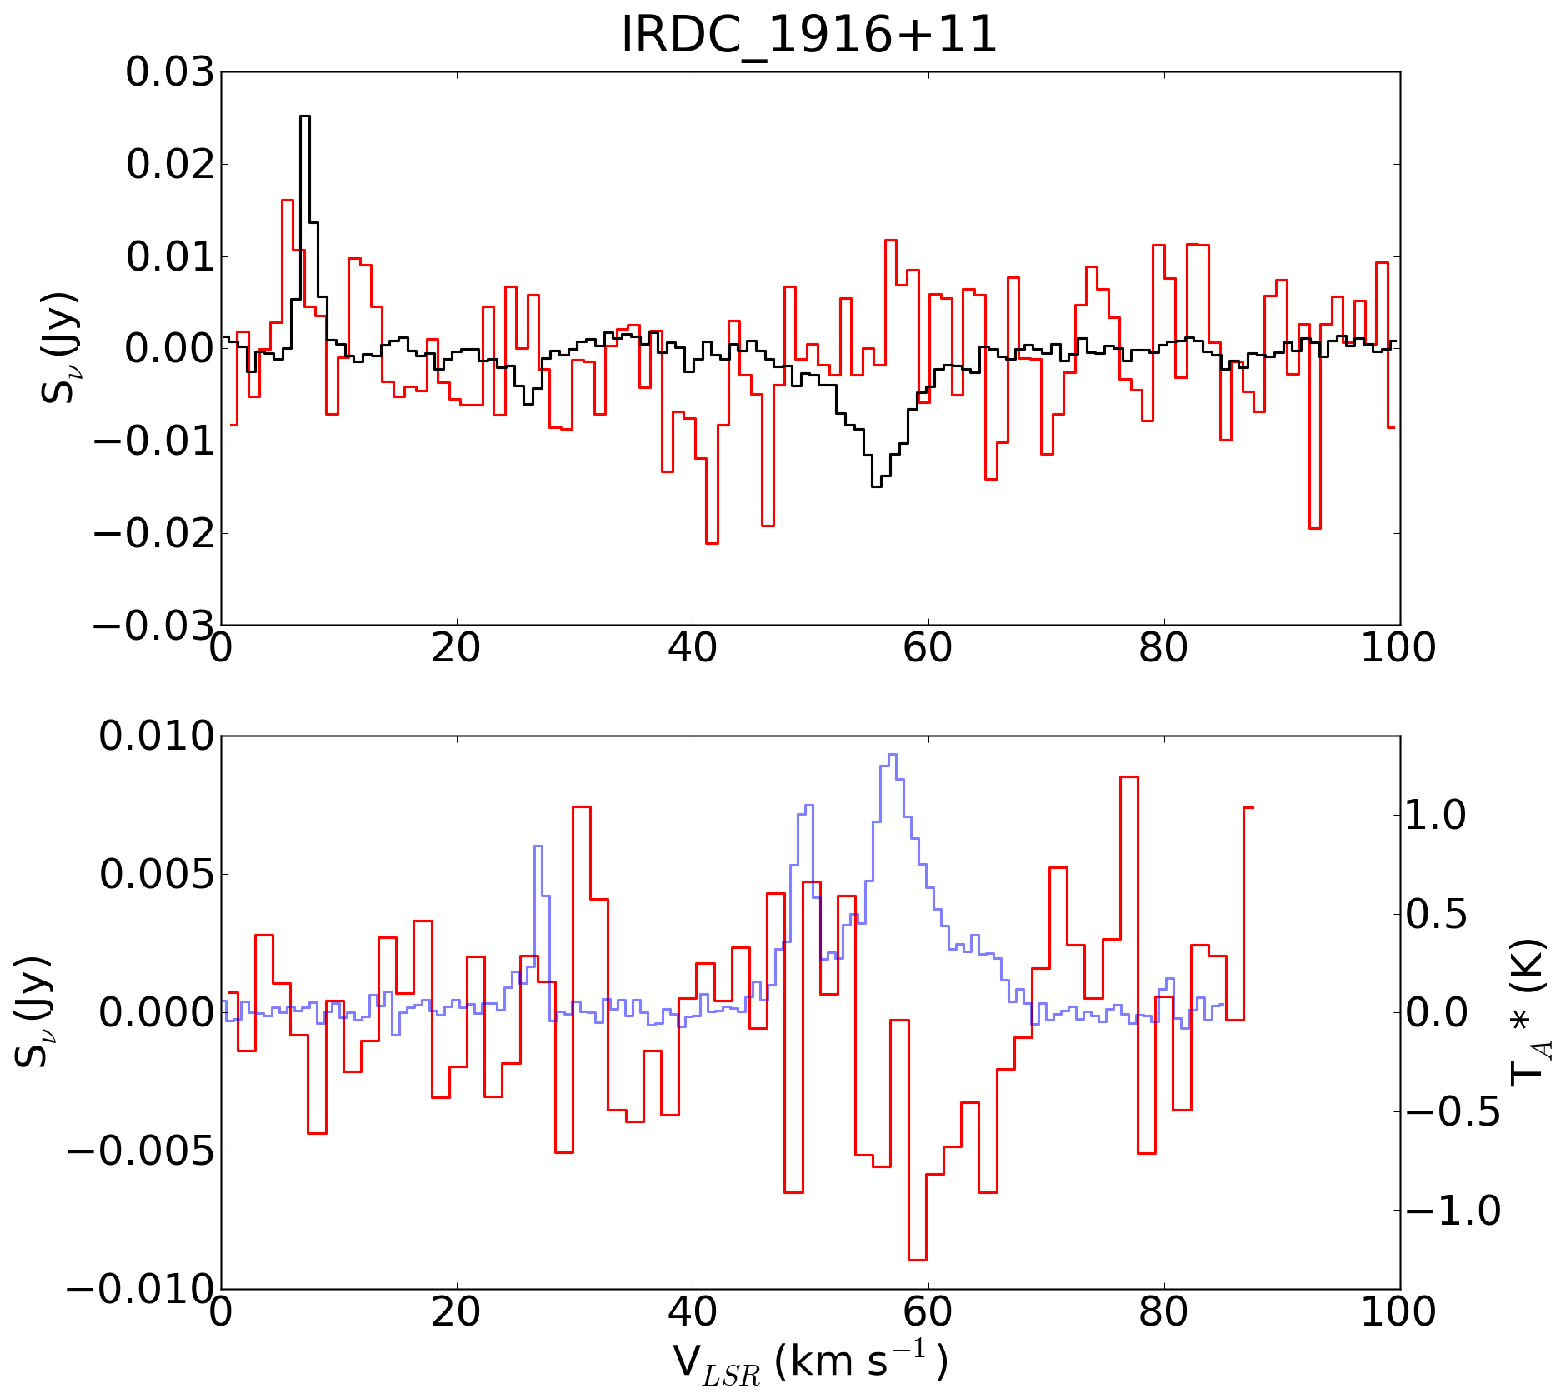
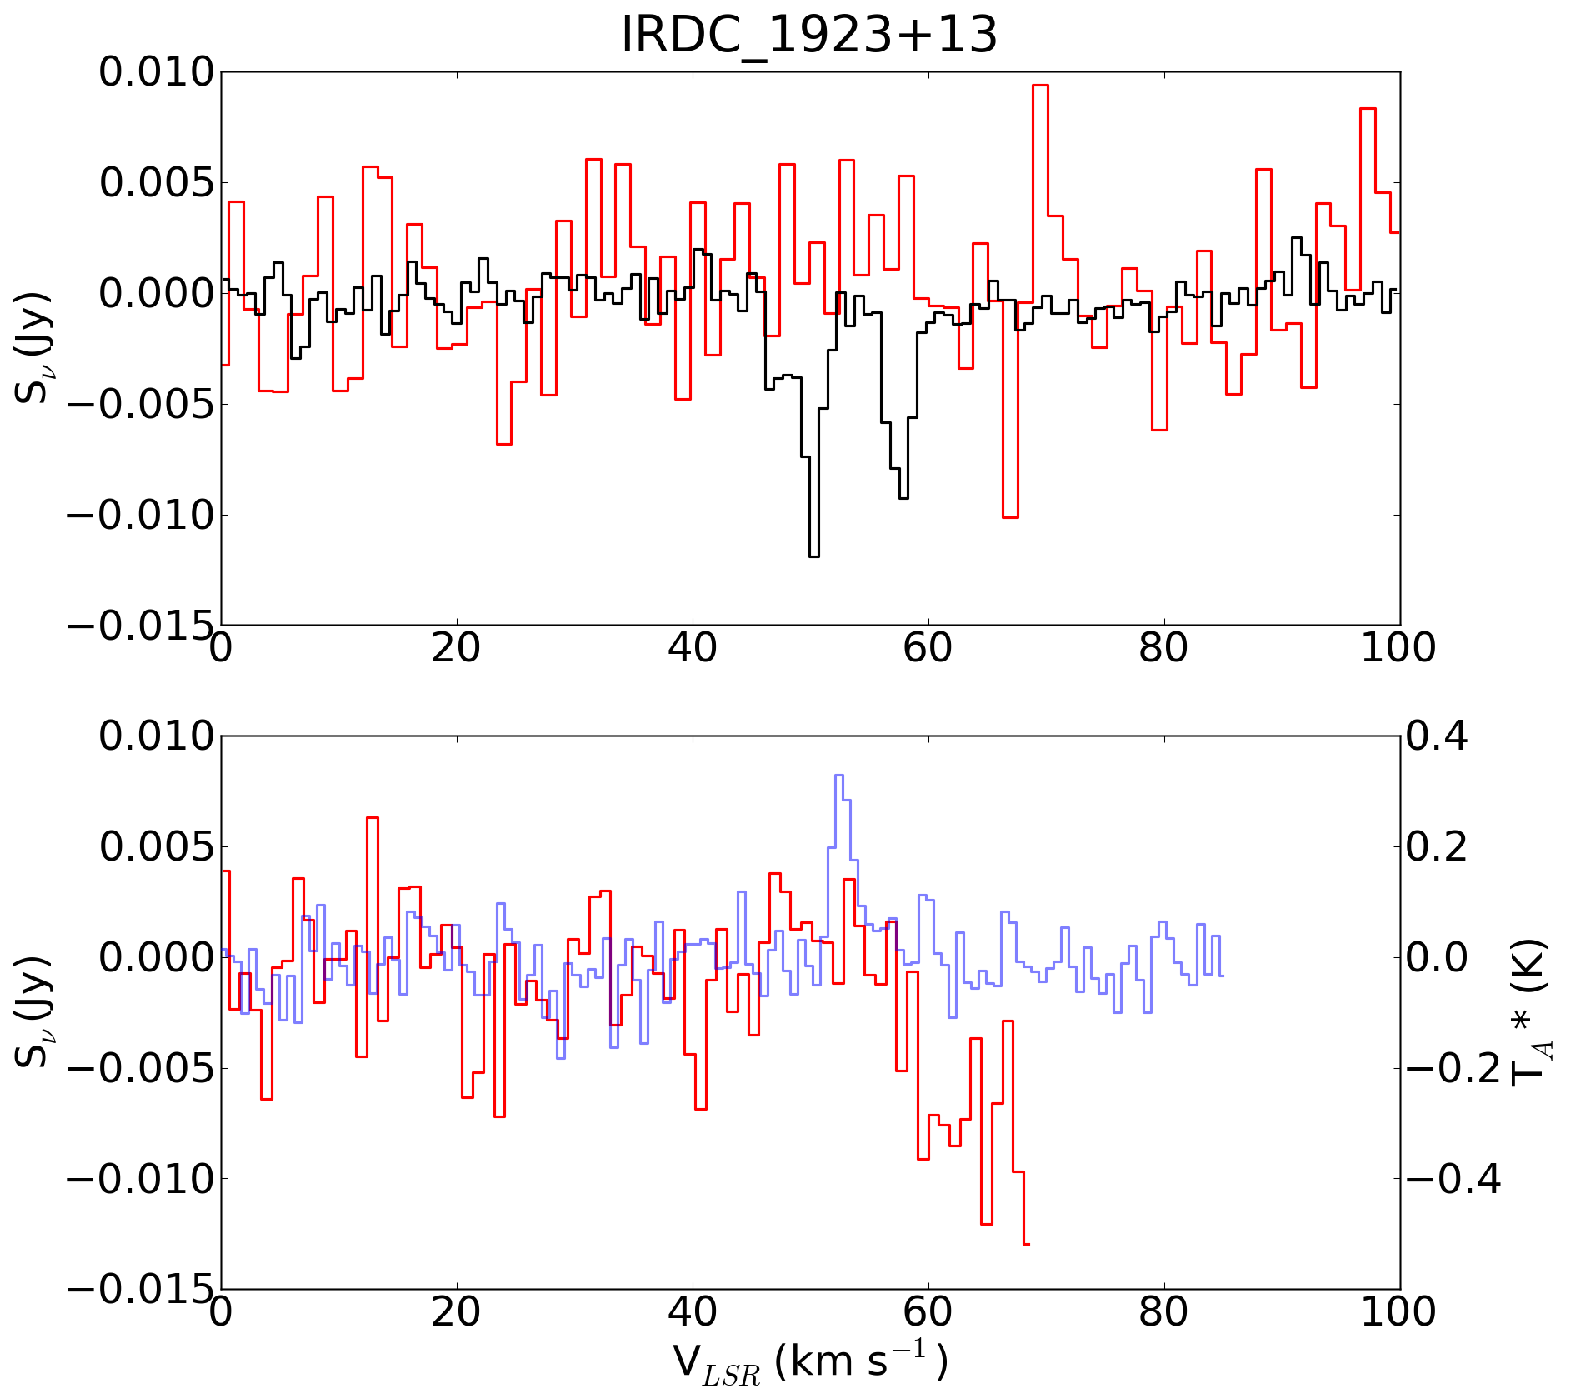
The 2 cm continua were measured by fitting a first-order baseline in each reduced nodded pair excluding the line and the bandpass edges. Figure 1 shows the flat baselines achieved in the observations, though the RRL spectrum shows an example of the artifacts seen at the edges of the bandpass. The continuum error listed in the table is the RMS of only the data included in the baseline fit after the baseline was subtracted from the spectrum; the systematic error from flux calibration uncertainty is 20% and dominant.
2.3. Arecibo
The Arecibo 4.829660 GHz observations used in this project were previously presented in Araya et al. (2002) and Araya et al. (2004) and were kindly provided in reduced form by E. Araya. All observations were performed using standard on/off position switching and 5 minute integration times in both the on and off positions, resulting in off positions 1.25 degrees away from the pointing center. We assume a 30% error in the continuum (based on measured gains in the range 2.0-2.5 as reported in Araya et al. 2002) and an effective diameter of 227m (, sr ) with 10% uncertainty666http://www.naic.edu/$∼$phil/sysperf/misc/hpbw_vs_lambda_2004.html.
The Arecibo spectral lines were re-fit for this paper by converting the Arecibo data from CLASS777CLASS is part of the GILDAS software developed by IRAM. to GBTIDL’s SDFITS format888Code for the CLASS-GBTIDL conversion is available from http://code.google.com/p/casaradio/wiki/class_to_gbt and using GBTIDL’s fitgauss routine. The 6 cm continua were taken directly from Araya et al. (2002) Table 3.

2.4. Other Archival Data
2.4.1 Very Large Array
We acquired VLA archival images from the Multi-Array Galactic Plane Imaging Survey (MAGPIS) 6 cm Epoch 3 data set (Helfand et al. 2006) and the NRAO VLA Archive Survey (NVAS)999The NVAS is run by Lourant Sjouwerman at the NRAO. It has not yet been published.. MAGPIS has a resolution of and sensitivity mJy/bm. The NVAS has variable resolution and sensitivity since it is based on VLA archival data. The VLA data was used to estimate source sizes and interferometer-to-single-dish flux ratios.
2.4.2 Bolocam 1.1 mm
We extract 1.1 mm dust continuum fluxes from the Bolocam Galactic Plane Survey (BGPS) v1.0 release summing over a 25″ radius aperture after subtracting the median in a 50-200″ annulus to remove background contributions. The aperture size is selected to match the 1.1 mm data to the 2 and 6 cm data. We assume a uniform 50% systematic error in BGPS fluxes from combined uncertainties in the calibration and background subtraction. Aguirre et al. (2011) contains a complete discussion of the uncertainties in the BGPS. We apply the Aguirre et al. (2011) recommended flux correction of 1.5 and aperture correction for a 25″ aperture of 1.21. Additionally, data from the Bolocam catalog (Rosolowsky et al. 2010) was used with the flux correction and an aperture correction of 1.46 for 20″ apertures.
2.4.3 Boston University / Five College Radio Observatory Galactic Ring Survey
The BU FCRAO GRS (Jackson et al. 2006) is a survey of the Galactic plane in the 1-0 line with resolution. We extracted spectra in 25″ radius apertures from the publicly available data for comparison with the spectra.
2.4.4 GLIMPSE
The Galactic Legacy Infrared Mid-Plane Survey Extraordinaire (Benjamin et al. 2003, GLIMPSE) maps were used to examine the morphology of the objects in our survey in order to determine whether an IRDC was present.
3. Models and Error Estimation
A grid of large velocity gradient (LVG) models was run using both the RADEX (van der Tak et al. 2007) code and a proprietary code by Henkel et al. (1980) with a gradient of 1 km s-1pc-1. The models from the two codes were consistent to within in predicted optical depth and . Both utilized collision rates from Green (1991) extracted from the LAMDA database101010http://www.strw.leidenuniv.nl/$∼$moldata/ and multiplied by the recommended factor of 1.6 to account for collisions with being more efficient than He. The expected accuracy is . Zeiger & Darling (2010) demonstrated that the errors in collision rates lead to systematic errors (0.3 dex) in the measured quantities (N(), n). When measuring density and column, we used the RADEX models because of their extensively tested code and documentation. All of the models used a kinetic temperature of 40 K and covered a range of 500 densities 500 columns logarithmically sampled over and . The assumption K is reasonable in UCH II regions, which should be warmer than IRDCs and other cold molecular clouds. Dust temperatures measured towards UCH II regions are around 40 K (Rivera-Ingraham et al. 2010). In the foreground clouds, this assumption is less well supported, but as long as the temperatures are higher than K, the models change little with temperature (Figure 2).
Because of a collisional selection effect, above its critical density (, , Mangum et al. 2008) preferentially overpopulates lower states of the K-doublet (J =0, , , Henkel et al. 1980). These spectral lines are cooled to excitation temperatures lower than the CMB and can therefore be seen in absorption against it. The / absorption line ratio is sensitive to the density of at densities , allowing measurements of the density to within 0.3 dex with little sensitivity to gas kinetic temperature (Mangum et al. 2008). When density is ‘measured’ with critical density based tracers such as CO, CS, HCN, or HCO+, the estimate can be off by as much as 2 orders of magnitude because of radiative trapping effects. Similarly, measurements of density assuming spherical symmetry can be very far from the local values.
The collision rates of with have been re-derived with a claimed accuracy of 10% by Troscompt et al. (2009b). Troscompt et al. (2009a) showed that collisions with para- are more efficient at cooling into absorption against the CMB than He or ortho- and that absorption is therefore sensitive to the Ortho/Para ratio of . These improved rates are not used in this paper since they are only computed over a more limited range of temperatures, but may be used in future works.

3.1. Turbulence
Molecular gas is often observed to have spectral line widths consistent with supersonic turbulence (Kainulainen et al. 2009) and therefore a lognormal density distribution (Kritsuk et al. 2007). Our LVG models assume constant density per velocity bin, so the resulting models should be smoothed by the probability distribution function (PDF) of the density. For clouds with a narrow density distribution (logarithmic standard deviation of the density )111111We use to indicate number density in this section in order to be consistent with the cited literature. Because the widths are relative to a mean density, the scaling between mass and number density is unimportant., the effect of smoothing is smaller than other systematic errors, but for more turbulent clouds the density PDF width can exceed an order of magnitude (e.g., Federrath et al. 2010) and will substantially change the derived density. Because the Mach numbers of the turbulence in the observed clouds are unconstrained, we cannot correct for this added uncertainty. The change in measured density is for , with a slight bias towards higher densities at lower optical depth ratio (Figure 3). However, for , the bias exceeds an order of magnitude at some densities.
Additionally, we consider the effects of “gravoturbulence”, in which a high-density tail inconsistent with a lognormal distribution is observed. Kainulainen et al. (2009) report column density distributions derived from 2MASS extinction measurements that can be used as a proxy for the density distribution for a wide variety of clouds. Non-star-forming clouds retain a lognormal distribution and are consistent with the analysis presented above. However, evolved star-forming regions develop a high-column density tail. For evolved (actively star-forming) regions like Ophiucus, Orion, and Perseus, the high-column density tail is substantial, and density measurements will be highly biased towards the highest density gas. More quiescent regions like the Pipe and Coalsack nebulae are consistent with a lognormal column distribution to a degree that the high-column density tail would not affect density measurements significantly.

To demonstrate the effects of turbulent distributions, we calculate the optical depth ratio as a function of the mean density for three turbulent widths in Figure 3. We compare the density that would be inferred from the spectral line ratio assuming no turbulence (just LVG) to the ‘correct’ density including turbulent effects in Figure 4. We have also compared the LVG and turbulent densities to “gravoturbulent” density distributions, in which a power law tail of high-density gas begins at about times the peak density (e.g., Klessen 2000; Cho & Kim 2011), but because the density distributions in these simulations are relatively narrow, the effects of the high-density tail on the measured density are negligible except for the most turbulent cases.
Figure 3 is meant to demonstrate the effects of turbulence, but it is not used to derive densities, since the true density distribution in observed clouds is unknown. However, future measurements of the density distribution can be used to apply the ‘correction’ shown in Figure 4.

4. Analysis
4.1. Measuring Line Optical Depth
In order to measure physical properties of an absorbing source, measurements must be obtained of the optical depths of both the and lines. These measurements are presented in Tables 1 and 1. Once an optical depth with errors is determined, the spectral line depths can be matched to large velocity gradient (LVG) models to determine column and spatial density. The spectral line optical depth depends both on the nadir flux density of the absorption line and the strength of the illuminating background continuum source. If the background is the CMB, the ‘filling factor’ of the molecular cloud is simply its size relative to the beam size. If there is a continuum source in addition to the CMB, the size of the continuum source and the intervening molecular cloud both affect the absorption depth. Throughout this paper, we use the term ‘filling factor’ to refer to the fraction of the beam area filled by the absorbing molecular cloud and ‘covering factor’ to refer to the fraction of the background continuum source that is covered by the intervening molecular material.
The VLA archival images were used to estimate the size of the illuminating background source. When images at both wavelengths were available, we separately determined the 2 cm and 6 cm source sizes. The source size determination is imprecise because we select a single source size for non-uniform surface brightness profiles, and in many cases the VLA observation did not recover the full flux density seen in single-dish measurements. Araya et al. (2002) estimated the interferometer-to- single-dish flux ratio at 6 cm in this sample and found that the interferometer observations recovered anywhere from 3% to 100% of the single-dish flux. We repeat these measurements at 2 cm and find that the typical recovery fraction is higher, to , although sources for which only VLA upper limits could be measured have recovery fractions .

The optical depth measurements were “filling factor corrected” by assuming the CMB only contributed flux density over the same area as the H II region (i.e., the foreground cloud covers the exact same patch of sky as the UCH II region). When the H II region is small (e.g., 10% of the beam area or less), the contribution of the CMB to the continuum is negligible, but in cases of more diffuse H II regions, the CMB contribution is significant, particularly at 2 cm. The inferred optical depths and source areas are presented in Table 4. Both “filling factor corrected” and uncorrected densities are presented in Table 5. The effect of the filling factor correction (FFC) on density measurements is shown in Figure 5. In a few cases, no volume density-column density parameter space in the models (Section 3) was consistent with the spectral line ratio after filling factor correction: in these cases, the filling factor correction was not used. Similarly, no filling factor correction was applied to sources without detected continuum. These exceptions are noted in Table 5 in the “Flag” column.
The above definitions are summarized briefly in the following equations:
in which CF is the “covering factor”, FF is the “filling factor”, and there is no positive contribution from the CMB because it is assumed to be removed by position-switching.
The systematic uncertainties in the continuum and the filling factor result in similar errors in the optical depth measurement, and together dominate the total error budget for our measurements. A 30% error in the and 20% error in the continuum levels were assumed because of flux calibration uncertainty characteristic of the instruments. An additional 10% error in the beam area, which sets the maximum coupling to the CMB (assuming a beam-filling source), was included to account for focus error. A 20% statistical error in the cloud filling factor was assumed for the majority of the survey, but it was decreased to 10% when the ratio of continuum to CMB flux was and the source size was small, indicating that the VLA-measured source is indeed the dominant continuum component in the beam. The statistical error does not account for systematic errors in the geometric assumptions. Note that changes to the filling factor should have a minimal effect on the derived density unless the source sizes at 2 cm and 6 cm differ substantially, while changes in the filling factor will always have a large effect on the derived column density (Figure 6).

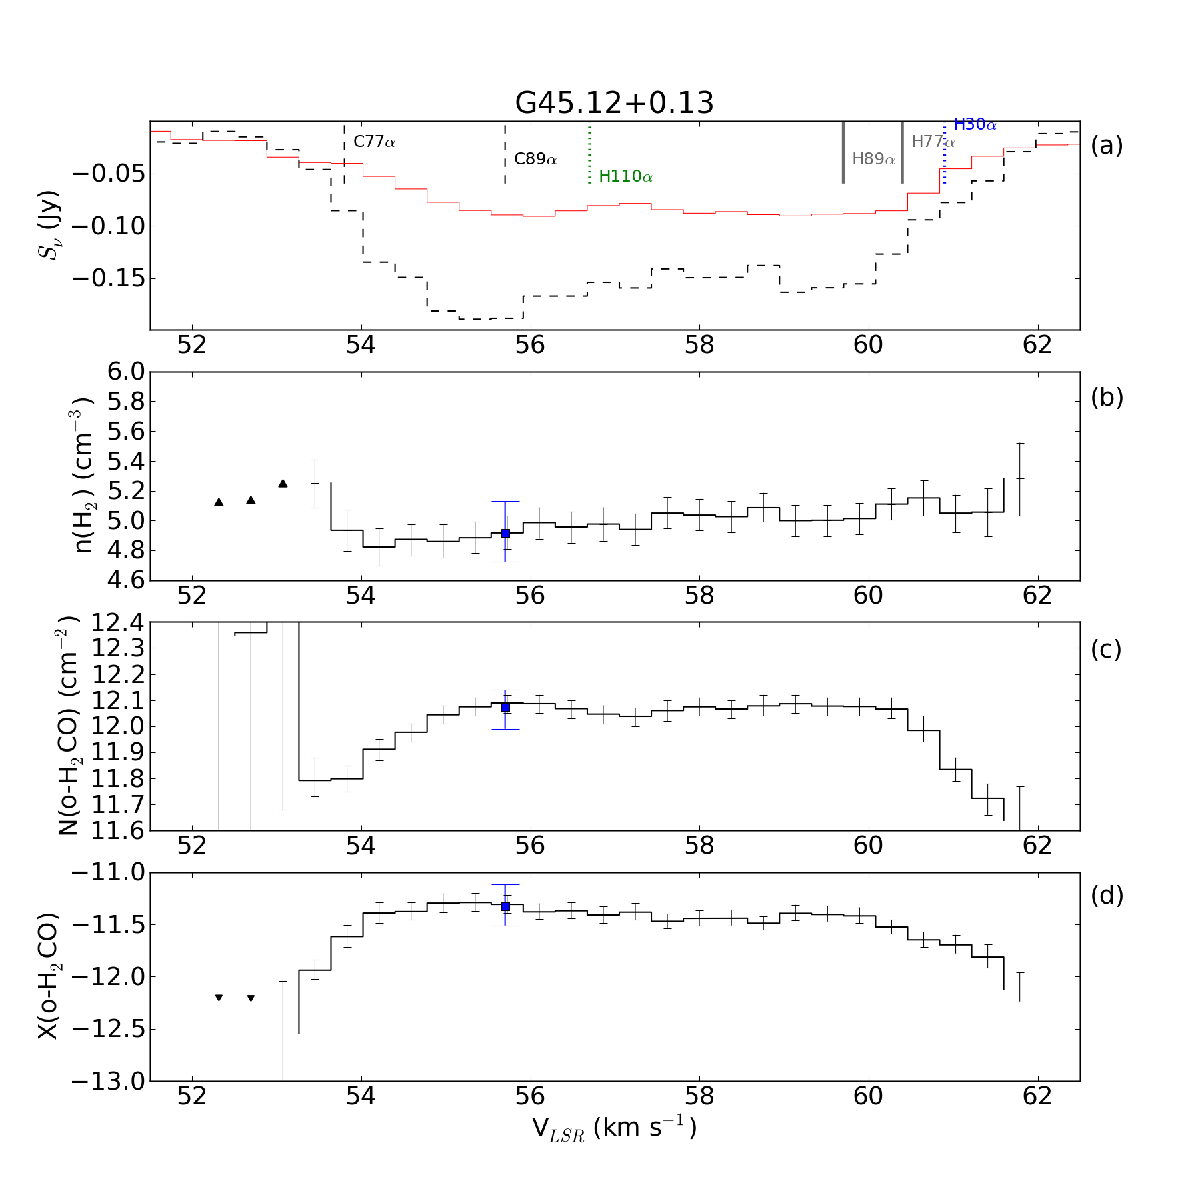
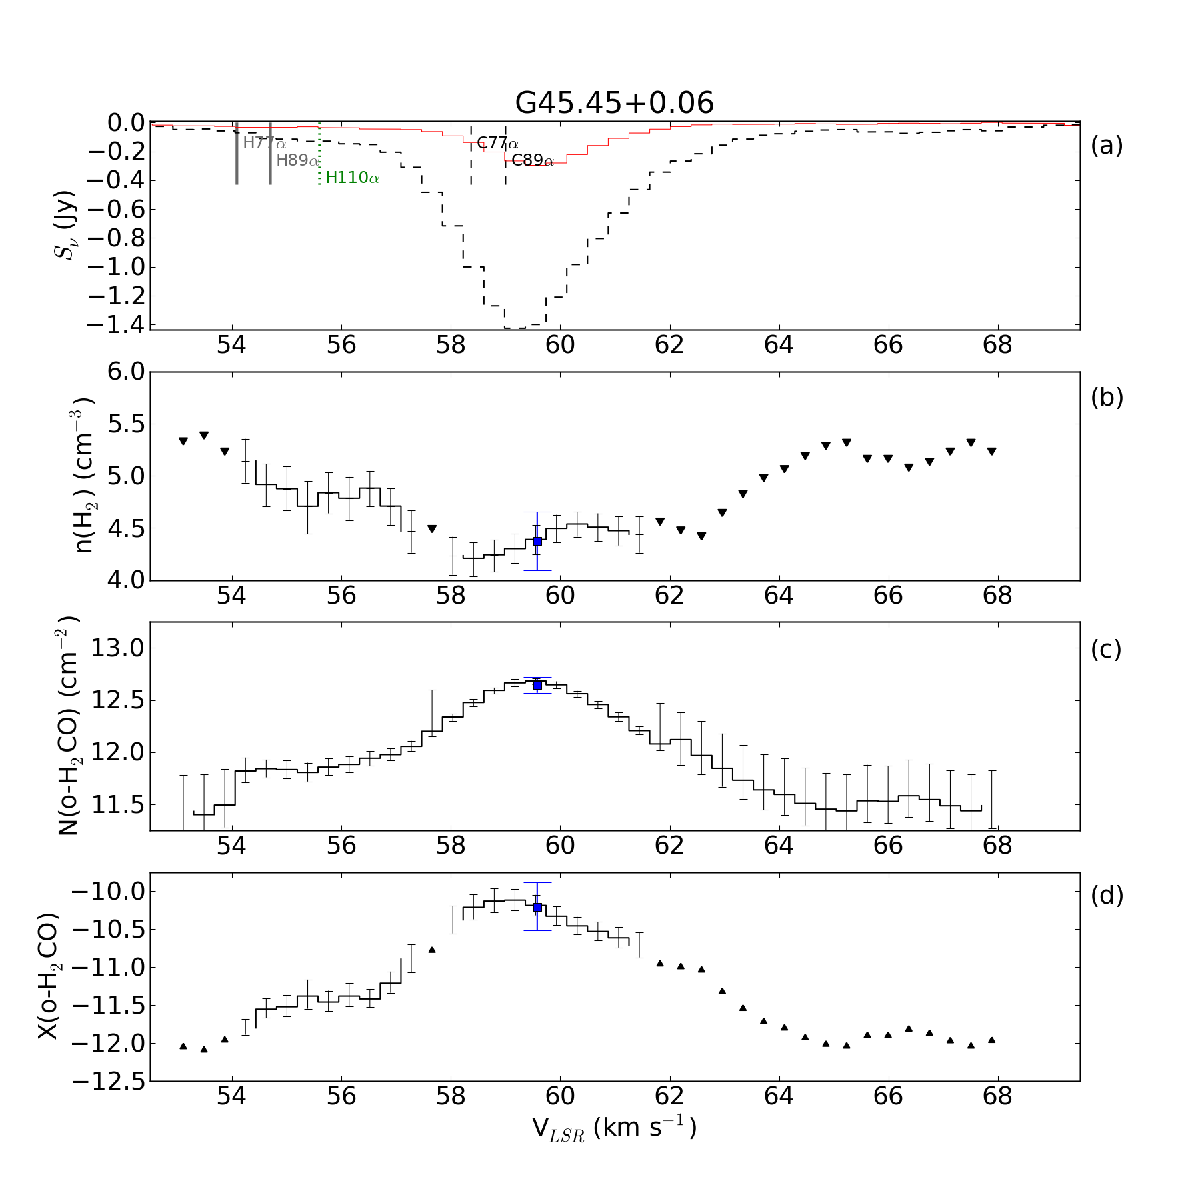
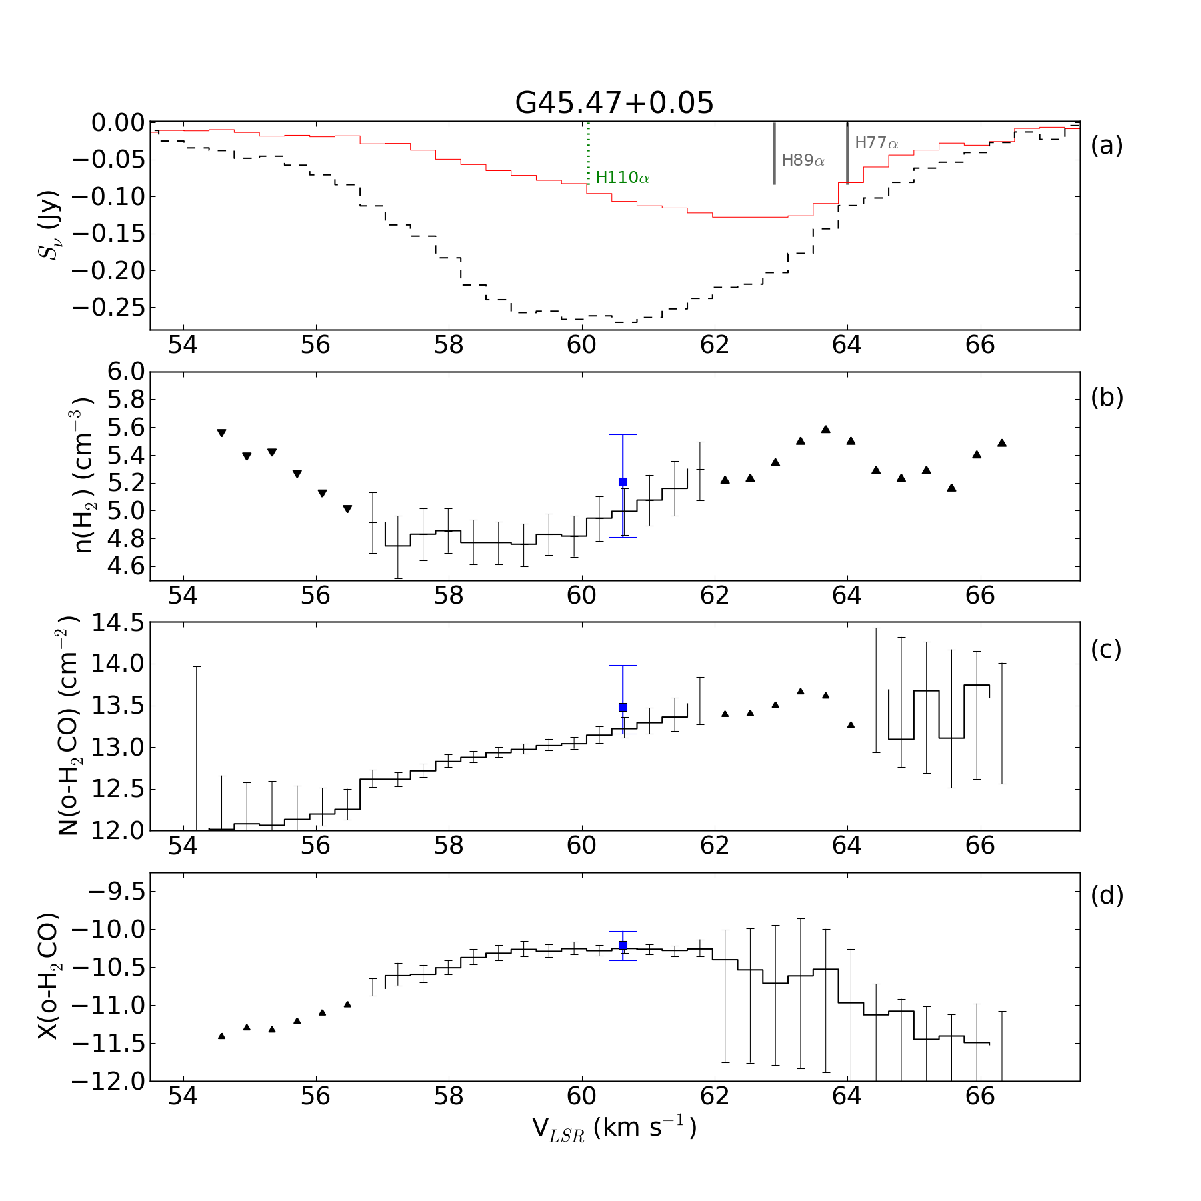
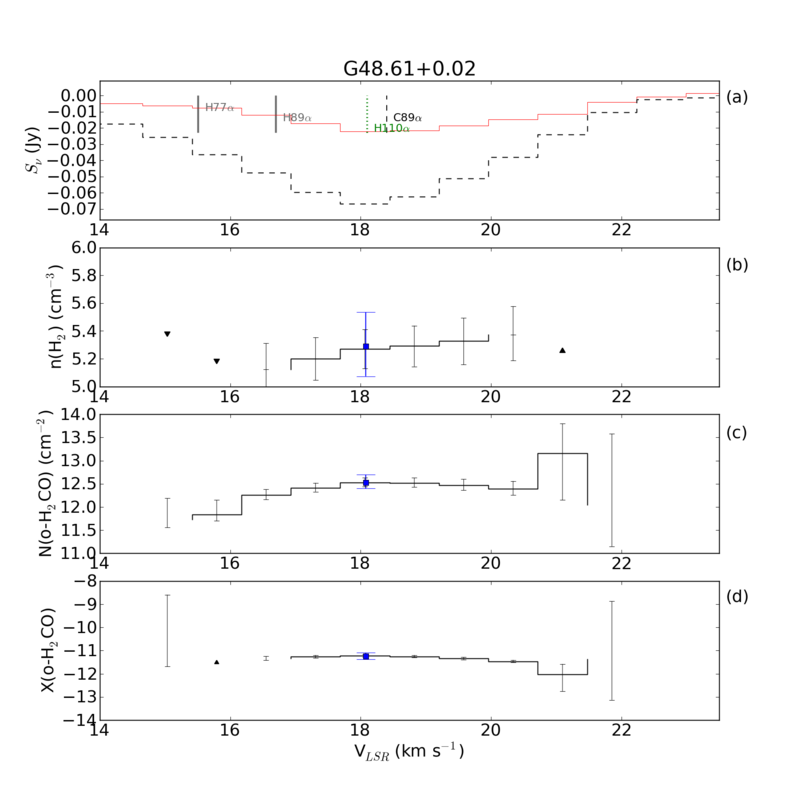
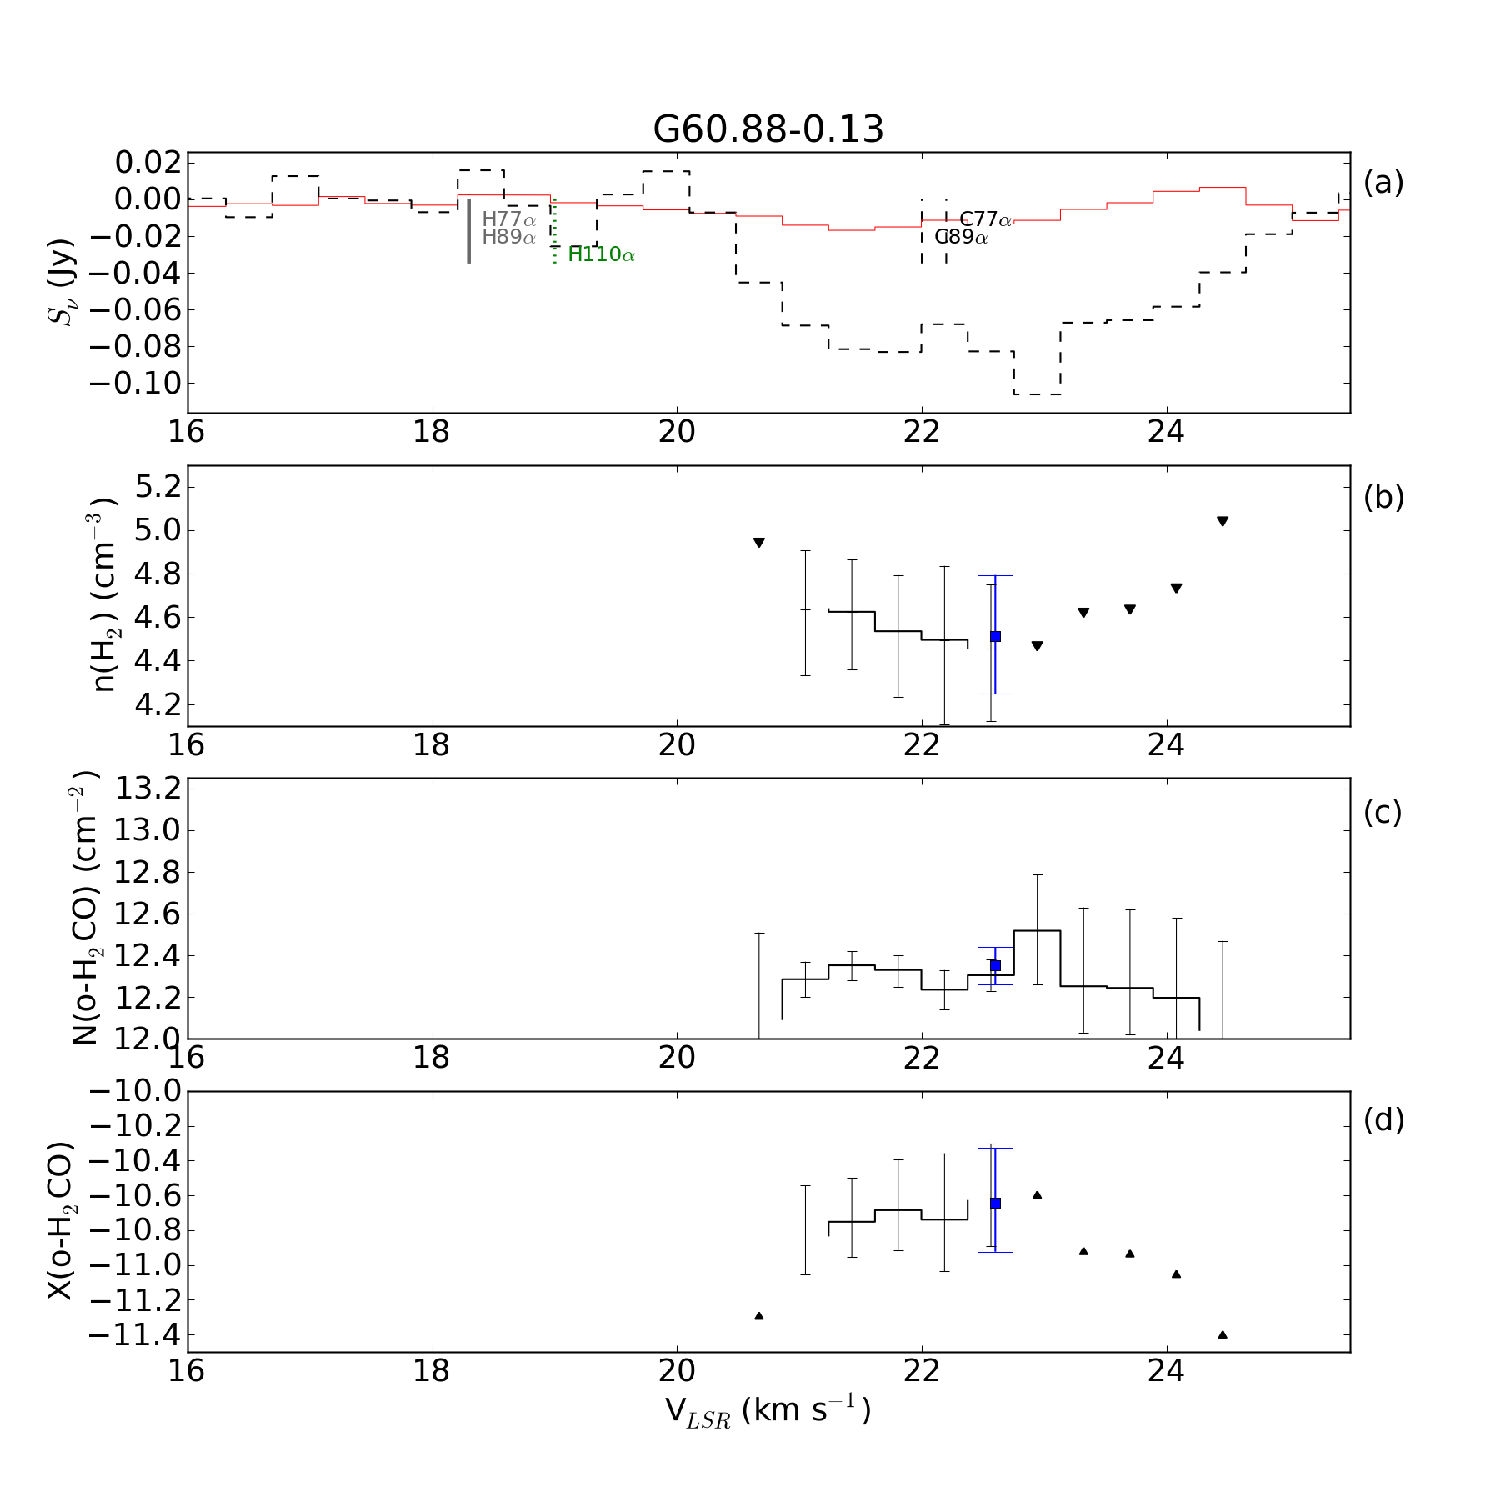
Measurements of volume and column density were taken by averaging over the regions of LVG model parameter space consistent with both spectral line optical depth measurements to within . The “” (68% confidence; errors are non-gaussian) error bars on the derived parameters () were taken to be the extrema of these regions. An example of this fitting process is shown in Figure 7. A second example demonstrating a lower-limit on the density (instead of a direct measurement) is shown in Figure 8. This method is not as robust as fitting, but because there are no free fit parameters, a statistically meaningful cannot be computed.
In some cases, the ratio of the spectral line optical depths was consistent with low density ( ) and high abundances ( per km s-1pc-1), but these were ruled out based on the prior assumption that extremely high abundances should not be observed at very low densities, since it is formed at higher densities and destroyed by hard UV at low columns (see discussion in Troscompt et al. 2009a).


4.2. Systematic Errors: Absorption Geometry
There are potential systematic errors associated with geometric assumptions, i.e. the filling factor. There are four geometric configurations possible; these are outlined in Table 6. The “small source” geometry (3 and 4) is technically impossible given that the CMB is always present in these observations, but it is equivalent to the scenario in which the small illuminating compact source (UCH II) is much brighter than the CMB in the beam. The second column shows the effects of applying the ‘true’ filling factor correction for errors 2 and 4. For error type 3, the optical depth will only be overestimated if the absorber is “corrected” to be smaller than the background source (i.e., if a correction is applied when none should have been).
Figure 6 shows the effects of incorrect geometric assumptions. Type 1 and 3 errors - i.e. filling factor overcorrections - will result in measurements of column and abundance that are greater than the real values, while type 2 and 4 errors will result in column and abundance measurements that are lower than the real values.
Additionally, it is possible that an observation will include a beam-filling, low-density source that will contribute negligibly in line absorption but substantially in absorption over most of the beam area. This type of error will result in an underestimate of the volume density.
Since these errors are failures of assumptions, they cannot be quantified, but Figure 5 shows the effects of correcting for these errors to the extent possible with the available data.
| Real Geometry | Assumed filling factor | Assumed filling factor |
|---|---|---|
| 1. Beam-filling source, beam-filling absorber | aa measured optical depth | |
| 2. Beam-filling source, small absorber | ||
| 3. Small source, beam-filling absorber | ||
| 4. Small source, smaller absorber |
4.3. RRLs
Radio recombination lines are used to measure the velocity of the UCH II regions. The recombination lines 75-77 were independently fitted with gaussians because the signal-to-noise in each spectrum with a detection was high. Out of our 24 spectra, there were 21 H detections, 13 He detections, and 12 C detections; Table 7 shows the fitted parameters using the 76 lines (75 and 77 were also measured but are not reported for brevity). For some of the analysis in later sections, we additionally use the deeper and more careful RRL study by Roshi et al. (2005), who observed 17 of our sample in the 89-92 lines. We attempted to measure carbon RRLs in the Araya et al. (2002) spectra, who only measured hydrogen RRLs. We detected one carbon line in G61.48 and tentatively () detected another three in G32.80, G34.26, and G45.45; we report the low-significance detections in these sources because of corresponding detections of C75-77.
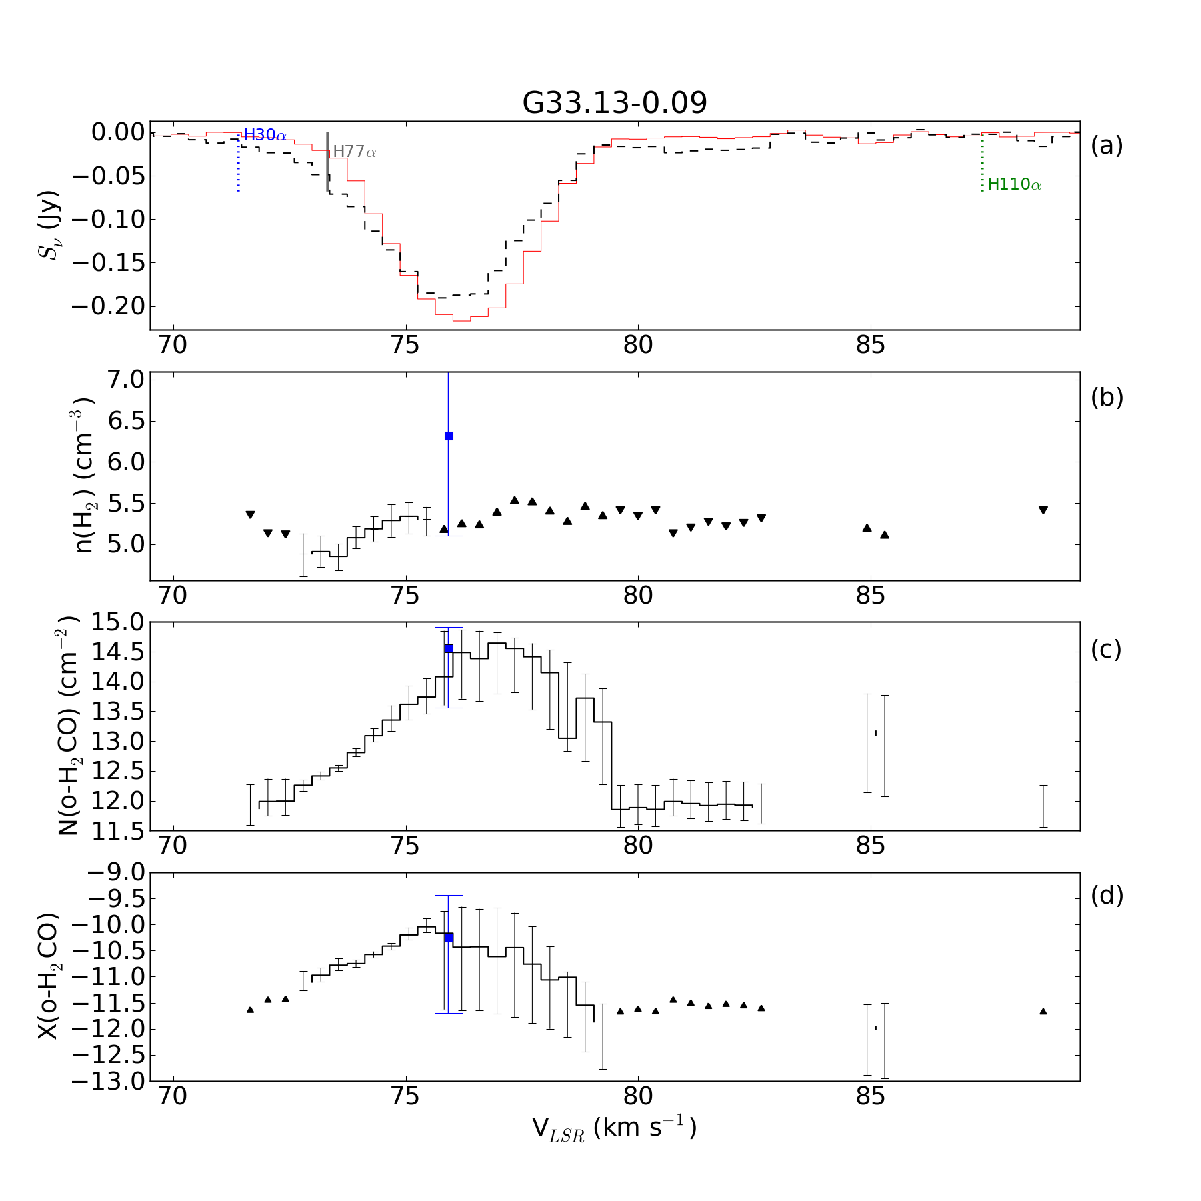
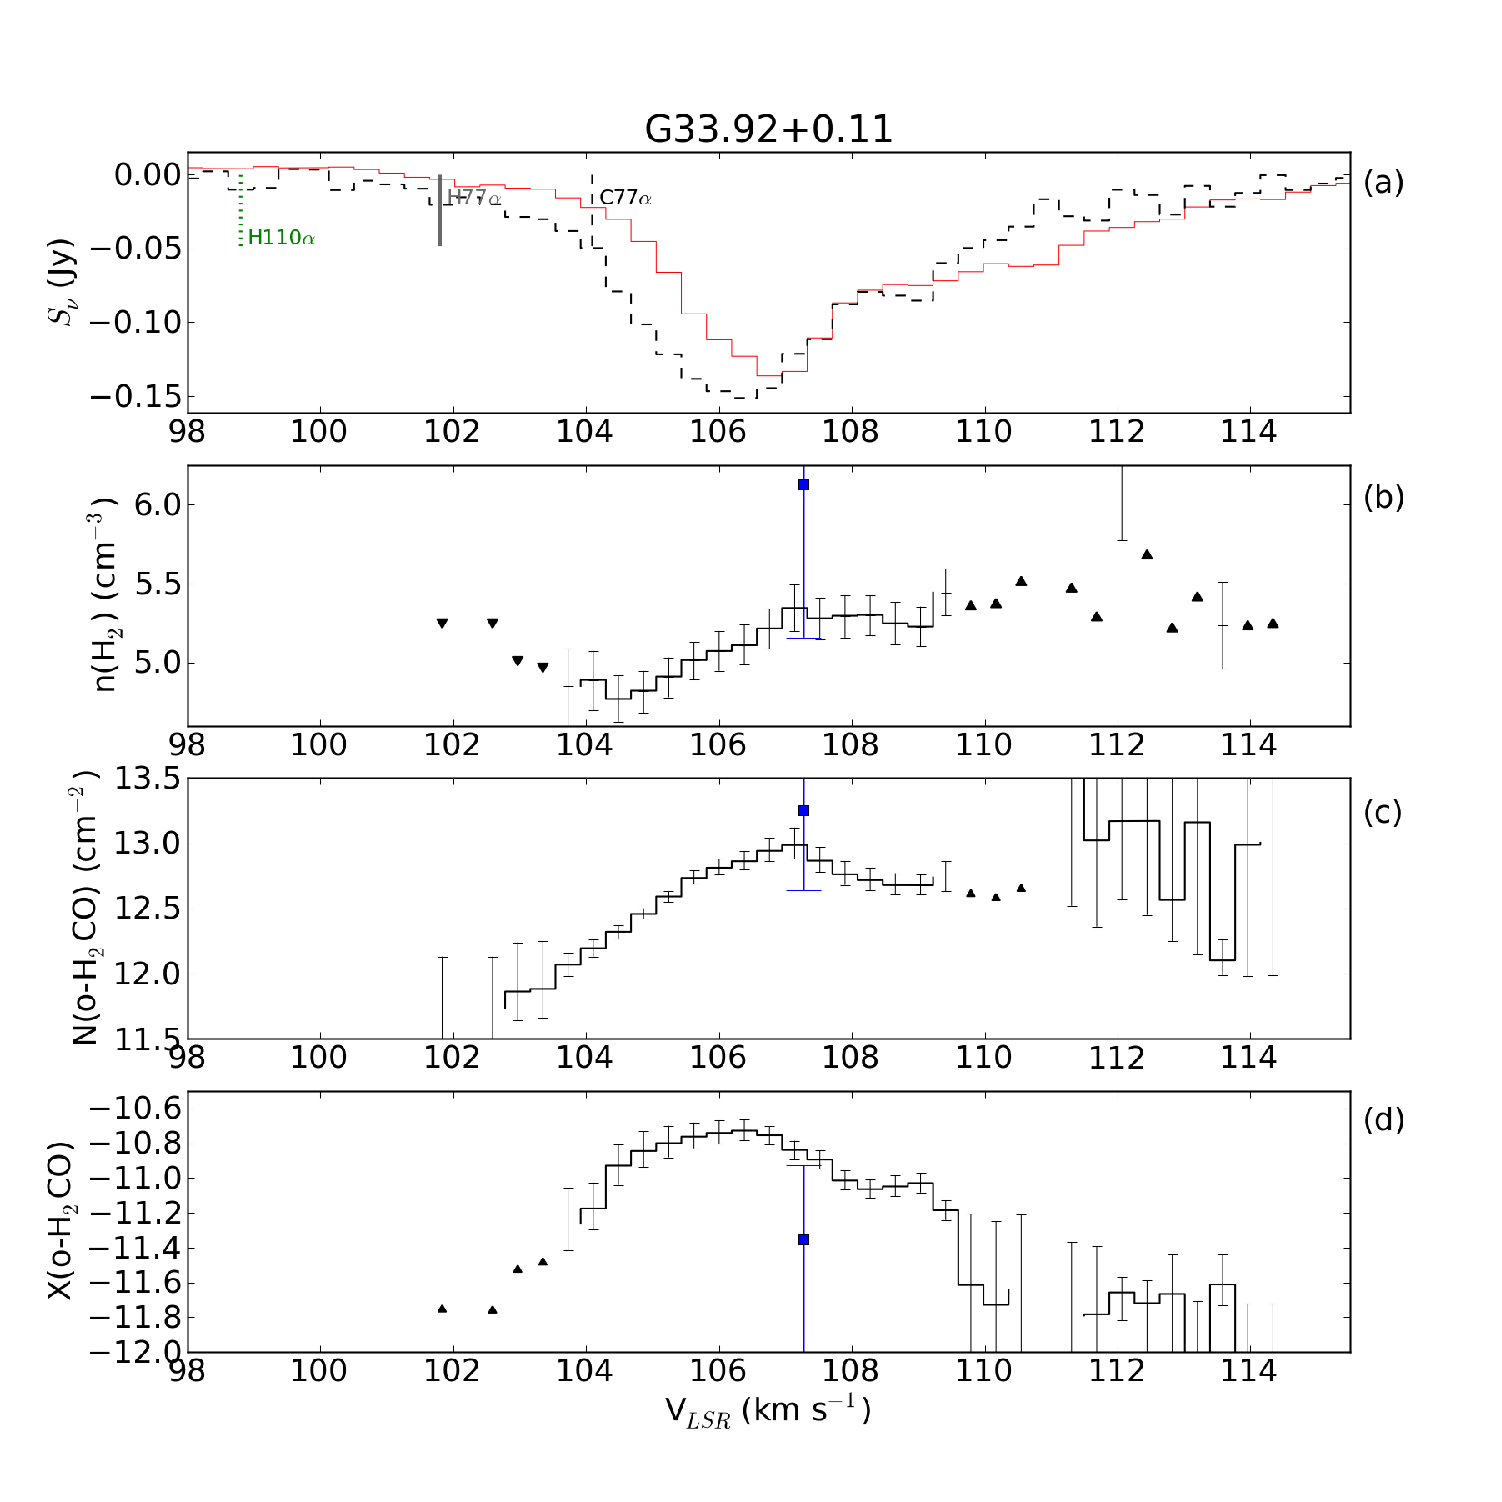
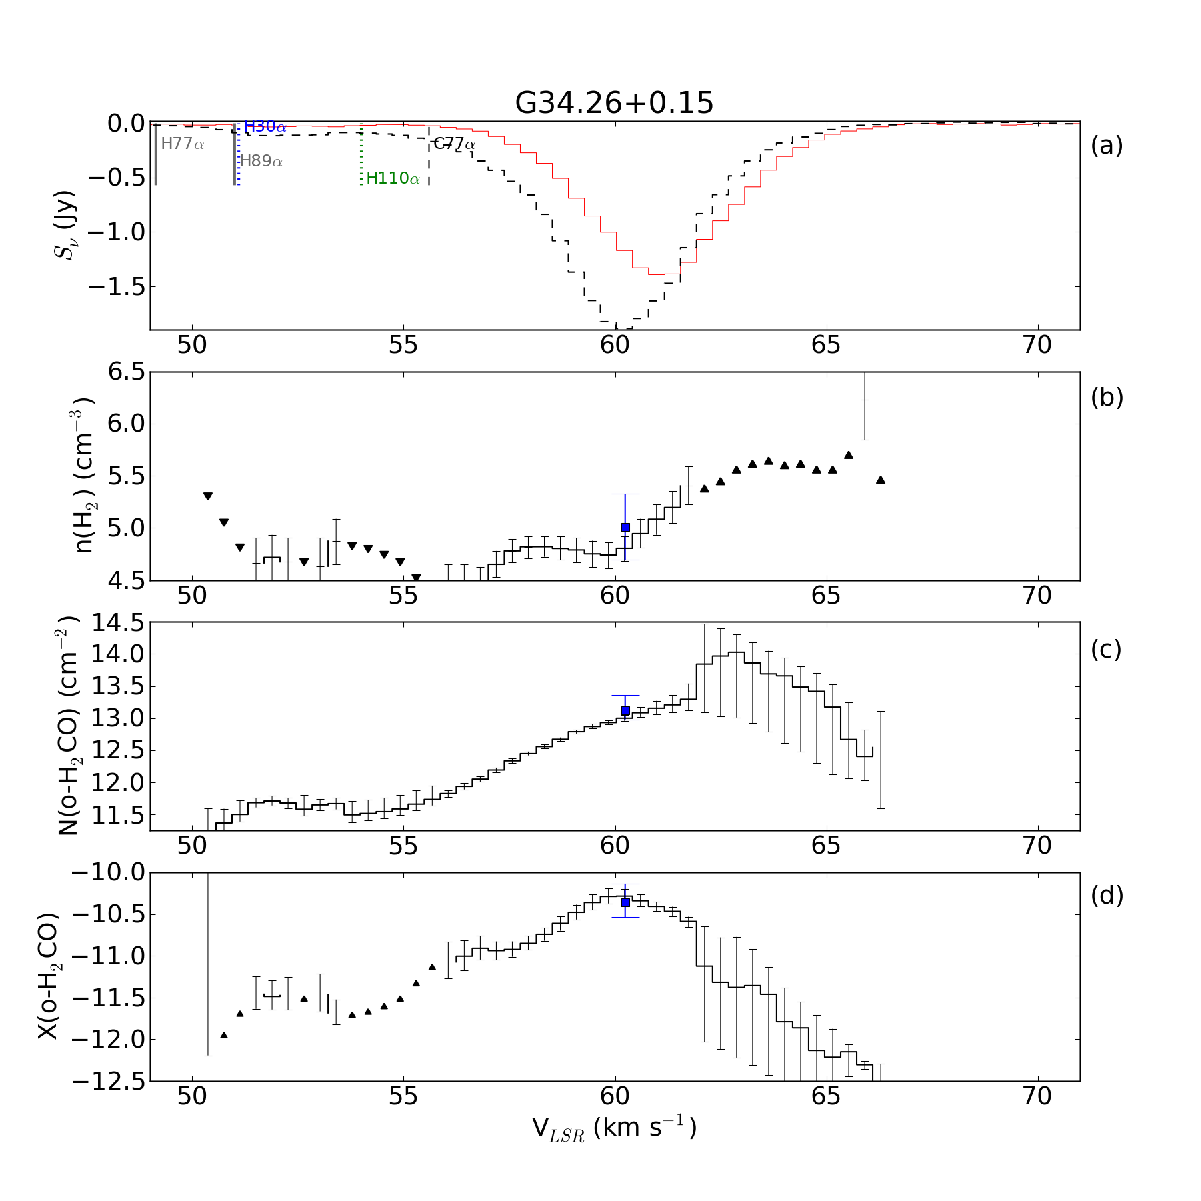
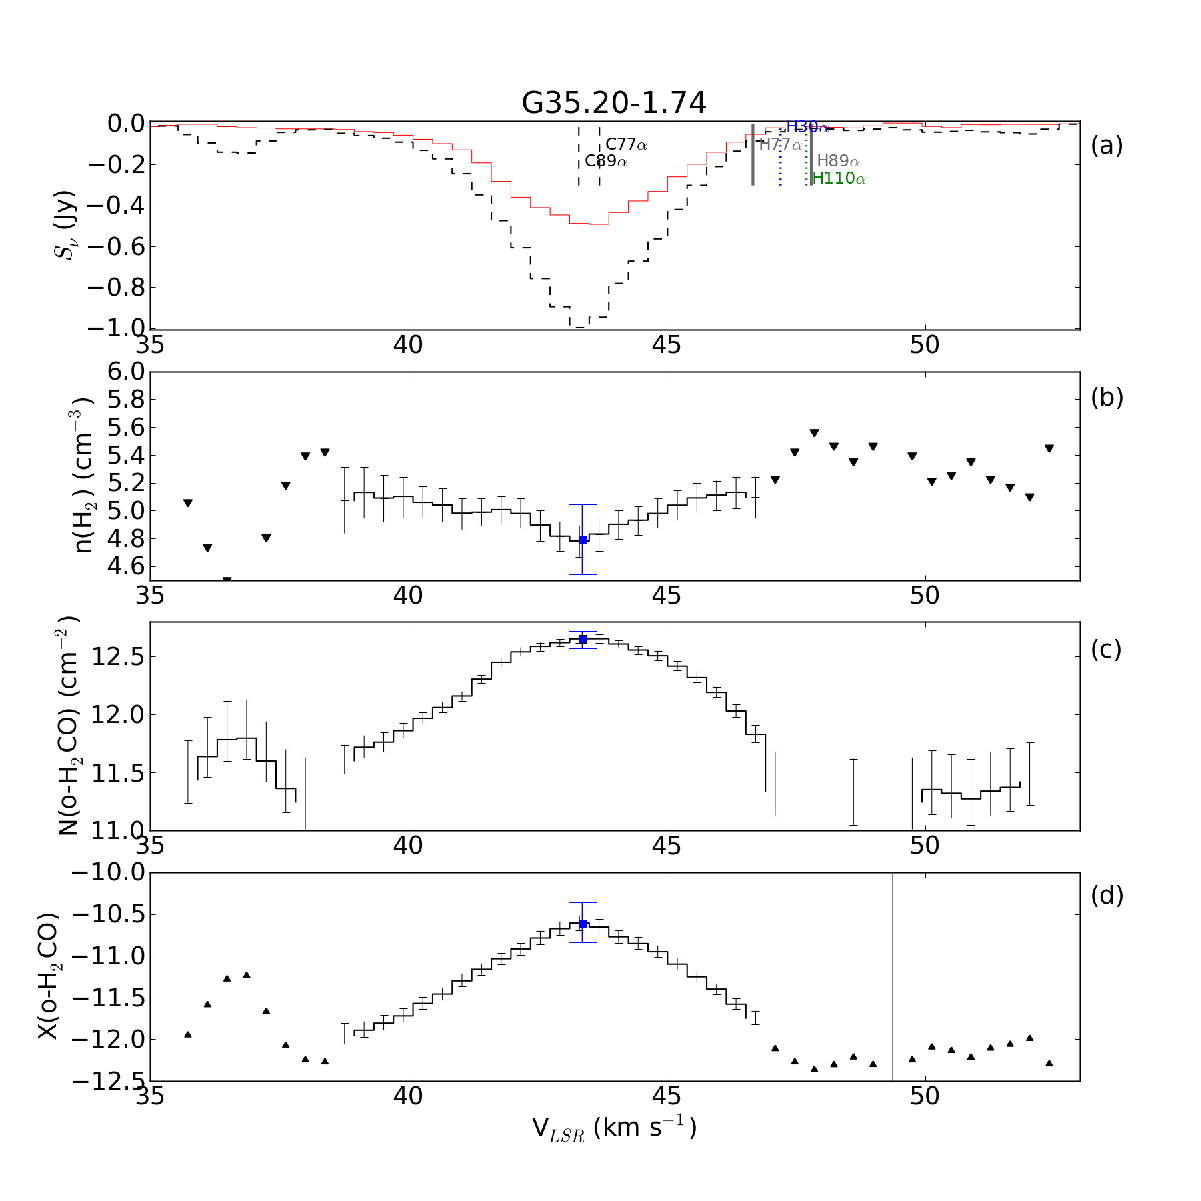
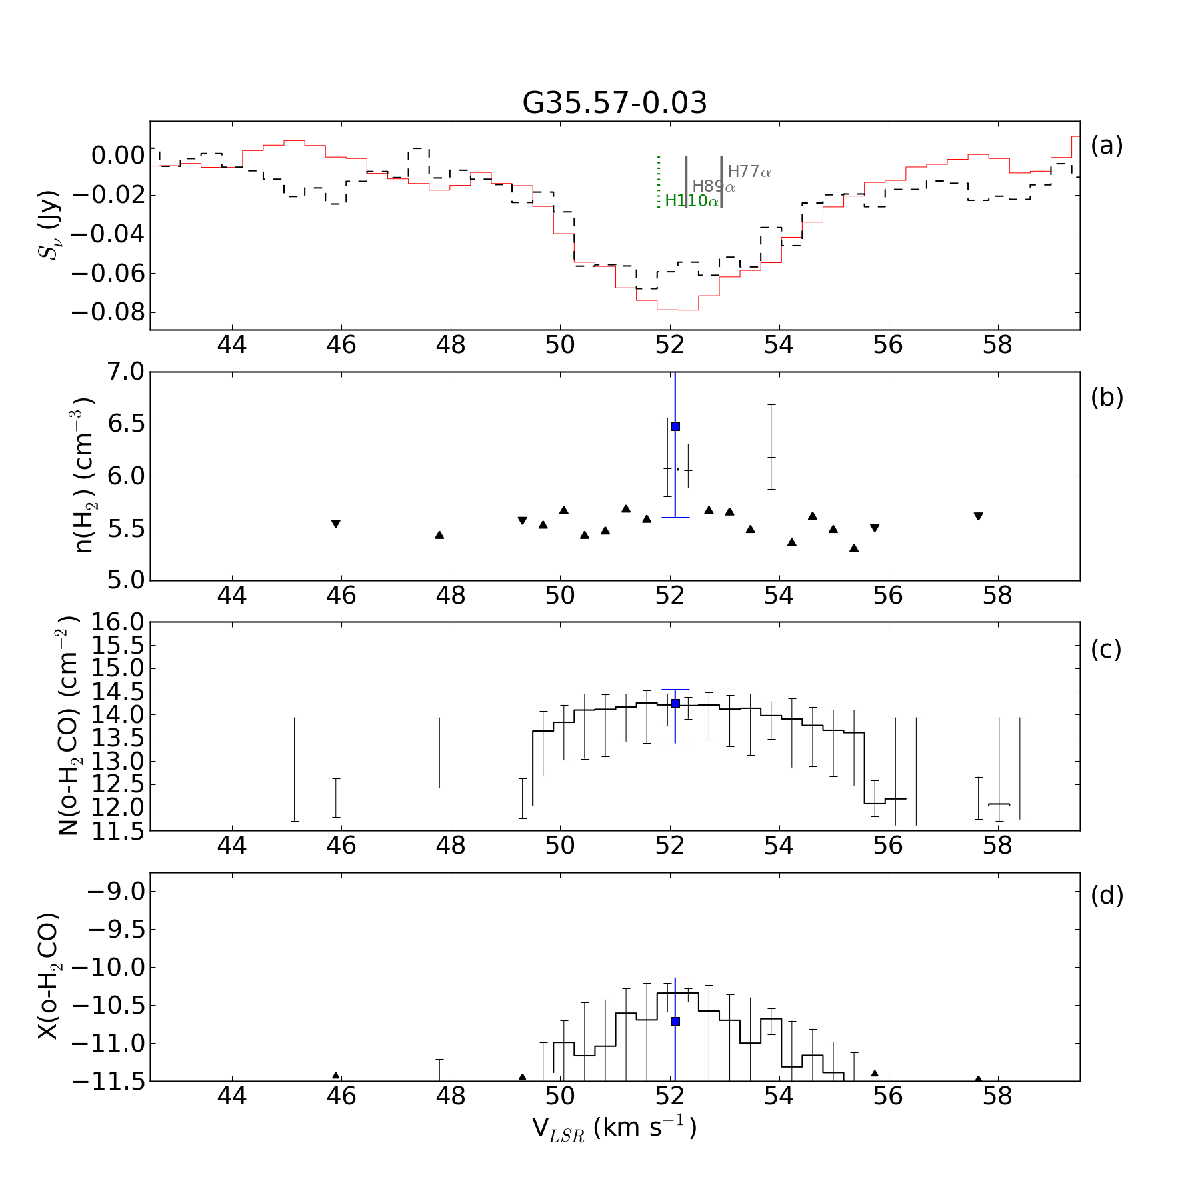
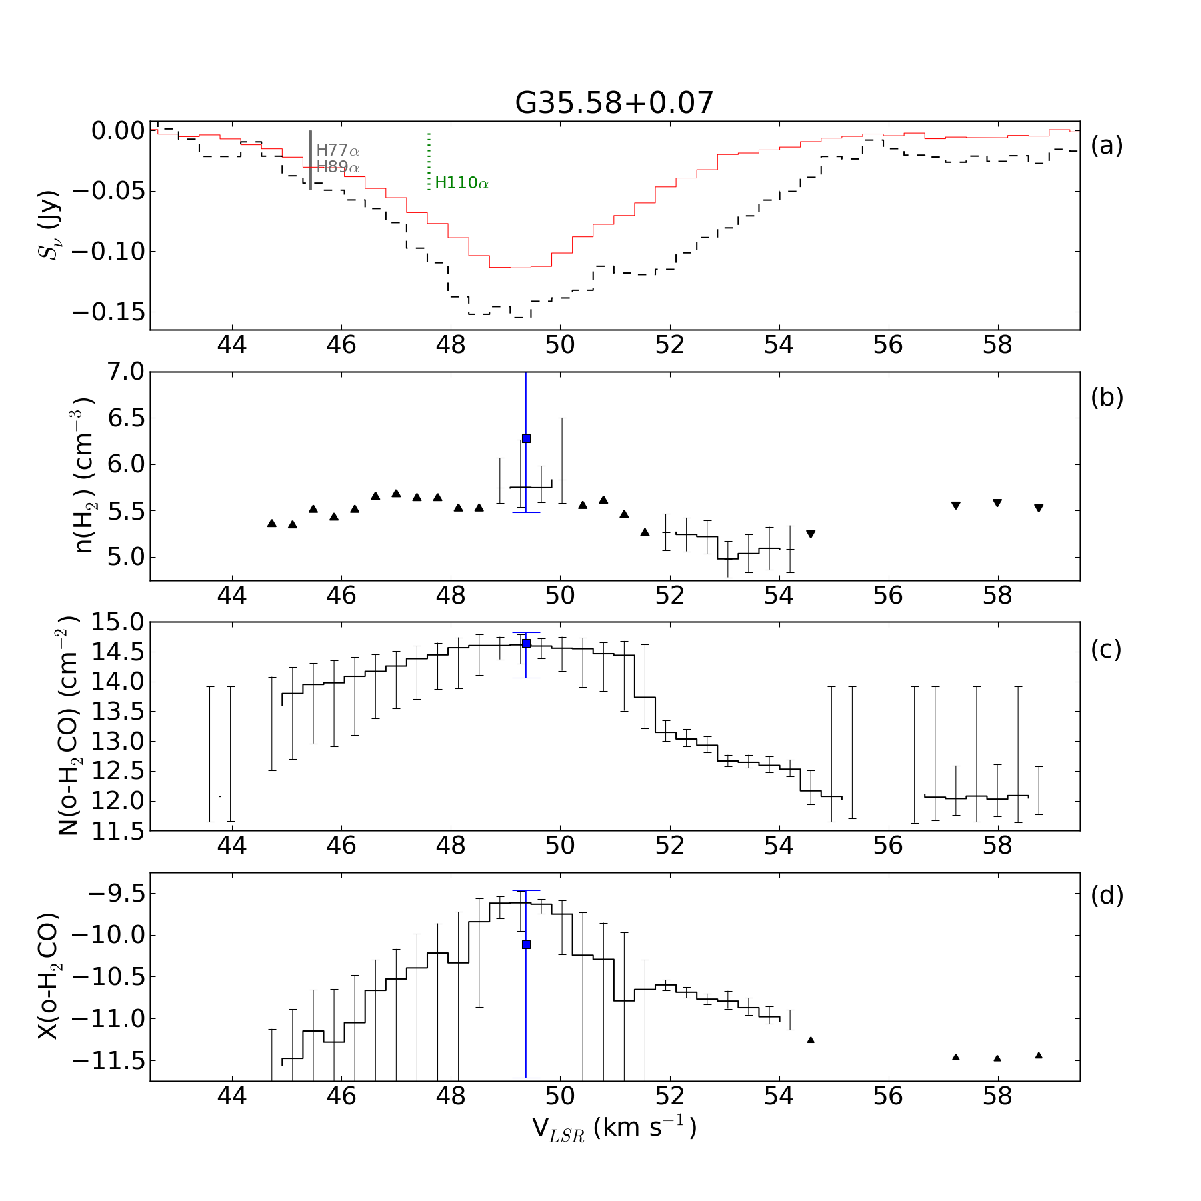
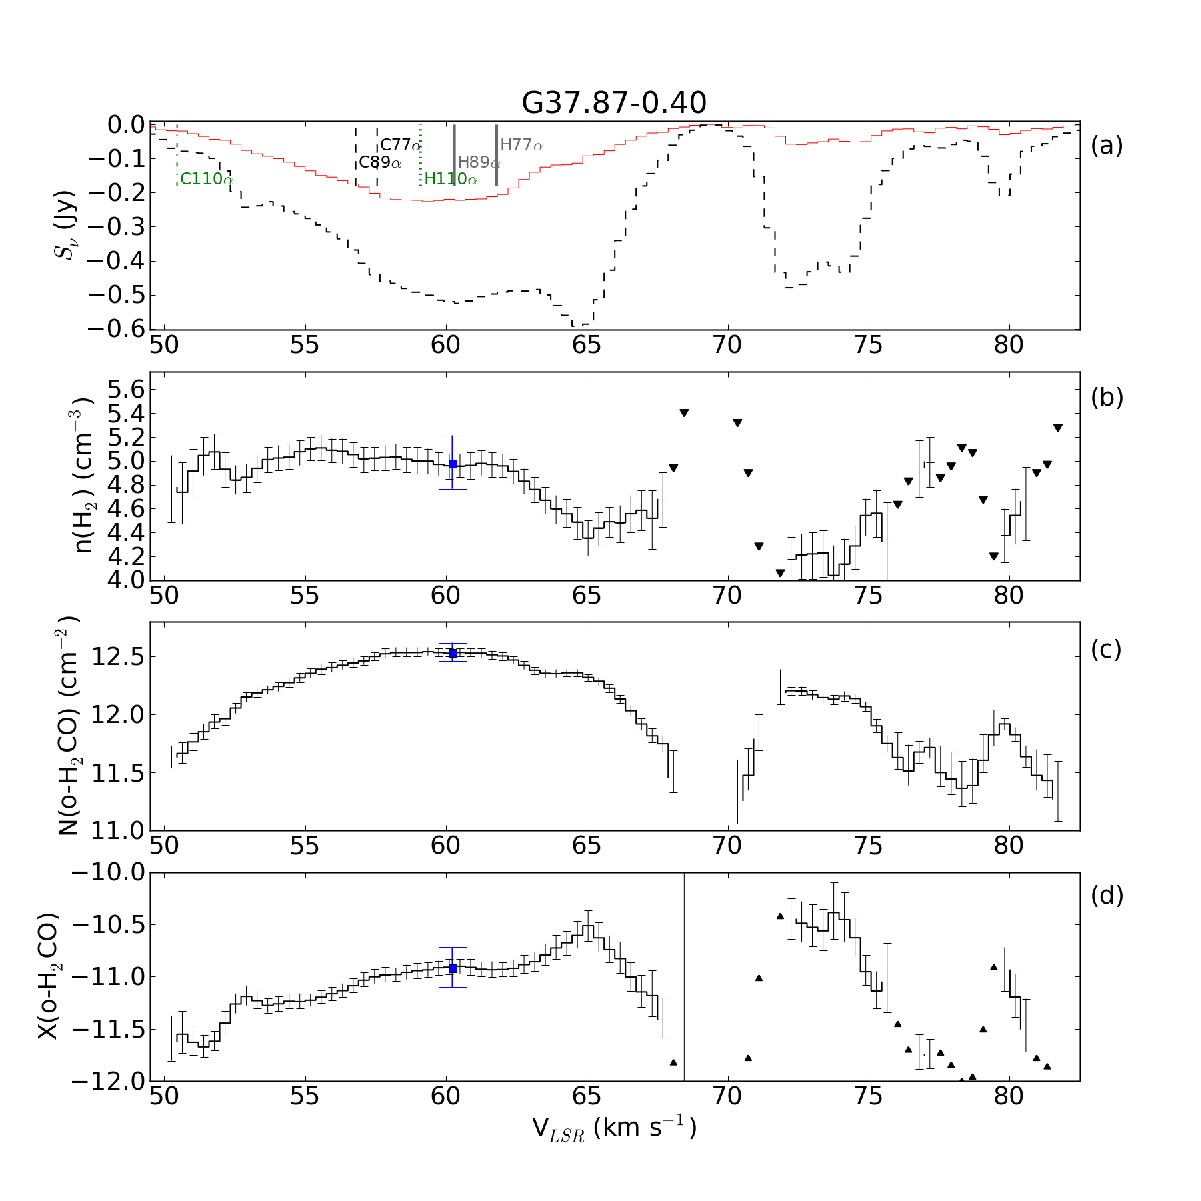
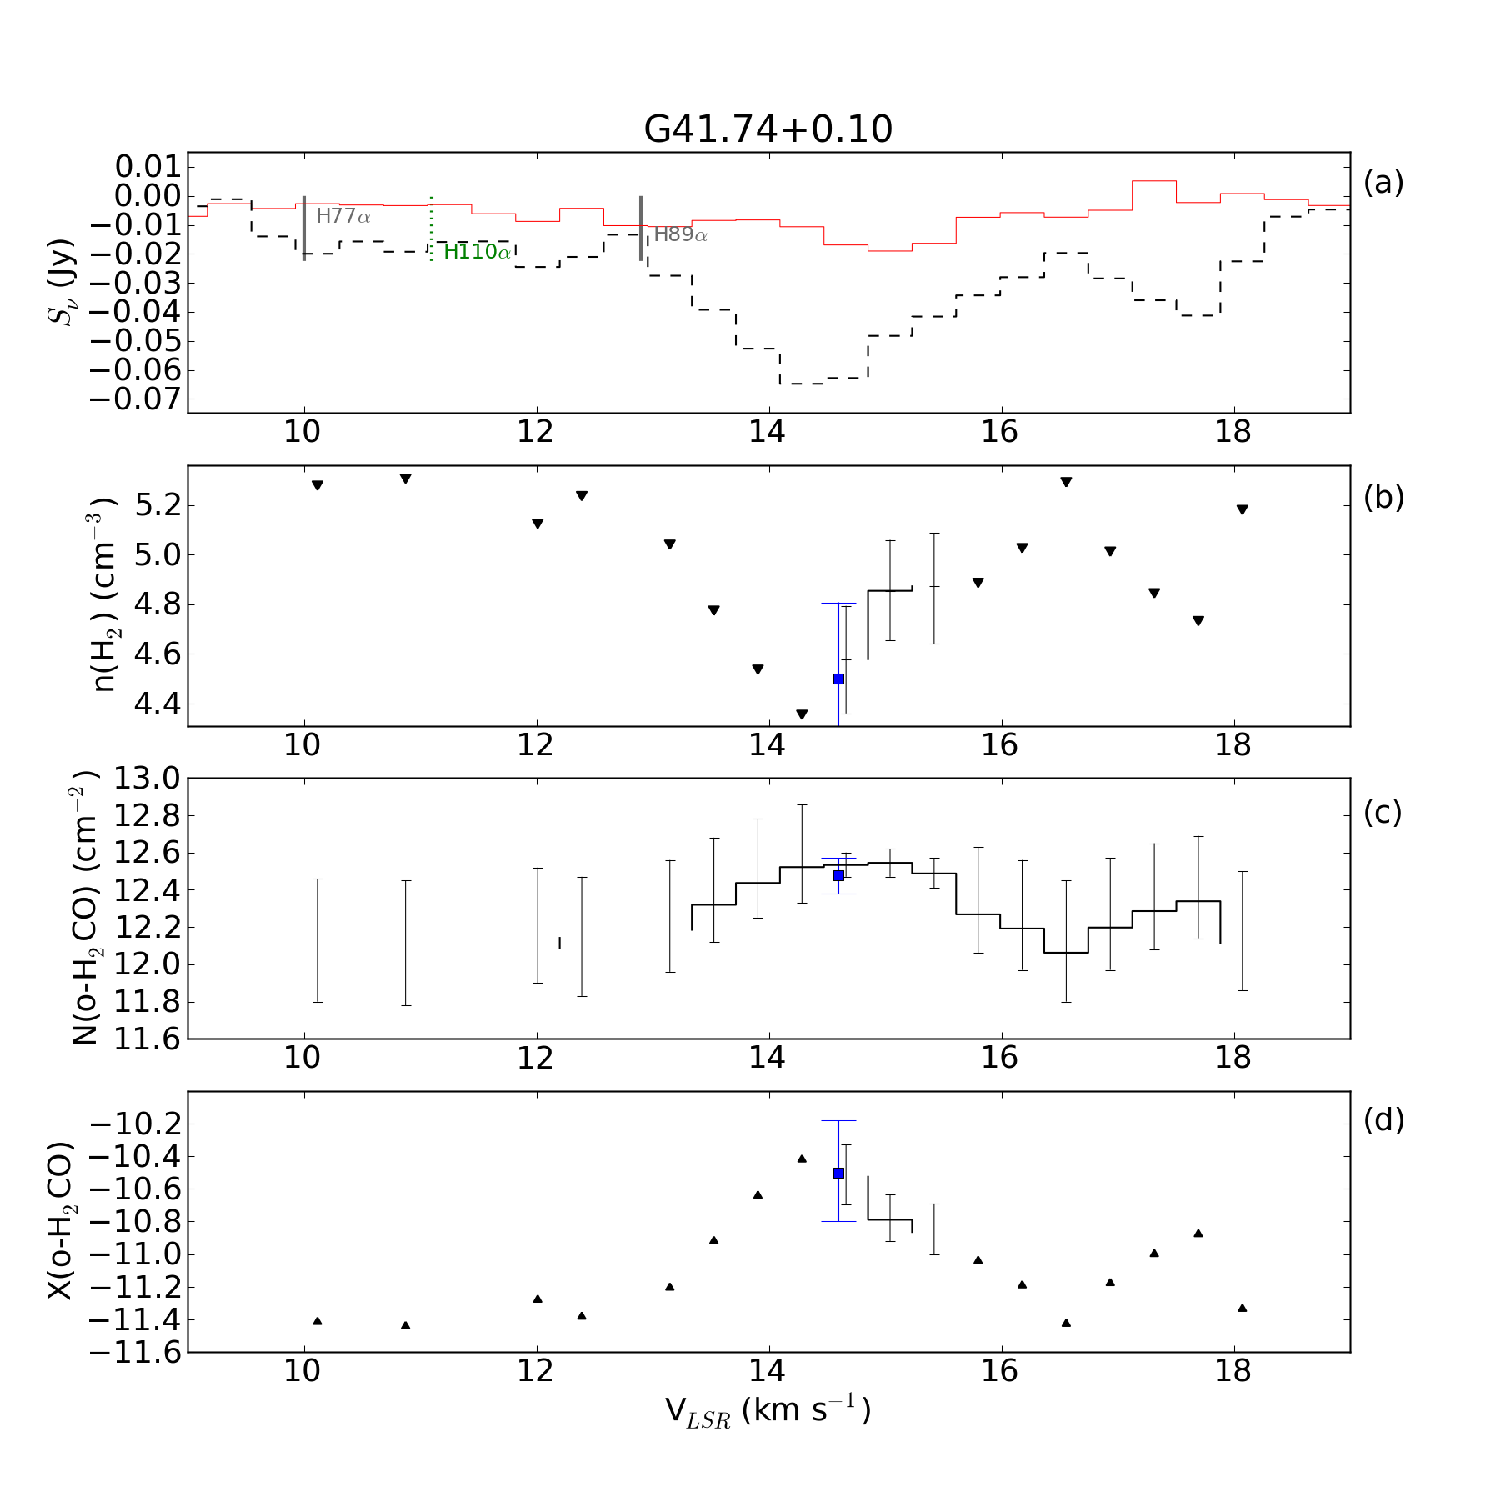
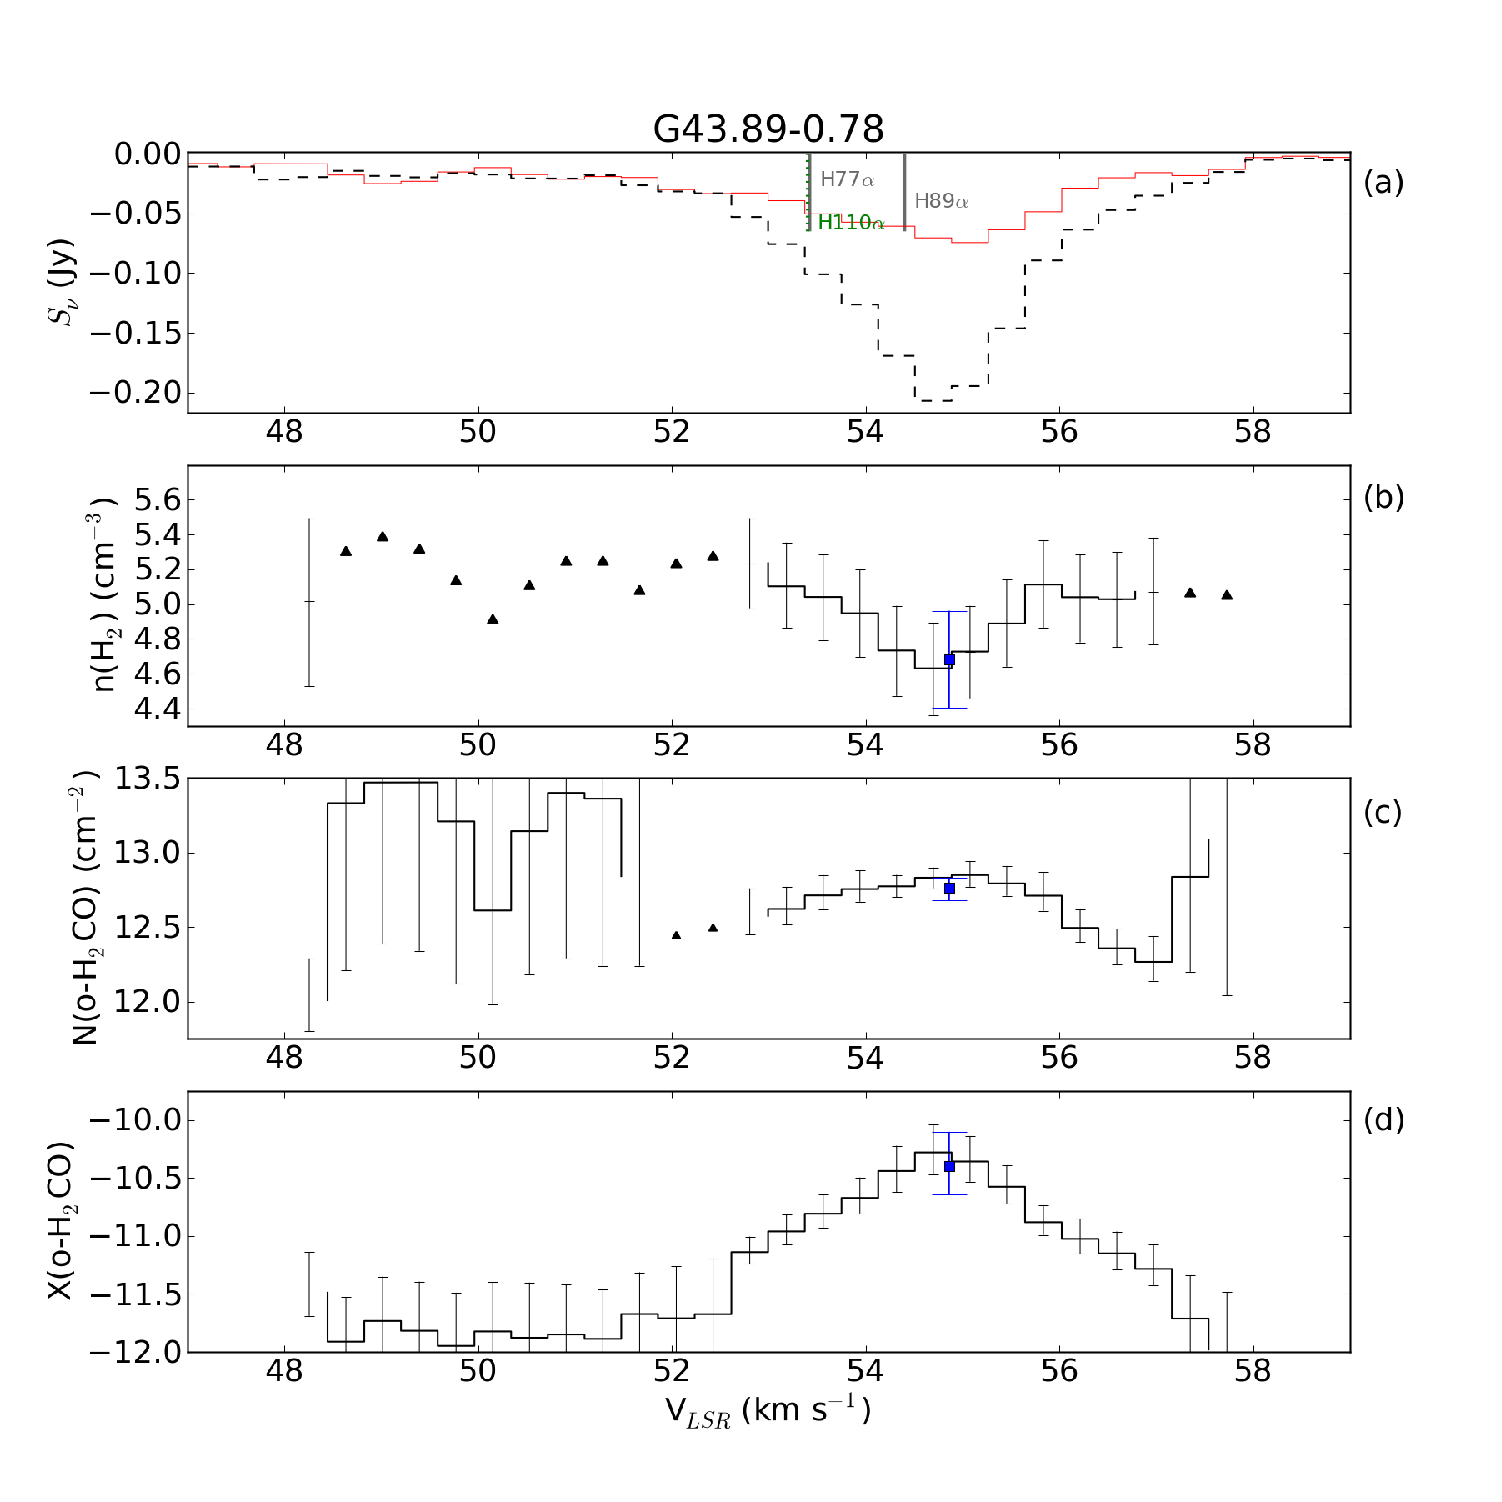
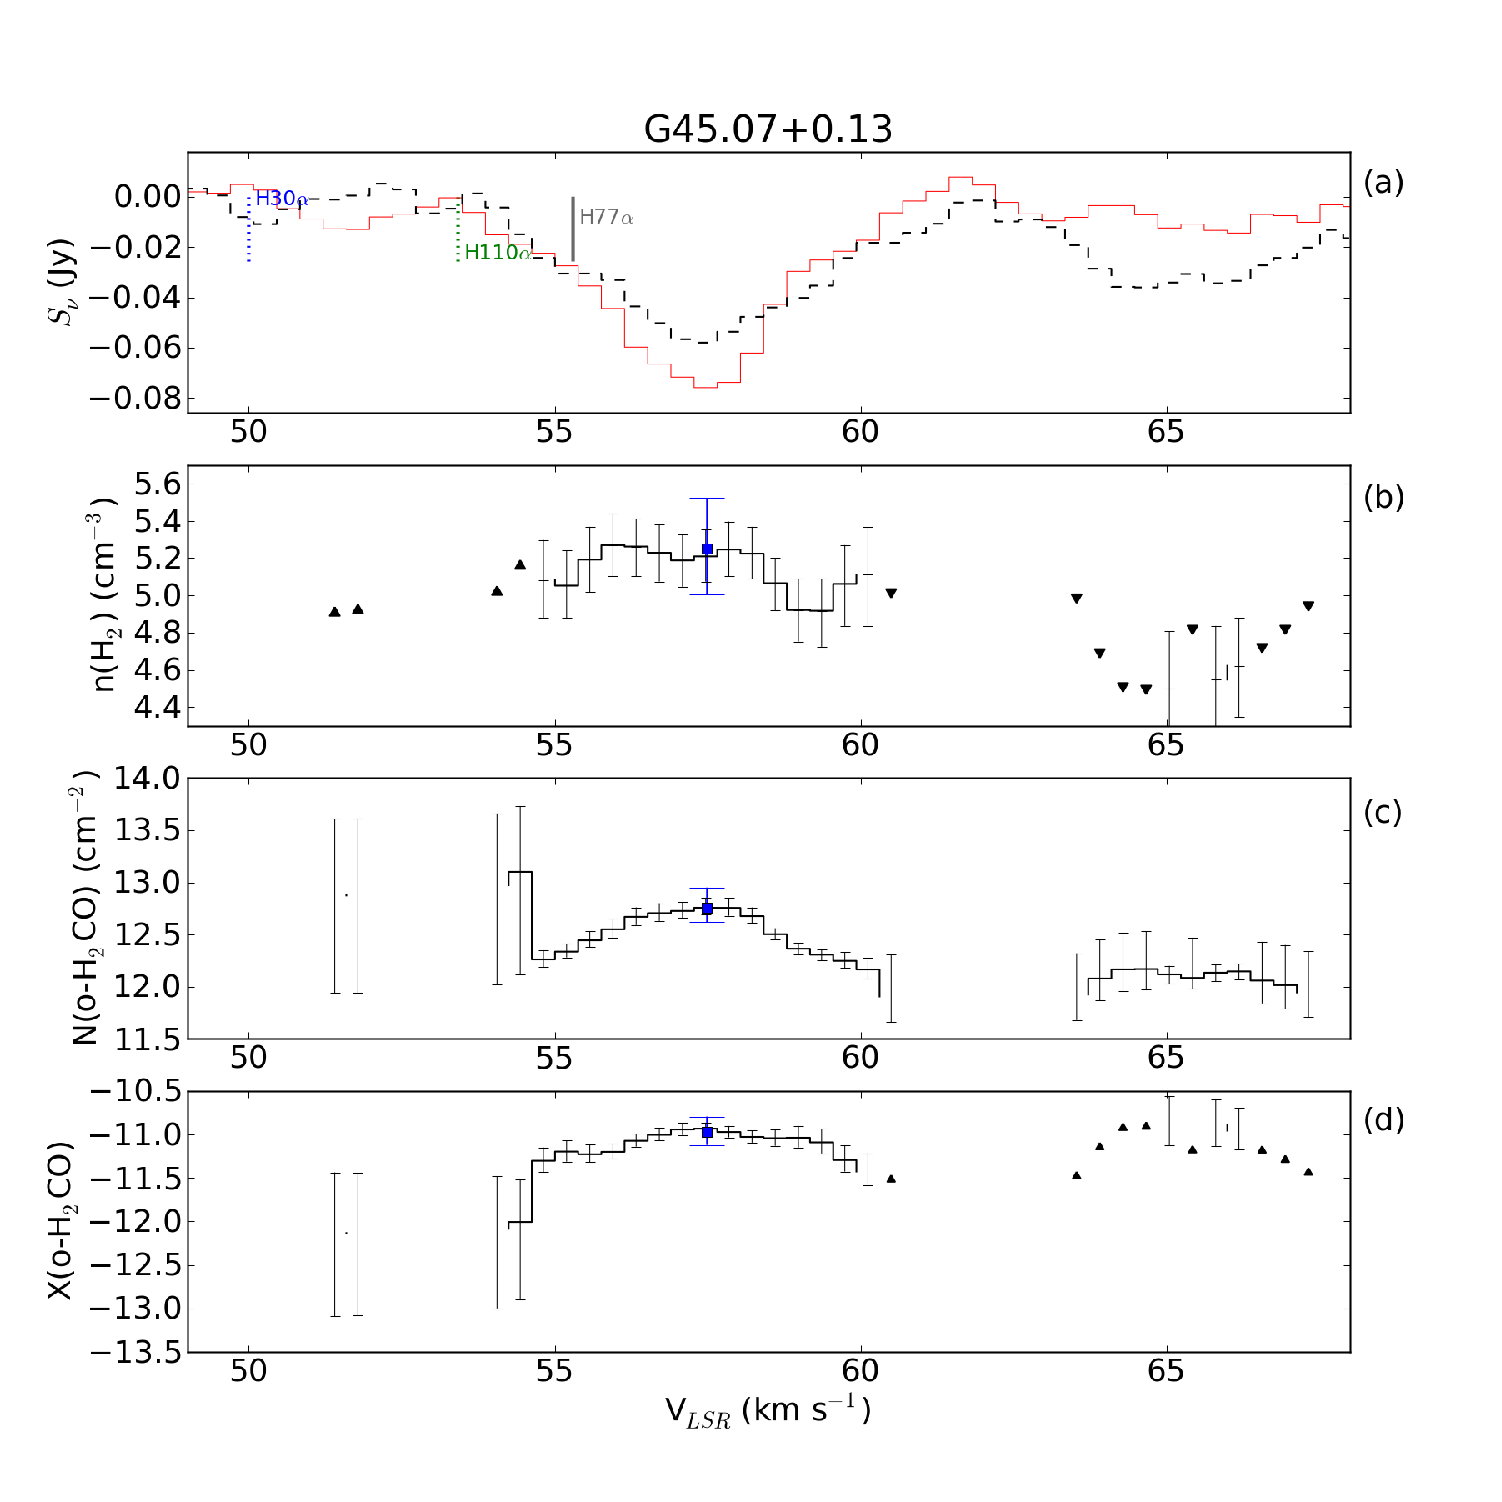
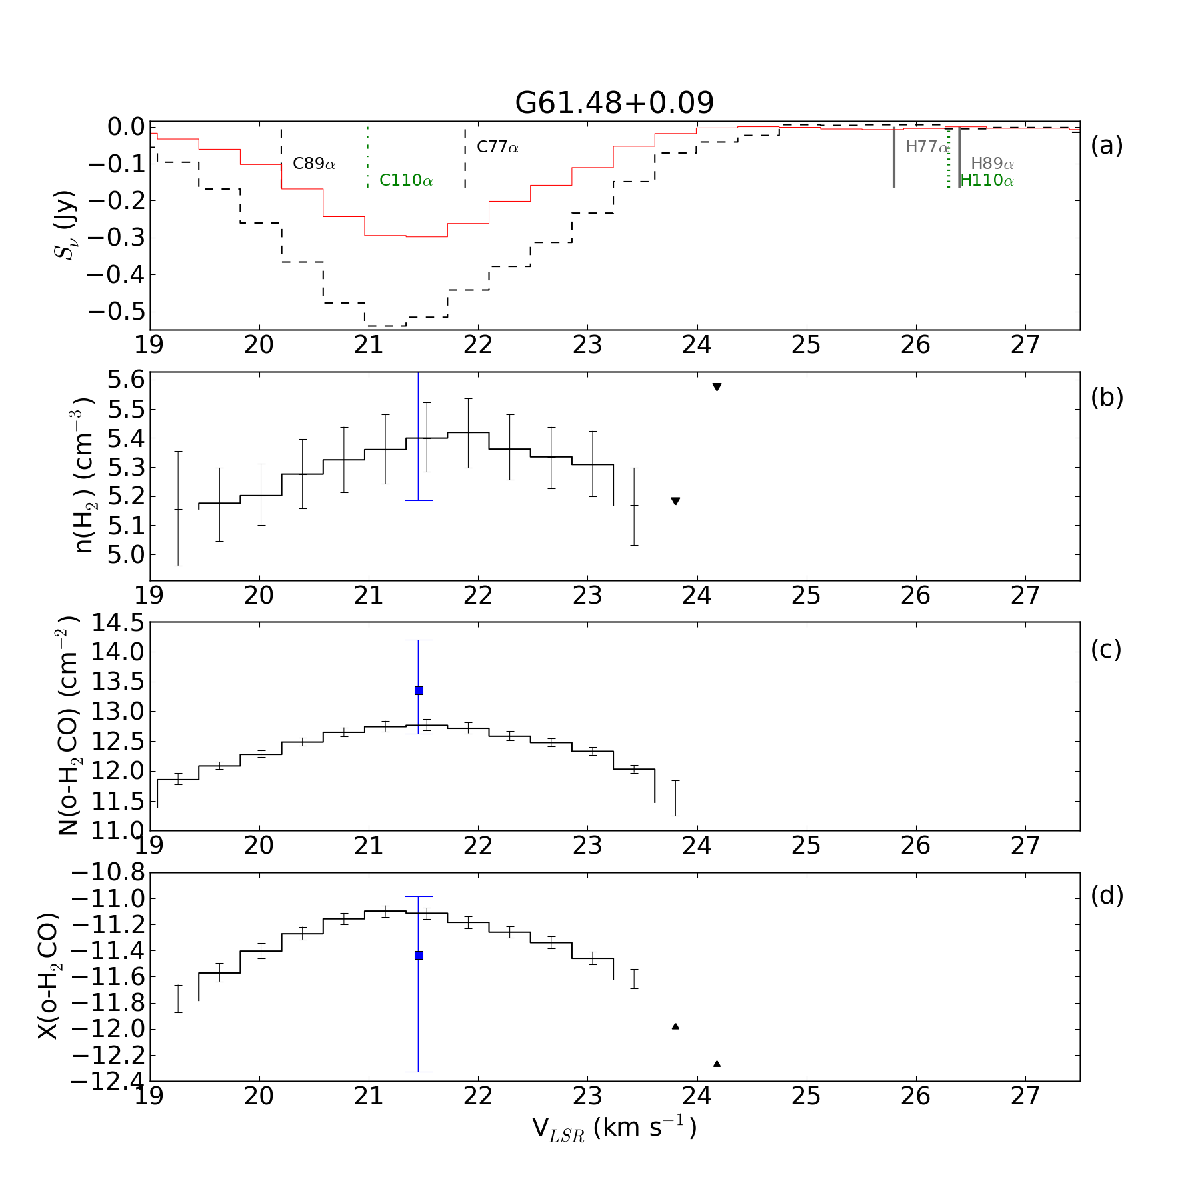
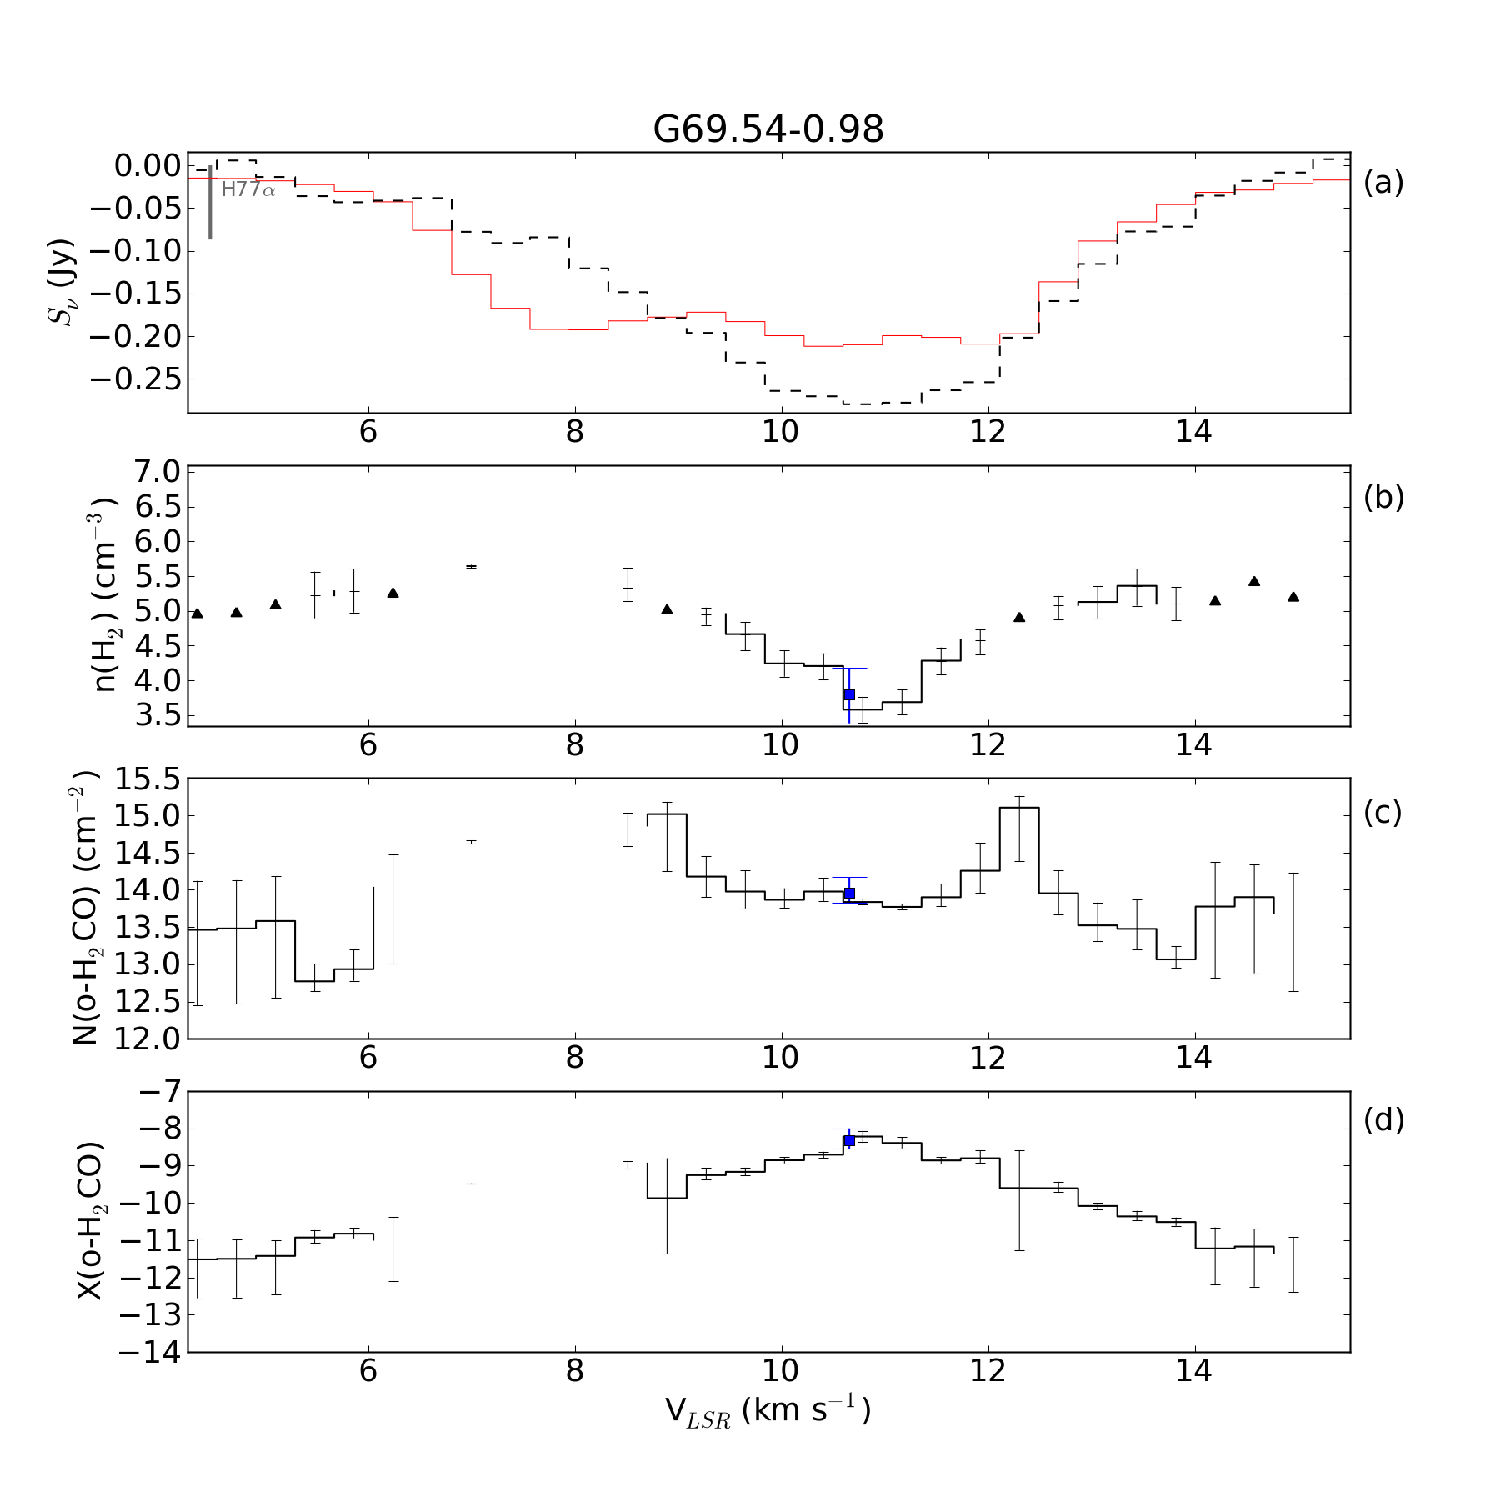
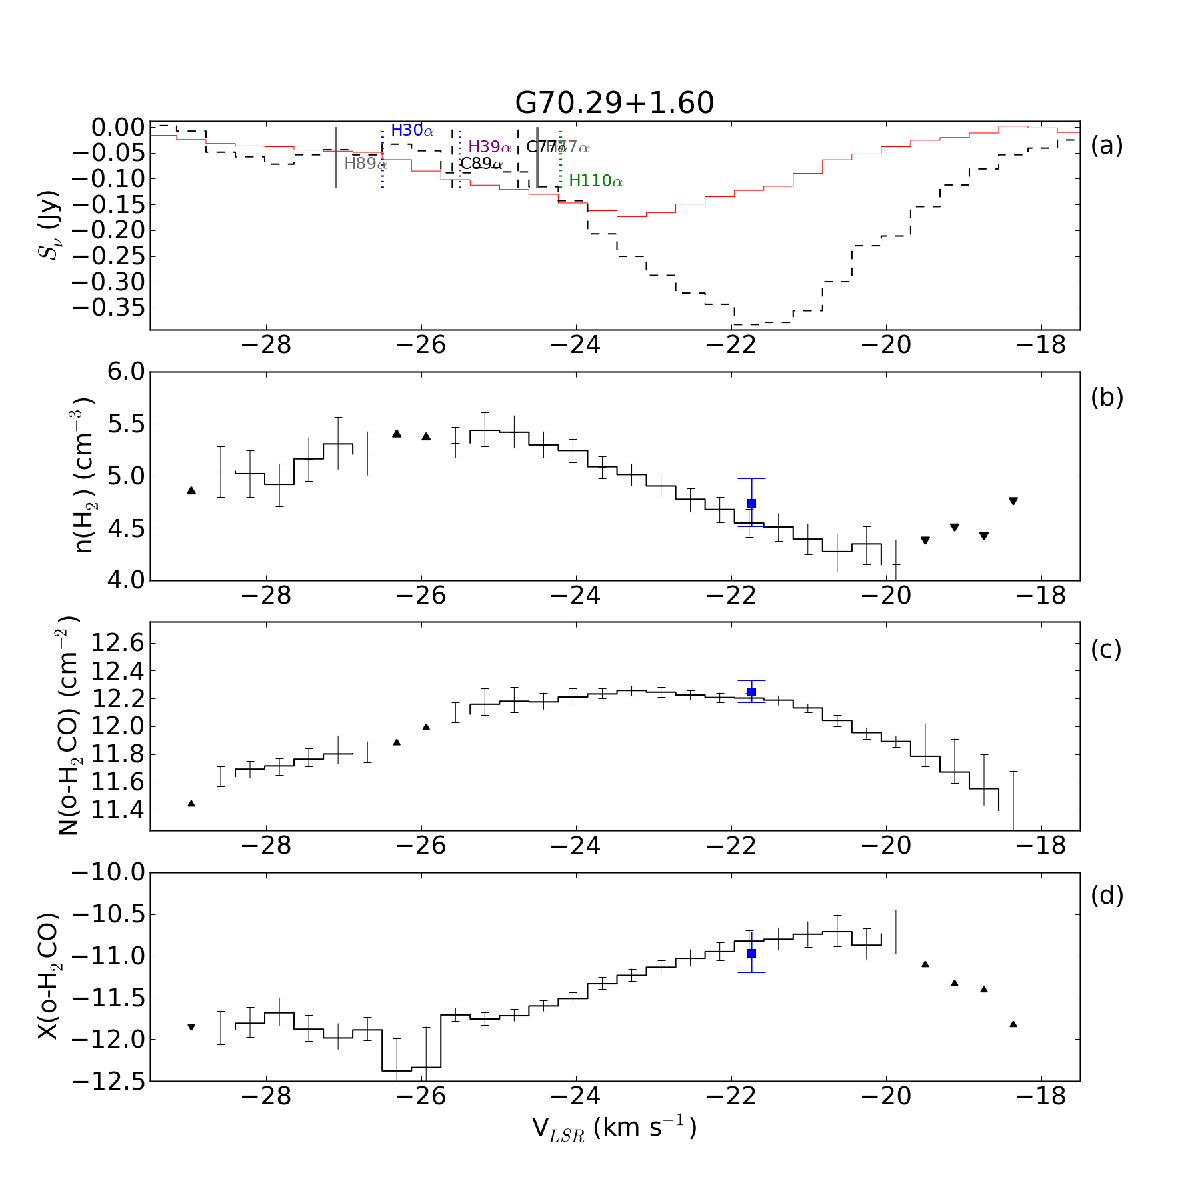
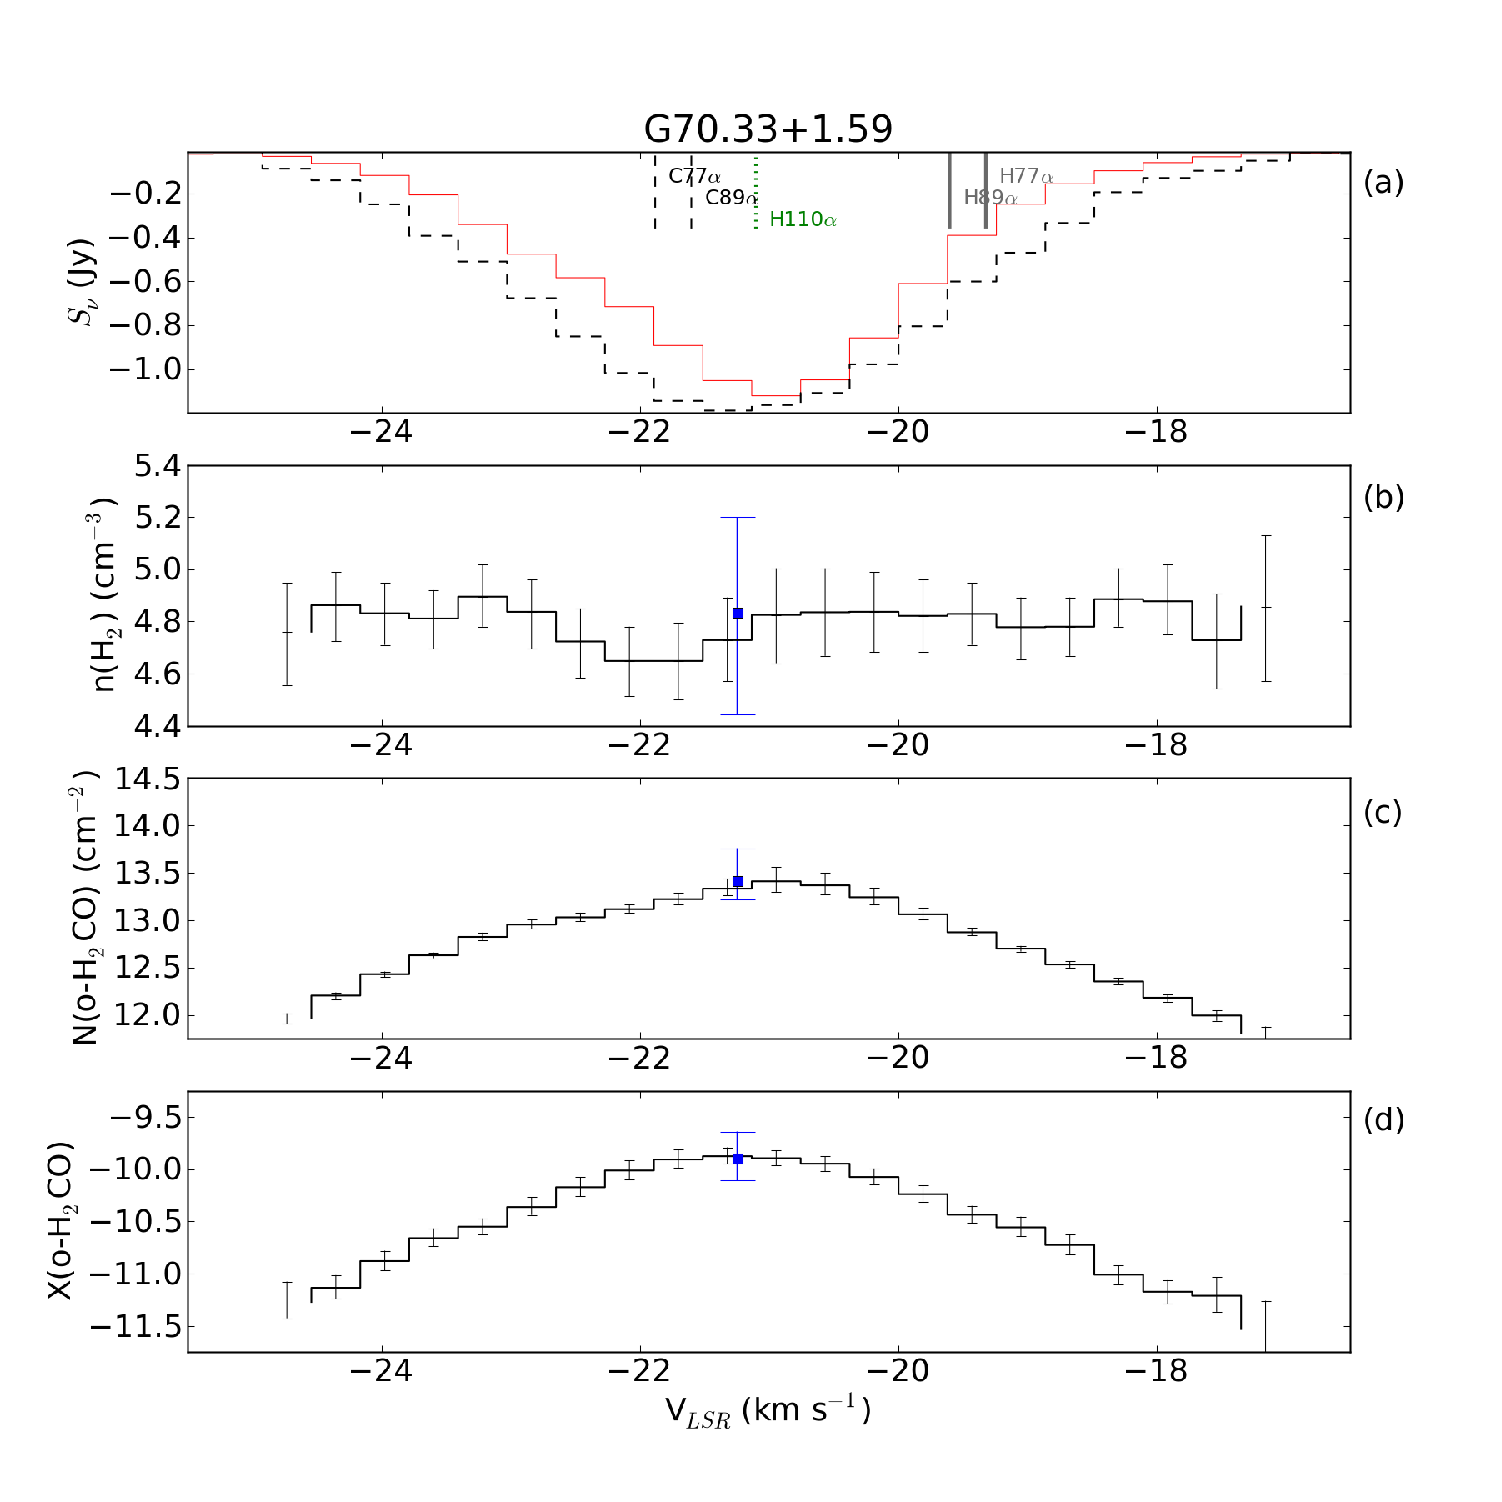
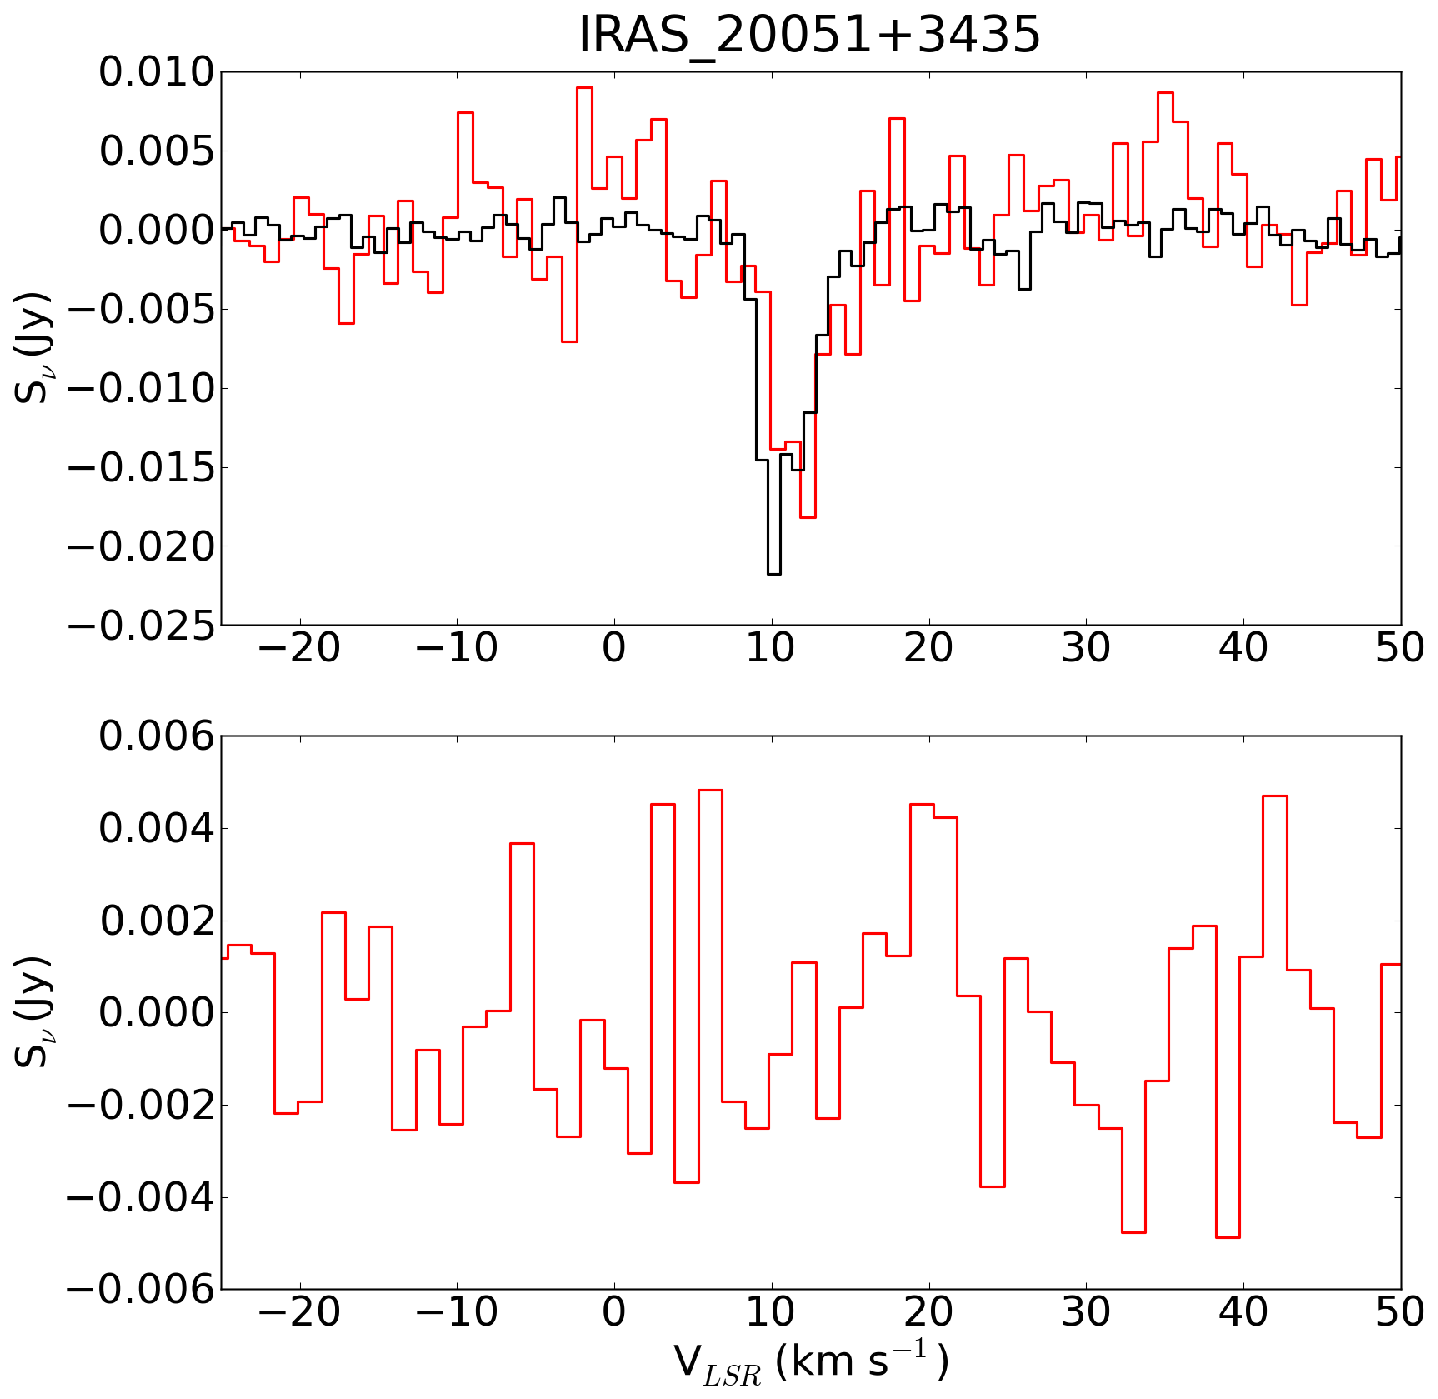
We compare the central velocities of the H and C lines to the velocities of the absorption lines on a case-by-case basis in Figures 23-40. The spectral line profiles are used to fit the observations into the models discussed in detail in Sections 6.2 and 6.3.
| H | He | C | |||||||
|---|---|---|---|---|---|---|---|---|---|
| Source | Peak | Center | FWHM | Peak | Center | FWHM | Peak | Center | FWHM |
| Name | H76aaSome H lines were fit with two gaussian components, in which case the second fit component is on the second line below. Errors (1) are indicated by the numbers in parentheses on the line below the measurement. | H76 | H76 | He76 | He76 | He76 | C76 | C76 | C76 |
| (Jy) | (km s-1) | (km s-1) | (Jy) | (km s-1) | (km s-1) | (Jy) | (km s-1) | (km s-1) | |
| G32.80+0.19 | 0.622 | 15.69 | 12.09 | 0.066 | 16.49 | 9.25 | 0.015 | 15.40 | 8.27 |
| (0.001) | (0.03) | (0.03) | (0.002) | (0.36) | (0.38) | (0.002) | (1.45) | (1.64) | |
| G33.13-0.09 | 0.067 | 73.49 | 14.10 | - | - | - | - | - | - |
| (0.001) | (0.17) | (0.17) | |||||||
| G33.92+0.11 | 0.157 | 101.86 | 12.16 | 0.013 | 99.07 | 13.60 | - | - | - |
| (0.001) | (0.07) | (0.07) | (0.001) | (0.87) | (0.87) | ||||
| G34.26+0.15 | 0.367 | 54.68 | 10.43 | 0.034 | 51.98 | 6.54 | 0.026 | 59.54 | 5.66 |
| (0.004) | (0.06) | (0.09) | (0.002) | (0.46) | (0.49) | (0.002) | (0.55) | (0.56) | |
| 0.251 | 37.46 | 22.76 | - | - | - | - | - | - | |
| (0.003) | (0.29) | (0.12) | |||||||
| G35.20-1.74 | 1.016 | 47.94 | 10.70 | 0.105 | 48.26 | 8.27 | 0.045 | 44.18 | 4.05 |
| (0.002) | (0.02) | (0.02) | (0.002) | (0.21) | (0.21) | (0.003) | (0.33) | (0.33) | |
| G35.57-0.03 | 0.036 | 52.38 | 13.71 | - | - | - | - | - | - |
| (0.001) | (0.41) | (0.41) | |||||||
| G35.58+0.07 | 0.044 | 46.68 | 10.55 | 0.007 | 43.15 | 6.30 | - | - | - |
| (0.001) | (0.20) | (0.20) | (0.001) | (0.94) | (0.94) | ||||
| G37.87-0.40 | 0.446 | 59.99 | 15.47 | 0.042 | 60.16 | 11.88 | 0.018 | 59.27 | 7.93 |
| (0.001) | (0.08) | (0.07) | (0.001) | (0.55) | (0.55) | (0.001) | (0.98) | (0.89) | |
| 0.049 | 26.21 | 10.49 | - | - | - | - | - | - | |
| (0.002) | (0.52) | (0.42) | |||||||
| G41.74+0.10 | 0.038 | 11.46 | 13.89 | - | - | - | - | - | - |
| (0.001) | (0.29) | (0.29) | |||||||
| G43.89-0.78 | 0.103 | 54.98 | 10.83 | 0.010 | 54.18 | 7.72 | 0.007 | 54.08 | 0.82 |
| (0.001) | (0.08) | (0.08) | (0.001) | (0.68) | (0.68) | (0.002) | (0.34) | (0.30) | |
| G45.07+0.13 | 0.041 | 58.22 | 10.05 | - | - | - | - | - | - |
| (0.004) | (0.41) | (0.64) | |||||||
| 0.043 | 41.57 | 20.01 | - | - | - | - | - | - | |
| (0.003) | (1.53) | (0.59) | |||||||
| G45.12+0.13 | 0.461 | 58.70 | 17.42 | 0.039 | 59.85 | 10.70 | 0.023 | 59.58 | 12.37 |
| (0.002) | (0.08) | (0.08) | (0.005) | (2.50) | (1.62) | (0.003) | (4.92) | (3.76) | |
| G45.45+0.06 | 0.493 | 55.38 | 11.80 | 0.050 | 56.41 | 8.02 | 0.014 | 63.40 | 10.42 |
| (0.001) | (0.03) | (0.03) | (0.004) | (0.93) | (0.56) | (0.002) | (4.57) | (3.05) | |
| G45.47+0.05 | 0.040 | 64.01 | 14.51 | - | - | - | - | - | - |
| (0.001) | (0.41) | (0.41) | |||||||
| G48.61+0.02 | 0.076 | 16.77 | 10.53 | 0.007 | 16.33 | 7.73 | 0.006 | 19.08 | 4.71 |
| (0.001) | (0.14) | (0.14) | (0.001) | (1.30) | (1.39) | (0.001) | (1.26) | (1.29) | |
| G50.32+0.68 | 0.034 | 26.94 | 10.27 | - | - | - | - | - | - |
| (0.001) | (0.27) | (0.27) | |||||||
| G60.88-0.13 | 0.067 | 18.30 | 9.08 | - | - | - | 0.023 | 21.77 | 2.54 |
| (0.001) | (0.12) | (0.12) | (0.002) | (0.19) | (0.19) | ||||
| G69.54-0.98 | 0.017 | 3.69 | 16.24 | - | - | - | - | - | - |
| (0.001) | (0.64) | (0.64) | |||||||
| G70.33+1.59 | 0.343 | -19.18 | 12.59 | 0.032 | -20.14 | 10.12 | 0.025 | -21.67 | 3.28 |
| (0.001) | (0.05) | (0.05) | (0.001) | (0.44) | (0.46) | (0.002) | (0.33) | (0.33) | |
| G70.29+1.60 | 0.545 | -26.97 | 17.82 | 0.042 | -26.32 | 14.53 | 0.032 | -24.78 | 4.71 |
| (0.001) | (0.12) | (0.09) | (0.001) | (0.64) | (0.68) | (0.002) | (0.36) | (0.42) | |
| 0.066 | -64.41 | 13.12 | - | - | - | - | - | - | |
| (0.002) | (0.70) | (0.50) | |||||||
| G61.48+0.09 | 0.566 | 25.96 | 11.16 | 0.046 | 28.80 | 7.86 | 0.059 | 21.27 | 2.48 |
| (0.001) | (0.02) | (0.02) | (0.001) | (0.24) | (0.24) | (0.002) | (0.11) | (0.11) | |
5. Results
5.1. Derived Properties
The average properties of the spectral line components associated with the UCH II regions and the other spectral lines representing molecular clouds are shown in Table 8. The table includes the mean and median only of spectral lines with both and detections that yielded measurements of density; upper and lower limits are not included. The full results are presented in Table 5.
| UCH II | Other Lines (GMC) | ||||||
|---|---|---|---|---|---|---|---|
| Parameter | MedianaaSpectral line components associated with UCH II regions | Mean aaSpectral line components associated with UCH II regions | RMS aaSpectral line components associated with UCH II regions | Median bbOther spectral lines (associated with line-of-sight molecular clouds) | Mean bbOther spectral lines (associated with line-of-sight molecular clouds) | RMS bbOther spectral lines (associated with line-of-sight molecular clouds) | KS PTE |
| log( Density) () | 4.95 | 4.91 | 0.27 | 4.49 | 4.61 | 0.32 | 0.022 |
| log( Column) () | 12.59 | 12.59 | 0.44 | 11.86 | 11.83 | 0.20 | 6 |
| -10.84 | -10.80 | 0.46 | -11.16 | -11.26 | 0.45 | 0.028 |
There is statistical evidence that the deepest spectral line components have higher column and/or abundance than the other (GMC) components (Table 8). It is unlikely that this difference could be caused by underestimates of the optical depths in the GMC components (type 2 and 4 errors, see Table 6) because the filling factor correction should tend to cancel out these errors. However, it is possible that, in those cases where the H II emission and the CMB emission in the beam are the same order of magnitude, type 1 errors have occurred: the H II region absorber is much larger than the H II region and a significant fraction of the spectral line depth comes from absorption against the CMB; this error should have little effect on the derived density (see Figure 6) but may lead to overestimates of the derived column density.
Each identified Gaussian component was associated with an UCH II region if it was within 5 km s-1 of the RRL peak, since RRLs are assumed to be generated in the UCH II regions. Any spectral lines blended with the UCH II lines were also associated with the UCH II region. Other velocity components, including those without corresponding RRL detections, were assumed to be from GMCs along the line of sight or part of the larger cloud not directly associated with the UCH II region; 29 components were associated with UCH II regions and 46 were associated with unrelated line-of-sight GMCs (Table 3).
The density difference between the two populations is significant by a Kolmogorov-Smirnov (KS) test with probability of being drawn from the same distribution (the ‘probability to exceed’ or PTE in Table 8). This result is in contradiction to the results of Wadiak et al. (1988), who found no significant density difference between “warm clouds” and “cold clouds” selected and observed in the same manner (though with larger beams). The difference is likely because the larger beam sizes in their study and a failure to include the continuum contribution of the CMB (which is more substantial in a larger beam, especially at 2 cm), resulting in a type 3 error and an underestimate of density for their “warm clouds” in particular.
The measured densities do not display any trend with heliocentric distance over the range 2-14 kpc, contrasing with mm-continuum surveys of star forming regions that tend to measure lower densities at greater distances (Reid et al. 2010). The lack of correlation in Figure 9 demonstrates the strength of the densitometry method: the properties of star-forming gas can be explored throughout the galaxy with distance bias largely removed. Similarly, no trend with Galactocentric distance was readily apparent.

Densities were measured within a range due to sensitivity cutoffs at low densities and thermalization of the spectral line ratio (ratio 1) at high densities (see Section 6.5 for a discussion of the limitations of the densitometer). On the high density end, a lower limit on the density remains interesting, as densities are close to those of low-mass protostellar cores and are a strong indication of runaway gravitational collapse, since such high densities are rarely observed in non-star-forming regions. On the low density end, it should be possible to detect the transition with sensitivity improvements , a consideration that will govern the allocated time-on-source for future observations.
5.2. Free-free Contribution to 1.1 mm Flux Density Measurements
It is expected that all young star-forming regions should be dust-rich and therefore bright at 1.1 mm. We therefore compare the BGPS 1.1 mm, GBT 2 cm, and Arecibo 6 cm continuum measurements for sources covered by the BGPS in Figure 10. For a flat-spectrum (, ; Wilson et al. 2009) free-free continuum source, the 2 cm flux density should be the 1.1 mm flux density. For an optically thick source, .
The objects targeted in our survey include 9 of the 13 brightest ( Jy) sources in the range , and 11 of 26 with Jy. We use flux density measurements from the 40″ apertures in the BGPS catalog because they are most appropriate for determining peak brightness of point-like sources (Rosolowsky et al. 2010). Out of the sample within the BGPS survey area, 6 of 15 sources have free-free fractions of at least 30%, but potentially much higher if the free-free emission is not optically thin. Since the sample was selected from well-known UCH II regions, these (rather incomplete) statistics are a warning that most of the brightest 1.1 mm emission sources in the BGPS are likely to be active UCH II regions and therefore may include a significant contribution from free-free emission to their measured flux densities (Figure 11). The same warning applies to other mm-wavelength galactic plane surveys, though the contamination should be less severe at shorter wavelengths.


In order to evaluate the impact of this conclusion on the BGPS, we examine the flux distribution of 6 cm continuum sources from the MAGPIS survey compared to the BPGS in the same area, and , which is the full range of the MAGPIS survey excluding the galactic center, where the BGPS catalog follows a different flux distribution (Bally et al. 2010).
In Figure 12, we plot histograms of the MAGPIS 6 cm flux density and the BGPS 40″ aperture flux density along with the best-fit power-law distribution line 121212The power law was fit using the python translation of the Clauset et al. (2009) power-law fitter provided at http://code.google.com/p/agpy/wiki/PowerLaw. The fitter computes the maximum likelihood value of the power-law and the cutoff of the distribution, below which a power law is no longer valid either because of incompleteness or a change in the underlying distribution.. Since the 6 cm power-law distribution is shallower than the 1.1 mm distribution, the 6 cm sources can dominate at high flux densities, although the power-law fit for the 6 cm sources significantly overpredicts the highest-flux bins and therefore the power-law is not an acceptable fit above Jy 131313We have tested the consistency of the two data sets with a low-cutoff power-law distribution by the Monte-Carlo process described in Clauset et al. (2009). The BGPS 40″ aperture flux densities are consistent with a power-law distribution at the level, while the MAGPIS 6 cm fluxes are inconsistent, with (where p measures the probability that the data are drawn from a low-cutoff power-law distribution) . The dashed line in Figure 12 shows the best-fit power-law distribution of the MAGPIS flux densities scaled down by 0.67, which is the expected decrement for an optically thin free-free source from 6 cm to 1.1 mm (spectral index ).
Figure 12b shows the ratio of the BGPS to the MAGPIS best-fit power-law distribution, indicating that the free-free contamination fraction is only large () at values much greater than the valid range of the 6 cm power law fit, which overpredicts the number of sources at Jy. However, if any of these sources are not optically thin at 6 cm, this fraction could be much larger. Additionally, these numbers only describe the sources in which all of the 1.1 mm flux is free-free emission; the implication remains that a large number of 1.1 mm sources have a substantial (if not dominant) free-free contribution.
Finally, we emphasize that unless a large fraction of 6 cm sources are optically thick in free-free continuum, the lower flux-density BGPS dust-continuum sample should be negligibly contaminated by free-free emission sources, but the brightest BGPS sources may have a significant free-free contribution.


5.3. Distances
We measure a kinematic distance to each source using the Reid et al. (2009) rotation curve. We resolved the Kinematic Distance Ambiguity (KDA) towards each line of sight using a variety of methods described below. The method in Sewilo et al. (2004) allows a resolution in favor of the far distance for UCH II regions with an intervening molecular absorption line at more positive velocities in the first Galactic quadrant. Associations with infrared dark clouds (IRDCs) can resolve the KDA in favor of the near distance. We compare our KDA resolutions to Anderson et al. (2009), with whom we agree on all common sources except for G33.13-0.09, which we place at the far distance based on the Sewilo et al. (2004) method. The derived distances are listed in Table 3.
5.3.1 Size Estimates
We estimate the source size using two methods. First, we use the VLA measurements of UCH II region sizes. As stated in Section 4.1, the VLA size measurements are very uncertain and are simplifications of an evidently complicated geometry. We estimate a spherical radius . Second, we assume the gas traced by and the BGPS 1.1 mm images are the same and get a ‘size scale’ where is derived from the line ratio.
The sizes derived from the two methods are plotted against each other in Figure 13. The sizes estimated from the two different methods are not well correlated and disagree by around an order of magnitude in most sources. The disagreement could be because of poor VLA-based size estimates, substantial 1.1 mm emission from low-density gas, or incorrect dust temperature or opacity estimates. While additional line-of-sight GMCs could in principle contribute to the size estimate, the disagreement for sources even without associated GMCs prevents this hypothesis from fully explaining the disagreement. Therefore, any quantities derived from the size - i.e. mass, which depends on - are even less constrained. We therefore do not derive any quantities dependent on the intrinsic source size.

6. Discussion
6.1. Comparison to extragalactic observations
We compare our measured column and volume densities to a selection of starburst galaxies from Mangum et al. (2008) in Figure 14. All of the extragalactic observations have much lower column densities per km s-1 than we measure in the main lines of most UCH II regions, but similar volume densities. This discrepancy can be easily explained by a difference in the area filling factor of molecular clouds in observations of galaxies and UCH II regions. In a galaxy, the total area filling factor of molecular clouds per km s-1 (which is similar but not identical to the volume filling factor) is likely to be , even in extreme starbursts; although the galaxy may appear to be uniformly filled with molecular gas in projection, at any given velocity it is likely to have significant gaps of ionized or neutral atomic gas. In contrast, an UCH II region should be completely embedded in a molecular cloud that is much larger than the free-free emitting continuum region, so the covering factor of molecular gas should be .
It is therefore interesting to note that Arp 220, possibly the most extreme nearby example of a starburst galaxy, has nearly the same column per channel as the low end of the UCH II regions, suggesting that it is analagous to a scaled-up UCH II region to within a factor of a few; the measured density in Arp 220 is consistent with only the highest-density UCH II regions. M82, on the other hand, has a bright continuum background analagous to an UCH II region, but a correspondingly low filling factor, implying that it consists of many compact but bright sources with a total filling factor 0.001-0.1. Alternatively, the density and column measurements are consistent with M82 being dominated by quiescent GMCs, but that is unlikely given the starburst nature of the galaxy.
The gravitational lens source B0218+357 is a different scenario. Its low density is consistent with that of a non-star-forming GMC, while its column per km s-1 is comparable to the Galactic sample. This source is therefore likely to be a sightline through a ‘normal’ quiescent molecular cloud in its host galaxy, similar to the narrow beam of an UCH II region through the Galactic disk. Zeiger & Darling (2010) note that there is a range of covering factors cited in the literature, which can affect the measured density and column, but should not affect the conclusion that the B0128+357 cloud’s density is not consistent with that of massive-star forming regions. The low-density gas is detected partly because the Zeiger & Darling (2010) data are 3.5 more sensitive than ours with a background continuum source of similar brightness.

6.2. Line Profiles
Despite the many systematics discussed above that can affect absorption measurements with a compact illumination source, it is possible to directly compare the properties of gas along a given line of sight without most of these hindering factors. Since most of our spectra have kinematically resolved spectral line profiles, it is possible to make many density measurements at different velocities towards each source. An example of this type of analysis is shown in Figure 15. An example demonstrating the need for this type of analysis is shown in Figure 16, in which two lines well-fit by gaussian profiles nonetheless display a density gradient because the line centers are significantly offset; the figure also demonstrates that the offset cannot be accounted for by any instrumental effects.
Of our sample, 18 of the 24 observed lines-of-sight had high enough signal-to-noise spectra (S/N in at least four adjacent 0.4 km s-1 channels in both lines) to measure the density in many velocity bins. Of these, 12 have different peak velocities in the and lines, indicating density gradients in the molecular gas with velocity. Figure 15b is an example density-velocity plot.
We have classified each high S/N spectrum as gradient, envelope, or single based on spectral line morphology. The gradient classification was used for gaussian or nearly gaussian lines in which the and line centers were offset, indicating a gradient in the density with velocity; the color listed in the table indicates the direction of increasing density. The envelope classification was used for flat profiles on the wings of deeper gaussian lines. The single classification was used for lines where the and velocities matched. Low S/N spectra were not classified. Classifications are given in Table 3.
Of the 12 sources with density gradients, 6 show an increased density towards the red and 5 towards the blue. One source, G45.12+0.13, shows a slight increase towards the red over a broad (8 km s-1) velocity range, but a sharp increase towards the blue over only 1 km s-1 and is therefore classified as other.
Figures 23-40 show the ‘main line’ (associated with the UCH II region) profile and the associated density, column, and abundance velocity profiles. The density, column, and abundance measured for each main line via the gaussian fit technique are shown overplotted on the profiles with blue squares. In all cases, the gaussian fit measurement of density is consistent with the individual channels nearby and the gaussian fit measurements of column and abundance are consistent with the peak column and abundance. The consistency of adjacent velocity bins confirms the validity of associating gaussian components in observations of whole galaxies (e.g., Mangum et al. 2008) or kpc-scale regions, since on these scales the and lines should be blended by kinematics to have the same shape.

a. The spectra of G32.80+0.19. The GBT spectrum (red solid) has been smoothed to a resolution of 0.38 km s-1 to match the Arecibo (black dashed) spectral resolution. Labeled vertical bars indicate the measured velocity centers of H and C RRLs from this work, Roshi et al. (2005), and Churchwell et al. (2010).
b. The measured densities in each spectral bin. The Y-scale is in log10 units. Error bars include a 10% systematic uncertainty in the continuum and therefore errors in adjacent channels are not independent. Limits are indicated by triangles. Bins with no information above the 1- noise cutoff are left blank. The increase of density towards higher velocities led us to classify this source as a red gradient in Table 3.
c. The measured column densities per spectral bin. Because these column densities are derived from a large velocity gradient code, they are in per km s-1pc-1 units.
d. The measured abundances per spectral bin. The column and abundance are somewhat degenerate, but it is possible in some cases to place tight constraints on the total column while only placing upper limits on abundance and density. The abundance must also be interpreted per km s-1pc-1.
In plots b through d, the blue square with error bars represents the measured value from Table 5 using gaussian fits to the lines.

6.3. Comparison of RRLs and lines
We compare the density spectra with the fitted RRL centroids and attempt to interpret these spectra in the context of various simple models of H II region interaction with molecular clouds. The simple models described below may actually be short-lived but recurring stages in the normal life cycle of a collapsing clump that is forming massive () stars (Peters et al. 2010).
We consider five simple models of embedded UCH II regions. For each scenario, we include a brief description of the model and an analysis of the observational consequences in terms of C and H RRL velocities and velocity-density structure. We assume that the carbon RRLs are only detected if seen in the foreground of a bright source. This assumption is based on predictions that C RRLs will be amplified by an order of magnitude even in the presence of a weak background (Natta et al. 1994). It is backed by a strong correlation between the continuum and the C RRL intensity (Roshi et al. 2005). We also assume that lower-frequency RRLs will have a stronger stimulated emission component than higher-frequency RRLs (Lockman & Brown 1978). All absorption is assumed to be against the UCH II region in this section. The scenario that describes a given spectrum is listed in the figure caption for each spectrum and in Table 3.

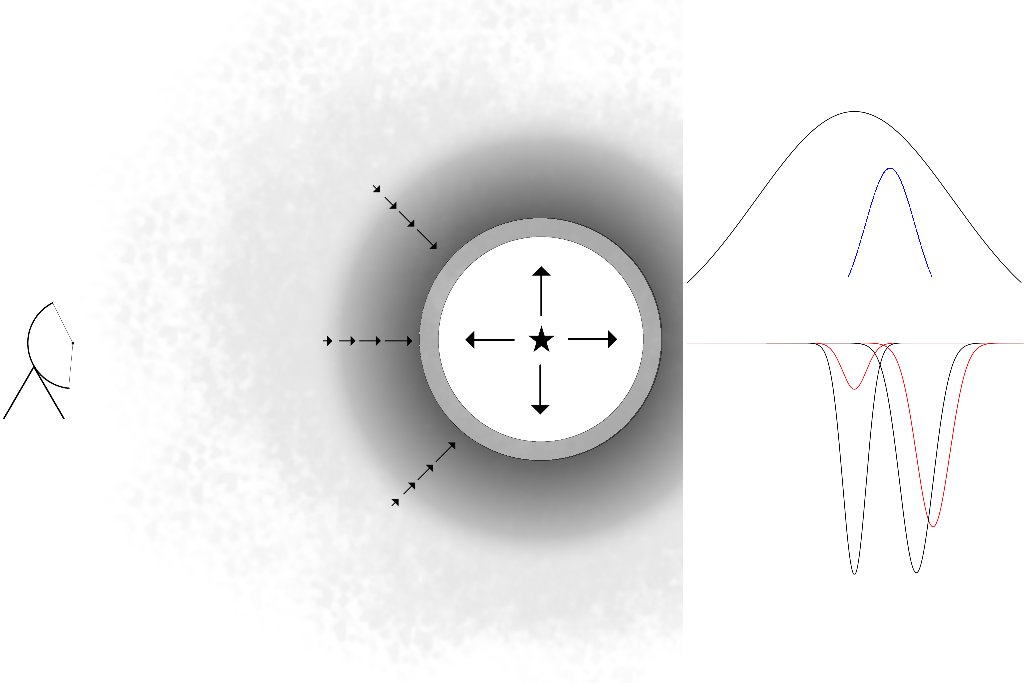
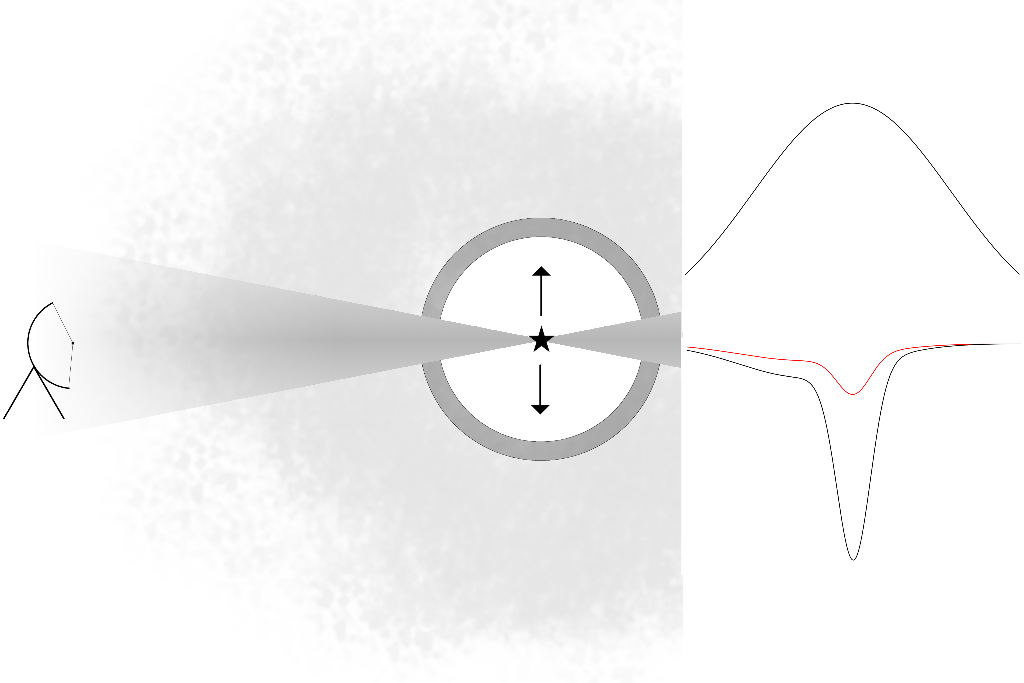
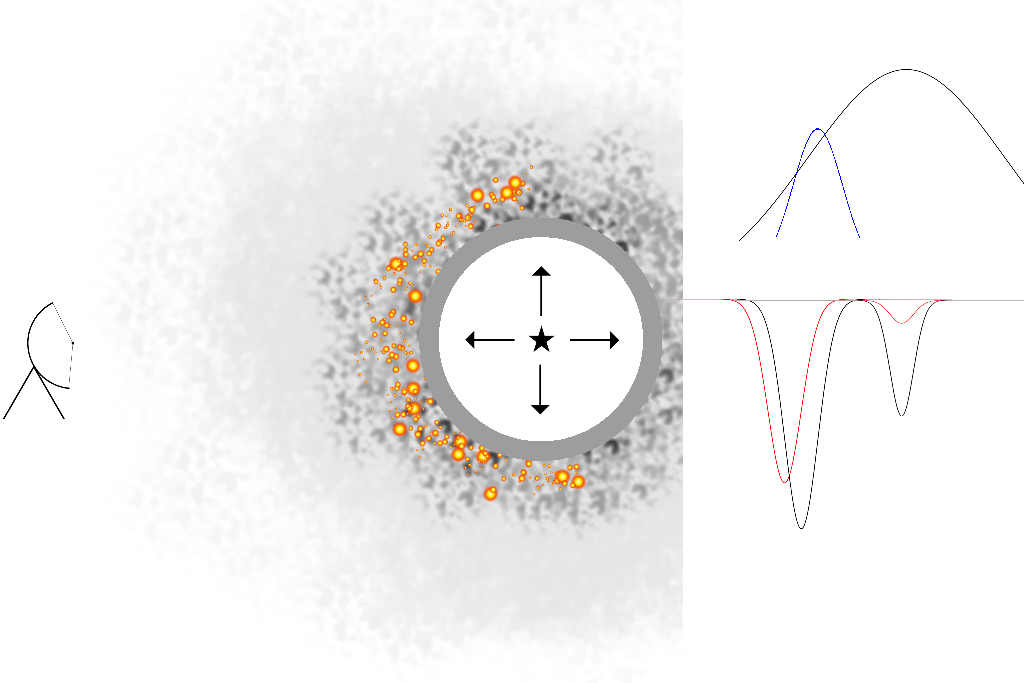
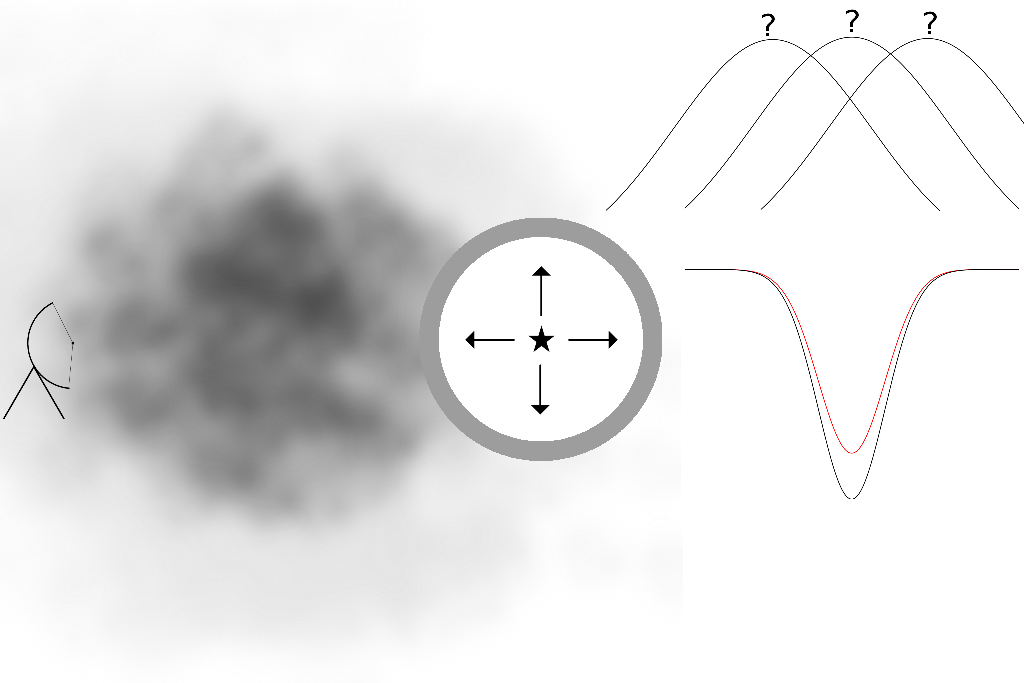
-
•
SCENARIO 1: STATIC
In a uniform medium with no bulk motions (i.e., no collapse), a massive star ignites and generates an expanding H II region. Figure 17.-
1.
Lower frequency RRLs are blueshifted from higher-frequency RRLs because of an increased stimulated emission component (Lockman & Brown 1978)
-
2.
A carbon RRL should be seen at the same velocity as or blueshifted from the hydrogen RRL line center.
-
3.
Molecular gas closest to the H II region should have the highest density because of compression by the expanding H II region. It will be at a similar velocity or blueshifted from the H RRLs.
-
1.
-
•
SCENARIO 2: COLLAPSE
A massive star ignites while spherically accreting from a molecular cloud undergoing bulk (inside-out) collapse. Figure 18.-
1.
The -measured density should peak at the velocities most redshifted relative to the hydrogen RRLs. Inside-out collapse dictates that the highest densities should be infalling at the highest speeds.
-
2.
The C RRL velocity should be between the and H RRL velocity since the PDR will be decelerated by radiation and gas pressure from the H II region
-
3.
Since the accreting star should be at approximately the rest velocity of the cloud, there should be little to no gas blueshifted from the RRL velocity
-
1.
-
•
SCENARIO 3: OUTFLOW
An accreting massive star generates a massive outflow with a significant component along the line of sight. Figure 19.-
1.
Substantial low-column, low-abundance per km s-1 gas should be observed at velocities blue of the RRL velocities. Densities can range from low to high. Covering factors may be low.
-
2.
No carbon RRL is expected from the outflow, though if the flow is accelerated by ionization pressure a C RRL should be observed blueshifted of the H RRL velocity.
-
1.
-
•
SCENARIO 4: SWEEPING
An expanding H II region pushes on a low-density envelope, possibly triggering a new stage of star formation as in the “collect and collapse” scenario. This scenario is similar to #1 but with either a higher-density envelope or with more gas swept up (i.e., #4 may represent a more evolved region). Figure 20.-
1.
The hydrogen RRLs should be red of the dense gas and the carbon RRLs. The expanding H II region should accelerate the dense gas blue along the line of sight.
-
2.
A low-density envelope should persist at the same velocity as the H II region
-
1.
-
•
SCENARIO 5: FOREGROUND CLUMP
A high density, highly turbulent or high mass and rotating clump of gas is in front of the UCH II region or surrounds it. This physical situation may exist in all of the above and provides alternate explanations for any spectral line wings. Figure 21.-
1.
Moderate density gas from a molecular cloud will result in high column but moderate density at the center velocity
-
2.
Wide wings of high density gas will exist both blue and redshifted of the highest-column point
-
1.
6.4. The Filling Factor of Molecular Clouds
We have measured the density in 19 line-of-sight molecular clouds in addition to the 18 measurements of densities around UCH II regions (we only include measurements, not limits, in these counts). The measured density from the line ratio can be compared to other measures of density, e.g. the mean molecular cloud density measured by Roman-Duval et al. (2010) from the BU-FCRAO GRS. It is clear from Figure 22 that the average density in GMCs is typically orders of magnitude lower than densities measured in our sample of line-of-sight GMCs.
Roman-Duval et al. (2010) point out that the mean densities they measure are significantly below the critical density of , , indicating that they do not resolve the high-density clumps that make up the GMCs. Our data indicate that a typical GMC consists of gas (the median of our GMC subsample excluding upper limits), substantially higher than the critical density of . Taking the ratio of the median density in the Roman-Duval et al. (2010) catalog to that in our sample, we derive a volume filling factor of of dense gas in molecular clouds.
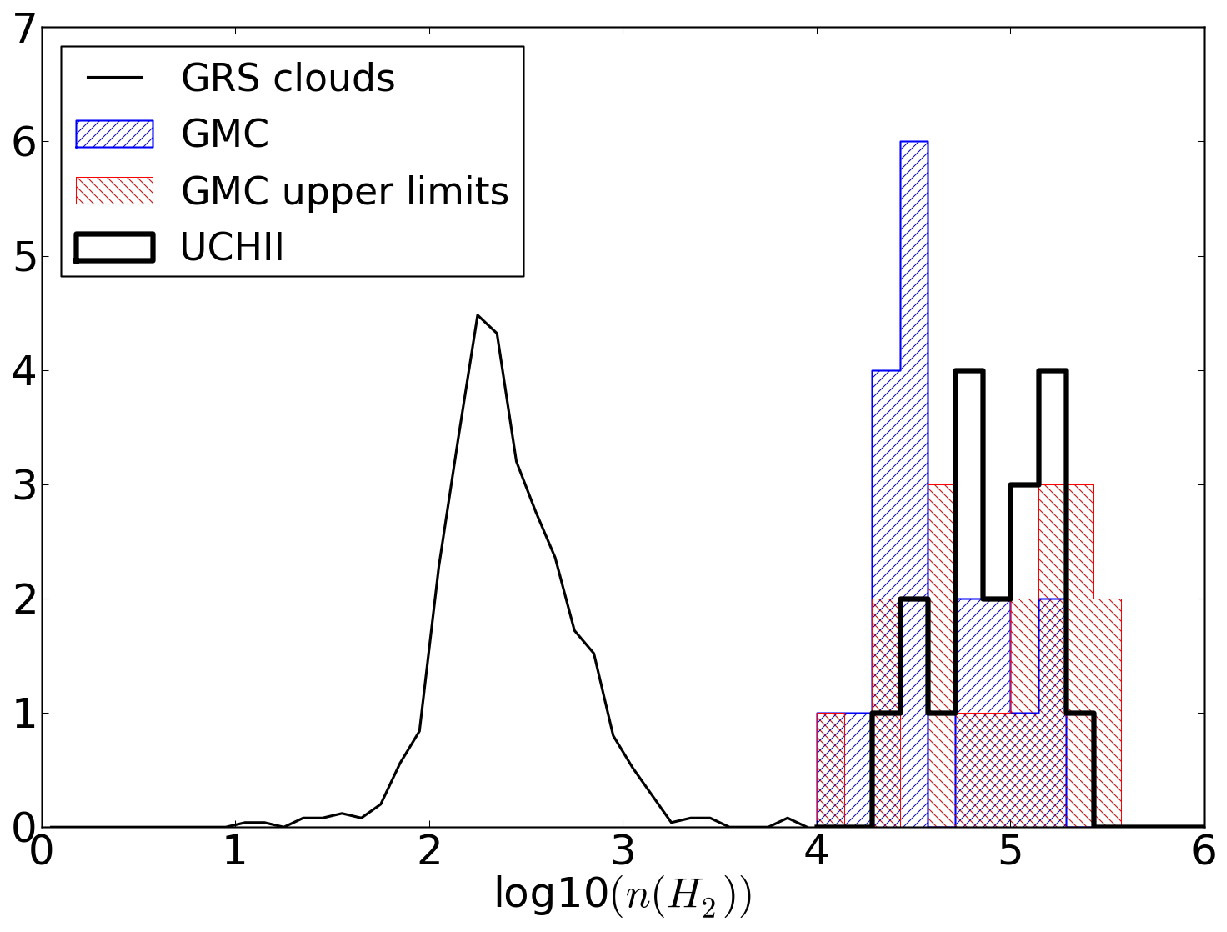
We measured an additional 20 upper limits towards GMCs, all of which are consistent with high densities ( ), but could represent a sample of lower density ( ) gas, in which case our ‘measurement’ of the cloud volume filling factor is biased to be too low. In order to test for this bias, we need to acquire more sensitive observations of the upper-limit systems. However, we continue analysis below based on the assumption that the cloud filling factor measurement is realistic, i.e. assuming that the density upper limit measurements have densities consistent with the other observed GMCs.
Can a medium with supersonic turbulence produce the same density measurements without having to invoke high-density clumping? Below about , measurements of density in a turbulent medium are biased towards higher densities, i.e. the densities we report may be overestimates for GMCs since they have a median density . For turbulent density PDFs with logarithmic widths , the overestimate is no more than 0.4 dex, and therefore can only bring the filling factor up by a factor . As discussed in Section 3.1 and Figure 4, a high-density tail could create a larger discrepancy ( dex). However, at the measured densities, these are extreme upper limits on the ‘turbulent correction’, and therefore (gravo)turbulence alone cannot account for the measured densities.
What clumping properties are required to reproduce the observed density? As long as the clumps are all optically thin in the absorption lines, the spectral line optical depths and ratio are independent of clumping. However, a large number of low-density ( ) clumps optically thick in the line and thin in the line would appear to have a higher density. This phenomenon could only occur at densities , where the absorption line is much stronger than the line, and column densities per clump (at higher columns, both lines are optically thick; at lower columns, both lines are optically thin). Assuming a typical abundance (ortho+para) , the required spherical clump radius would be pc, which would be Jeans-unstable at the assumed density and temperature (40 K) and is therefore unlikely to persist for long time periods 141414However, the lifetime of such clumps in a turbulent medium in which small-scall turbulence supports the clumps against collapse is unconstrained.. We therefore regard a collection of optically thick clumps in the line to be unlikely; clumps optically thick in both lines are even less likely following the same line of reasoning.
The combination of the observed large spatial scales (and therefore low volume-averaged density) of GMCs and the high densities measured along essentially arbitrary sightlines through these GMCs suggests that GMCs are not consistent with a purely turbulent medium with a lognormal density distribution. The observations also require a more substantial high-density tail than typically seen in gravoturbulent simulations, i.e. they require a clumpier medium.
Alternatively, it is possible that is chemically enriched in high-density pockets within a turbulent medium, which would imply that observations probe different gas than CO. No such mechanism has been proposed on theoretical grounds, and the timescales for enhancement would have to be very short (intermittent density enhancement occurs on timescales much shorter than the dynamical timescale; Kritsuk et al. 2007), so we regard this possibility as unlikely but include it for completeness.
Another alternative is that the systematically underestimates the mass or overestimates the volume of the cloud, resulting in an underestimate of the cloud density. Sub-thermal excitation of in the low-density parts of the cloud can lead to an underestimate of the mass (Roman-Duval et al. 2010, Section 9.3). Since the cloud sizes were derived using an assumed spherical symmetry, but molecular gas is typically observed in filamentary structures, the densities in Roman-Duval et al. (2010) are likely to be lower limits on the mean density in the molecular gas. While both of these factors bring the and densities into closer agreement, it is difficult to quantify these effects.
6.5. Strengths and Weaknesses of the K-doublet Densitometer
The dynamic range of a spectral line as a tracer of a physical quantity is an important consideration when designing an experiment. We have demonstrated only a modest dynamic range in density measurements using the and lines in absorption against bright background sources: above , we are only able to set lower limits on the density because the spectral line ratio asymptotes to 1 , and below , the line optical depth drops to very low levels (Figure 2).
The lower limits on density at can only be modestly improved upon by using higher K-doublet transitions (e.g. ) when observing in absorption against bright continuum sources. However, when observing anomolous absorption against the CMB, an additional density diagnostic is the transition from absorption to emission at higher densities, which expands the sensitivity of the / pair to .
The low-density end can only be probed by more sensitive observations of the line. Because the line depths become negligible below , the densitometer is not a useful probe below these densities. However, at such low densities, even within a molecular cloud, it is questionable whether any molecular probes are reliable, as even CO will be underabundant in these environments (e.g., Glover et al. 2010).
As noted in Mangum et al. (2008) and Zeiger & Darling (2010), the K-doublet densitometer has the advantage that line detection only depends on the brightness of the background source and the gas density. It can therefore be used nearly independent of distance when observing clouds against the CMB or bright illuminating background sources. The Zeiger & Darling (2010) measurements are more sensitive than any presented in our study because of longer integration times and the selection of a bright illuminating background source despite their target being at a distance z=0.68. Following this line of reasoning, any bright synchrotron or free-free source can be used to sensitively probe the density of a line-of-sight molecular cloud in the Galaxy. The observation will have angular resolution limited only by the size of the background source as long as it is much brighter than the CMB in the beam.
7. Conclusions
We have presented a pilot study to measure molecular gas densities in clouds along 24 lines of sight in the and transitions primarily toward UCH II regions . We have shown that the densitometer is robust within reasonable ranges of turbulent density distributions, most cloud geometries, and different cloud clumping properties. We have presented the methodology and discussed the errors intrinsic to the densitometer.
Gas volume densities were measured toward 14 of the 24 sources using the best-fit gaussian profiles; density limits were measured for the remaning 10. In 18 sources, it was possible to estimate the density in each 0.4 km s-1-wide channel centered on the main line. Of these, 12 showed some sign of a density gradient with velocity, 5 appeared to have a single-valued density (i.e. only a single spectral line component well-fit by a gaussian), and one, G69.54-0.98, had a spectral line optical depth that was beyond our ability to model.
Velocity-density gradients have been used to fit 18 sources with simple models of UCH II regions embedded in molecular clouds. We have found some examples consistent with inside-out collapse onto the UCH II region, UCH II region expansion, and bulk outflow. absorption provides a unique probe of the physical conditions around UCH II regions because it is only seen in absorption against the continuum background (for sources much brighter than the CMB), giving different constraints than mm and sub-mm spectral lines that are seen both in front of and behind the UCH II region.
The measurements of serendipitously detected line-of-sight GMCs revealed densities times higher than volume-average densities measured using . The high density measured suggests that GMCs consist of many sparsely distributed high-density clumps and have density distributions inconsistent with the lognormal distribution predicted by supersonic turbulent models. The implied density distribution is also more skewed to high densities than predicted by typical gravoturbulent simulations. Alternatively, the -based mean densities may be lower than the mean densities within the molecular gas either because they underestimate the mass or overestimate the volume of GMCs.
The density measurements show that UCH IIs are associated with high-density ( ) gas, and UCH IIs are associated with higher column and volume densities than other line-of-sight molecular clouds, in contradiction with previous results (Wadiak et al. 1988).
The 6 cm, 2 cm, and 1.1 mm flux density measurements are strongly correlated and in most objects in our sample the 1.1 mm flux density has a substantial () contribution free-free continuum emission. This result implies that the brightest sources detected in the BGPS have significant free-free emission. A comparison to the 6 cm MAGPIS survey suggests that the sample of 1.1 mm sources below about 3 Jy is not significantly contaminated by pure free-free emission sources.
Comparison of the density measurements in our sample to the starburst sample of Mangum et al. (2008) suggest that the molecular gas volume filling factor in most of these galaxies is small (), but in Arp 220 it is quite high (). The physical properties measured by in Arp 220 are similar to those in UCH II regions. Although velocity-density gradients are observed in our sample, we argue that kinematic spectral line blending should uphold the assumption of a single spectral line profile in galaxies as robust for radiative transfer purposes.
8. Acknowledgements
We thank Jim Braatz for assistance with data acquisition and processing, Esteban Araya for providing us with reduced data, and our referee Jeff Mangum for a helpful and timely review. This work was supported by the National Science Foundation through NSF grant AST-0708403 to John Bally and AST-0707713 to Jeremy Darling. This research has made use of the SIMBAD database, operated at CDS, Strasbourg, France. This research made use of pyspeckit, an open-source spectroscopic toolkit hosted at http://pyspeckit.bitbucket.org.
Facilities: GBT, Arecibo, VLA, FCRAO, CSO
References
- Aguirre et al. (2011) Aguirre, J. E. et al. 2011, ApJS, 192, 4
- Anderson et al. (2009) Anderson, L. D., Bania, T. M., Jackson, J. M., Clemens, D. P., Heyer, M., Simon, R., Shah, R. Y., & Rathborne, J. M. 2009, ApJS, 181, 255
- Araya et al. (2002) Araya, E., Hofner, P., Churchwell, E., & Kurtz, S. 2002, ApJS, 138, 63
- Araya et al. (2004) Araya, E., Hofner, P., Linz, H., Sewilo, M., Watson, C., Churchwell, E., Olmi, L., & Kurtz, S. 2004, ApJS, 154, 579
- Bally et al. (2010) Bally, J. et al. 2010, ApJ, 721, 137
- Benjamin et al. (2003) Benjamin, R. A. et al. 2003, PASP, 115, 953
- Cho & Kim (2011) Cho, W. & Kim, J. 2011, MNRAS, 410, L8
- Churchwell (2002) Churchwell, E. 2002, Annual Review of Astronomy and Astrophysics, 40, 27
- Churchwell et al. (2010) Churchwell, E., Sievers, A., & Thum, C. 2010, A&A, 513, A9+
- Clauset et al. (2009) Clauset, A., Rohilla Shalizi, C., & Newman, M. E. J. 2009, SIAM Review, 51, 661
- de Wit et al. (2005) de Wit, W. J., Testi, L., Palla, F., & Zinnecker, H. 2005, A&A, 437, 247
- Dickel & Goss (1987) Dickel, H. R. & Goss, W. M. 1987, A&A, 185, 271
- Dickel et al. (1986) Dickel, H. R., Goss, W. M., Rots, A. H., & Blount, H. M. 1986, A&A, 162, 221
- Dunham et al. (2010) Dunham, M. K. et al. 2010, ApJ, 717, 1157
- Federrath et al. (2010) Federrath, C., Roman-Duval, J., Klessen, R. S., Schmidt, W., & Mac Low, M. 2010, A&A, 512, A81+
- Glover et al. (2010) Glover, S. C. O., Federrath, C., Mac Low, M., & Klessen, R. S. 2010, MNRAS, 404, 2
- Green (1991) Green, S. 1991, ApJS, 76, 979
- Helfand et al. (2006) Helfand, D. J., Becker, R. H., White, R. L., Fallon, A., & Tuttle, S. 2006, Astronomical Journal, 131, 2525
- Henkel et al. (1980) Henkel, C., Walmsley, C. M., & Wilson, T. L. 1980, A&A, 82, 41
- Henkel et al. (1983) Henkel, C., Wilson, T. L., Walmsley, C. M., & Pauls, T. 1983, A&A, 127, 388
- Jackson et al. (2006) Jackson, J. M. et al. 2006, ApJS, 163, 145
- Kainulainen et al. (2009) Kainulainen, J., Beuther, H., Henning, T., & Plume, R. 2009, A&A, 508, L35
- Keto (2007) Keto, E. 2007, ApJ, 666, 976
- Klessen (2000) Klessen, R. S. 2000, ApJ, 535, 869
- Kritsuk et al. (2007) Kritsuk, A. G., Norman, M. L., Padoan, P., & Wagner, R. 2007, ApJ, 665, 416
- Lockman & Brown (1978) Lockman, F. J. & Brown, R. L. 1978, ApJ, 222, 153
- Mangum et al. (2008) Mangum, J. G., Darling, J., Menten, K. M., & Henkel, C. 2008, ApJ, 673, 832
- Mangum & Wootten (1993) Mangum, J. G. & Wootten, A. 1993, ApJS, 89, 123
- McKee & Ostriker (2007) McKee, C. F. & Ostriker, E. C. 2007, ARA&A, 45, 565
- Natta et al. (1994) Natta, A., Walmsley, C. M., & Tielens, A. G. G. M. 1994, ApJ, 428, 209
- Peters et al. (2010) Peters, T., Banerjee, R., Klessen, R. S., Mac Low, M., Galván-Madrid, R., & Keto, E. R. 2010, ApJ, 711, 1017
- Reid et al. (2010) Reid, M. A., Wadsley, J., Petitclerc, N., & Sills, A. 2010, ApJ, 719, 561
- Reid et al. (2009) Reid, M. J. et al. 2009, ApJ, 700, 137
- Rivera-Ingraham et al. (2010) Rivera-Ingraham, A. et al. 2010, 1009.1296
- Roman-Duval et al. (2010) Roman-Duval, J., Jackson, J. M., Heyer, M., Rathborne, J., & Simon, R. 2010, ApJ, 723, 492
- Roshi et al. (2005) Roshi, D. A., Balser, D. S., Bania, T. M., Goss, W. M., & De Pree, C. G. 2005, ApJ, 625, 181
- Rosolowsky et al. (2010) Rosolowsky, E. et al. 2010, ApJS, 188, 123
- Sewilo et al. (2004) Sewilo, M., Watson, C., Araya, E., Churchwell, E., Hofner, P., & Kurtz, S. 2004, ApJS, 154, 553
- Sunada et al. (2007) Sunada, K., Nakazato, T., Ikeda, N., Hongo, S., Kitamura, Y., & Yang, J. 2007, PASJ, 59, 1185
- Troscompt et al. (2009a) Troscompt, N., Faure, A., Maret, S., Ceccarelli, C., Hily-Blant, P., & Wiesenfeld, L. 2009a, A&A, 506, 1243
- Troscompt et al. (2009b) Troscompt, N., Faure, A., Wiesenfeld, L., Ceccarelli, C., & Valiron, P. 2009b, A&A, 493, 687
- Turner et al. (1989) Turner, B. E., Richard, L. J., & Xu, L. 1989, ApJ, 344, 292
- Urquhart et al. (2009) Urquhart, J. S. et al. 2009, A&A, 501, 539
- van der Tak et al. (2007) van der Tak, F. F. S., Black, J. H., Schöier, F. L., Jansen, D. J., & van Dishoeck, E. F. 2007, A&A, 468, 627
- Wadiak et al. (1988) Wadiak, E. J., Rood, R. T., & Wilson, T. L. 1988, ApJ, 324, 931
- Wilson et al. (2009) Wilson, T. L., Rohlfs, K., & Hüttemeister, S. 2009, Tools of radio astronomy (Springer)
- Zeiger & Darling (2010) Zeiger, B. & Darling, J. 2010, ApJ, 709, 386
- Zylka et al. (1992) Zylka, R., Guesten, R., Henkel, C., & Batrla, W. 1992, A&AS, 96, 525
