Investigation of bone resorption within a cortical basic multicellular unit using a lattice-based computational model
Deptartment of Chemical and Biomolecular Engineering, Vanderbilt University, Nashville, TN 37235, USA
Center for Nanophase Materials Sciences, Oak Ridge National Laboratory, Oak Ridge, TN 37831, USA
October 14, 2011)
Abstract
In this paper we develop a lattice-based computational model focused on bone resorption by osteoclasts in a single cortical basic multicellular unit (BMU). Our model takes into account the interaction of osteoclasts with the bone matrix, the interaction of osteoclasts with each other, the generation of osteoclasts from a growing blood vessel, and the renewal of osteoclast nuclei by cell fusion. All these features are shown to strongly influence the geometrical properties of the developing resorption cavity including its size, shape and progression rate, and are also shown to influence the distribution, resorption pattern and trajectories of individual osteoclasts within the BMU. We demonstrate that for certain parameter combinations, resorption cavity shapes can be recovered from the computational model that closely resemble resorption cavity shapes observed from microCT imaging of human cortical bone.
Keywords: bone resorption cavity, cortical Bone Multicellular Units (BMU), osteoclast–osteoclast interaction, osteoclast–bone interaction, osteoclast fusion, computational model
Email addresses:
pascal.buenzli@uwa.edu.au (P R Buenzli),
junhwan.jeon@vanderbilt.edu (J Jeon),
peter.pivonka@uwa.edu.au (P Pivonka),
david.smith@uwa.edu.au (D W Smith),
peter.cummings@vanderbilt.edu (P T Cummings)
1 Introduction
The functional unit of cells in bone remodelling is the ‘basic multicellular unit’ or BMU (Frost,, 1969; Parfitt, 1983b, ; Parfitt et al.,, 1987). BMUs are transient functional grouping of cells that progress through the bone, removing old bone and replacing it with new bone. A single BMU comprises active multinucleated osteoclasts resorbing bone matrix at the front of the BMU, and active osteoblasts towards the rear of the BMU forming osteoid, which is later mineralized to form new bone matrix. As the BMU progresses, the resorbing osteoclasts open-up a void space in the bone matrix called a BMU ‘cutting cone’, while the osteoblasts reduce the void space as bone is formed in a so-called BMU ‘closing cone’ (Parfitt,, 1994).
This paper focuses on a computational model of one aspect of cortical BMU function, namely, osteoclasts opening up the cutting cone at the front of a single cortical BMU. This resorption process determines in particular the diameter and morphology of the secondary osteon created by the BMU. Here we show that for certain parameter combinations, we can demonstrate good agreement between the cutting cone shapes and osteon morphologies generated by the computational model, and the cutting cone shapes and osteon morphologies observed experimentally.
The development of our computational model relies upon detailed quantitative experimental observations. Much of what is known about the behaviour of cortical BMUs has been obtained from quantitative analysis of two dimensional histomorphometric data. Indeed, quantitative analysis of BMUs using stereology has been a primary focus of Frost, (1969, 1983), Parfitt, (1979); Parfitt, 1983b and Martin, (1994). As a result of the research based on histomorphometric data, we now have reasonably reliable quantitative estimates for resorption properties, and we can define the general properties of a hypothetical ‘average cortical BMU’. For example, quantitative estimates have been made of resorption properties including osteoclast number, osteon diameter, and the duration and speed of movement of the BMU through cortical bone (Parfitt,, 1994; Robling et al.,, 2006).
This histomorphometric data is supplemented by in vivo data, which has given additional insights into osteoclast behaviour at the front of the BMU. Most importantly, auto-radiographic studies of cell migration in cortical BMUs have revealed that thymidine-labelled nuclei from osteoclast precursor cells fuse randomly with existing osteoclasts (Jaworski et al.,, 1981; Miller,, 1981; Parfitt,, 1994; Parfitt et al.,, 1996). This fusion process leads to the continual renewal of the nuclei within the active osteoclasts at the front of BMUs, which is believed to account for an increase in the osteoclasts’ lifespan and/or the persistence of their resorptive activity.
This histomorphetric data and in vivo data are supplemented by in vitro cell-culture data, which has given additional insights into osteoclast behaviour. For example, the microscopic bone dissolution process operated by active osteoclasts is now known to be achieved by the release of hydrogen ions and proteases into the ‘resorption pit’ beneath the ruffled border of the osteoclast (Hall,, 1991; Väänänen and Zhao,, 2008). Interestingly, observations on in vitro osteoclasts suggest that they resorb bone matrix for a period of time, then detach from the bone surface, before continuing resorption at a different site of the bone surface (Hall,, 1991; Martin,, 2002; Väänänen and Zhao,, 2008). However, it is known that in vitro observations need to be interpreted with caution, as osteoclasts in vitro often exhibit obviously different behaviours (such as low bone resorption activity), raising questions about their phenotype (Susa et al.,, 2004). Whether this detachment-delay-reattachment behaviour actually occurs in vivo is not known (Everts et al.,, 2002), but this question is explored here using our computational model.
Serial histological sectioning of bone in humans and other animals has revealed that osteons are irregular cylindrical structures that vary in cross-sectional shape and anastomose extensively with one another, forming a complex network structure (Cohen and Harris,, 1958; Tappen,, 1977; Stout et al.,, 1999; Moshin et al.,, 2002). More recently, microCT imaging has enabled the direct visualisation of the resorption cavity shape and of the network structure of Haversian canals in three spatial dimensions (Britz et al.,, 2009; Cooper et al.,, 2006). In particular, Cooper et al., (2006) found that the morphology of the BMU spaces was varied, and included unidirectional, bi-direction and branched BMU morphologies. More specifically, the cutting cones of the BMUs imaged by Cooper et al., (2006) showed a generally ellipsoidal shape, but often the exact shape of the cutting cone is variable. In some image reconstructions shown in (Cooper et al.,, 2006), the surface of the cutting cone is noticeably rough. Our computational model enables us to hypothesise processes by which the network structure of osteons might emerge or that influence the size and shape of the resorption cavity.
After many decades of dedicated research by bone biologists, there now appears to be sufficient quantitative data and observations to develop a computational model describing the evolution of the cutting cone in a single BMU in cortical bone. Our aim in this paper is to begin the process of integrating and assessing some of the reported data and observations identified above, and in doing so, start to develop a ‘dynamic picture’ of osteoclast resorption and cutting cone evolution at the front of a moving cortical BMU.
Computational models of bone remodelling by BMUs have been proposed previously. For example, in (Buenzli et al.,, 2011; Ryser et al.,, 2009), the spatio-temporal organisation of bone cells within a single BMU was investigated. Other works have focused on the external mechanical conditions of BMUs (van Oers et al., 2008a, ; van Oers et al., 2008b, ; Burger et al.,, 2003; García-Aznar et al.,, 2005). Our model is similar to the discrete model of van Oers et al., 2008a ; van Oers et al., 2008b , which is based on a cellular Potts model (Glazier and Graner,, 1993). In (van Oers et al., 2008b, ), a relationship between osteon diameter and strain is investigated, but the generation and maintenance of osteoclasts is solely determined by the local strain energy density at the bone surface. Furthermore, that relationship is not explained in terms of properties of the constituents of a BMU (such as number and activity of osteoclasts). Several biological processes influence osteoclastogenesis in a cortical BMU. To our knowledge, our model is the first to address how important biological processes that support osteoclastic resorption in cortical bone (in particular, the growth of a blood vessel and osteoclastic nuclei renewal) influence the shape of a BMU’s cutting cone, osteon diameter and a BMU’s progression rate.
While the computational model developed here only involves osteoclasts and focuses on the formation of the resorption cavity at the front of a single cortical BMU, it is helpful to be more specific about what the model does not include. The model does not include other cells in the BMU (e.g. osteoblasts, osteocytes, endothelial cells or immune cells) and does not include other processes occurring in the BMU (e.g. osteoid formation and mineralization, and osteocytic signals). Though much research in bone biology since the 1990s has been focused on discovering and understanding signaling pathways that coordinate cells and processes within a BMU, the computational model developed here does not include explicit cell-cell signaling or explicit intracellular signal-transduction pathways. Specifically, the model does not include explicit signaling processes leading to osteoclast formation, or explicit signaling processes that may operate within the cutting cone. Rather, in this paper we have taken the approach of simulating key osteoclast behaviours that enable formation of a resorption cavity that are consistent with experimental observations. We simply establish a lattice-based computational model of osteoclast resorption, and identify some of the requirements that are particularly important for the development of normal resorption cavity shapes consistent with experimental observations.
The computational model is investigated through ‘parameter variations’. In much the same way that under-expression or over-expression of a gene illustrates the effect of that gene in an in vivo system, so parameter variation illustrates the effect of that parameter in an in silico system (that is, in the computational model). By this means, key influences on the outputs of the computational model can be identified.
The paper is organised as follows: in Section 2 we describe our lattice-based computational model for the evolution of the BMU resorption cavity (a precise mathematical description of this model is given in Appendix A). In Section 3 we first identify the importance of cell-cell adhesion, cell-bone adhesion and osteoclast access to the resorption surface for normal cavity shape formation, and then go on to identify the critical importance that the position of the tip of the blood vessel within the resorption cavity has on the evolution of the shape of the resorption cavity. The influence on resorption cavity shape and osteon morphology of osteoclast number, osteoclast longevity and nuclei fusion is also reported in Section 3. In Section 4 we discuss these results and make predictions of osteoclast movement patterns within the resorption cavity, which to date have not been possible to observe experimentally. We also compare model predictions with experimental data on osteon shape and BMU resorption cavity shape. Finally, in Section 5, we conclude and note future research directions.
2 Model description
We first summarise current biological knowledge of osteoclastic resorption in cortical BMUs before outlining the main features of the model.
Osteoclasts are known to resorb bone matrix to form the so-called ‘cutting cone’ at the front of a cortical BMU (Martin et al.,, 1998; Parfitt,, 1994). To dissolve the bone matrix, an osteoclast first attaches to the bone surface, forming a ‘sealing zone’ that encircles a small portion of the bone surface that will be resorbed (Hall,, 1991; Väänänen and Zhao,, 2008). Within this sealed portion of the bone surface, hydrogen ions and proteases released through the osteoclast’s ‘ruffled border’ dissolves both the mineral and collageneous components of the bone matrix. In vitro studies suggest that complete dissolution of the collageneous component of the bone matrix may require exposure to the extracellular microenvironment, where several proteases (such as MMPs) secreted by other cells in the BMU are known to be able to degrade this organic component (Everts et al.,, 2002; Väänänen and Zhao,, 2008). While osteoclasts can also degrade this organic component through the production of cathepsins (Baron et al.,, 1993), they are observed in vitro to physically detach from the bone surface before continuing their resorption at more highly mineralised bone locations (Hall,, 1991; Chambers et al.,, 1985; Matsuoka et al.,, 1998; Schilling et al.,, 2006). It is not known whether this behaviour occurs in vivo (Martin,, 2002; Väänänen and Zhao,, 2008). The resorption process is sustained by the growth of a blood vessel, which provides the local BMU microenvironment with both nutrients and precursor cells (in particular precursor osteoclasts) (Parfitt,, 1998). The maturation of osteoclasts in a BMU is the result of a cascade of events that take place around the tip of the blood vessel. This cascade of events involves several cell types and molecules (such as pre-osteoblasts, MCSF, and RANKL, see e.g. (Roodman,, 1999; Martin,, 2004)) and includes the fusion of mononucleated pre-osteoclasts. This leads to the generation of mature, multinucleated osteoclasts at the front of the BMU (Parfitt,, 1998). Multinucleated osteoclasts, however, are believed to be dynamic entities. Autoradiographic studies of cell migration in cortical BMUs have revealed that thymidine-labelled nuclei from osteoclast precursor cells fuse randomly with existing osteoclasts (Jaworski et al.,, 1981; Miller,, 1981; Parfitt,, 1994; Bronckers et al.,, 1996; Fukushima et al.,, 1991). This process leads to the continual renewal of the nuclei within osteoclasts at the front of BMUs, which is believed to account for an increase in the osteoclasts’ lifespan and/or the persistence of their resorptive activity.
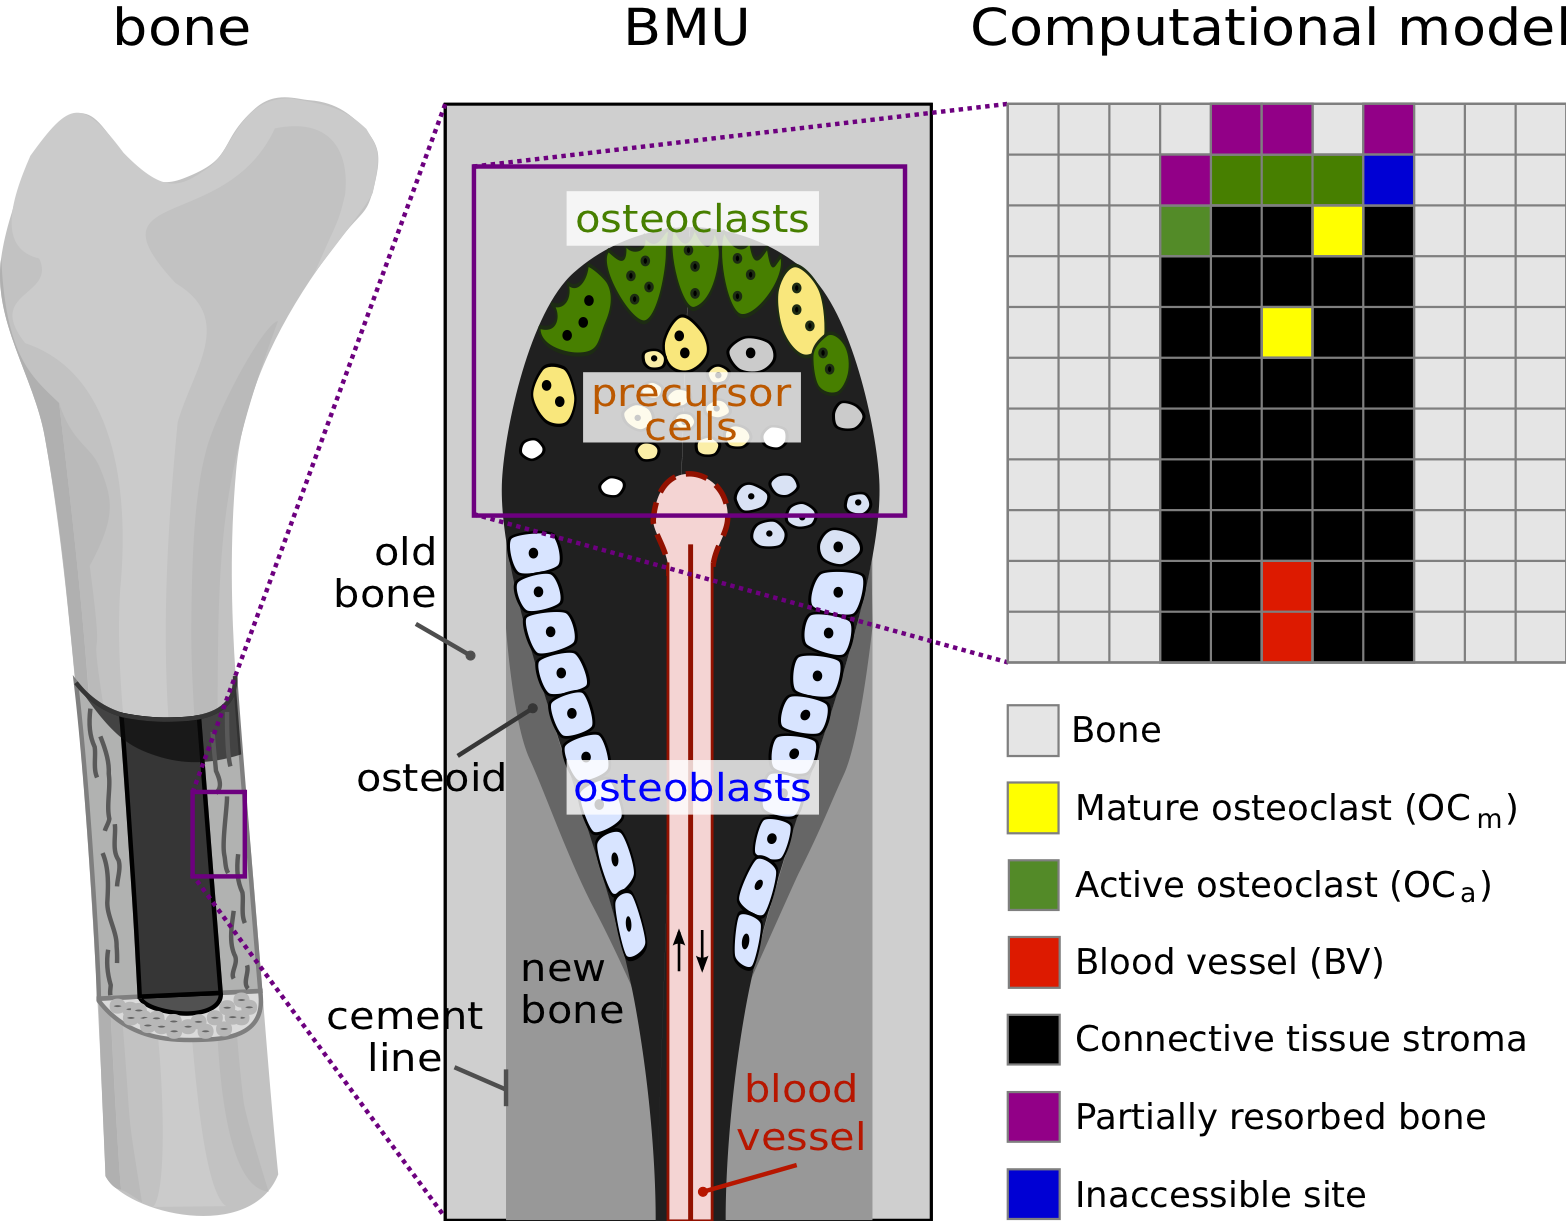
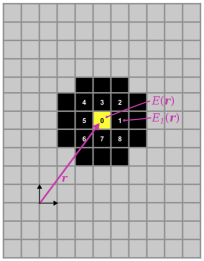
In this paper, we consider a two-dimensional slice of cortical bone being resorbed by osteoclasts, as would be seen in a thin longitudinal section running through the centreline of a cortical BMU (Figure 1). To investigate this system, we take a modelling approach in which each osteoclast is tracked individually and the position and activity of the osteoclasts (resorbing or not) is updated at regular time intervals. This type of modelling approach is known as ‘agent-based modelling’, and has been widely used in recent years for computational models of tumours and other biological systems (Mansury et al.,, 2002; Walker et al.,, 2004; Zhang et al.,, 2009; Anderson et al.,, 2006; Gerlee and Anderson,, 2007; Jeon et al.,, 2010). It differs from the more commonly used continuous approaches that use ordinary or partial differential equations, in that discrete cells are represented, rather than “smeared” quantities. The choice of this modelling approach is made here because: (i) a BMU contains only few osteoclasts confined within a very small volume; (ii) our purpose is to simulate the individual and collective behaviours of osteoclasts, and to understand how these behaviours in turn influence bone resorption within a single BMU. The consideration of individual osteoclasts in this agent-based approach allows us to represent complex biochemical mechanisms (such as osteoclast–bone adhesion) directly at the level of individual cells: the biochemical mechanisms are represented mathematically as ‘evolution rules’ for the migration behaviour and resorption activity of the osteoclasts. To simplify the mathematical representation, we further assume that space is discretised: the individual osteoclasts in the BMU are assumed to migrate on a two-dimensional lattice (see Figure 1). The lattice step size is taken to correspond to the average size of multinucleated osteoclasts.
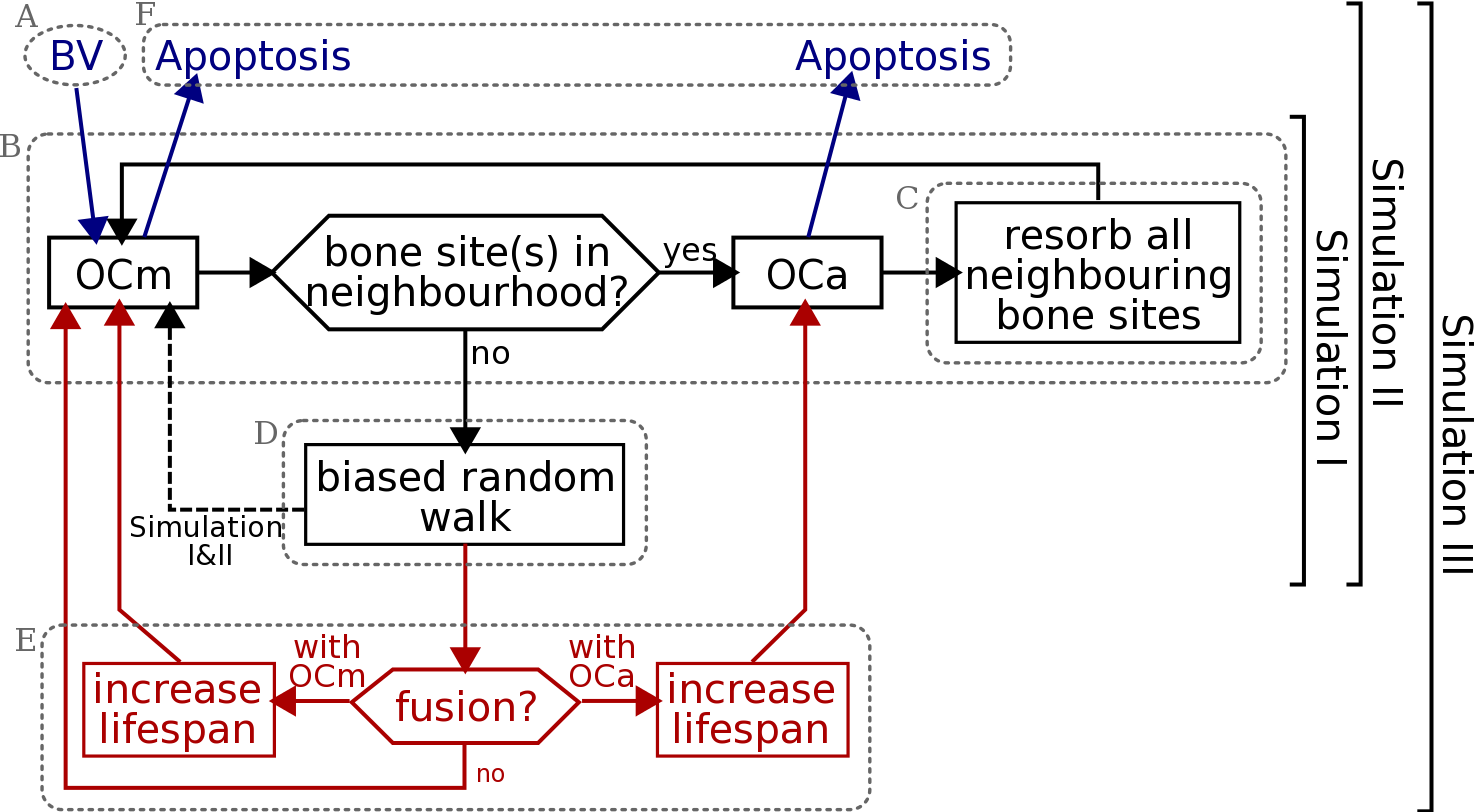
The biological processes of osteoclastic resorption summarised above are captured in our model by the following model features. A flow chart of these model features is shown in Figure 2:
-
•
Fully mature osteoclasts are assumed to be generated at a rate (in ) from the tip of a blood vessel (BV) which grows towards the front of the BMU at a maximum rate (in ) (Figure 2, A);
-
•
An osteoclast can be in either of two states: ‘migrating’ (not resorbing) or ‘active’ (resorbing). We denote a migrating osteoclast by and an active osteoclast by . An osteoclast becomes active as soon as it reaches a bone surface. It remains active and immotile until all of its surrounding bone sites are resorbed, at which point it becomes a migrating osteoclast again (Figure 2, B);
-
•
Dissolution of the bone matrix by an is represented by a kinetic dissolution law that gradually reduces bone density in time. Bone matrix at a lattice site that has been resorbed by more than 90% is assumed to become a cavity site filled with connective tissue stroma. However, such a site is deemed inaccessible to s for a time period to allow for possible extracellular collagen digestion (Figure 2, C);
-
•
The migration of s through the connective tissue stroma is modelled as a ‘biased random walk’. At each time increment, the chooses a lattice site to migrate to with a probability that depends on the presence of other components in its vicinity. The interaction of the with these components is described by ‘interaction energies’. For example, denotes an osteoclast–osteoclast adhesion energy, and denotes an osteoclast–bone adhesion energy. The lower the total energy at a neighbouring lattice site, the higher the probability of migrating towards this site (Figure 2, D);
-
•
Osteoclasts that are newly generated are initially assigned a fixed lifespan . To account for a lifespan-increasing nuclei renewal process in our simulations, a migrating can fuse with an existing or (with different probabilities, depending on the ‘fusion energies’ and , respectively). The lifespan of the osteoclast resulting from this fusion is increased by the remaining lifetime of the fusing (Figure 2, E);
-
•
When the age of an osteoclast reaches its alloted lifespan (whether that lifespan has been increased by nuclei renewal or not), the cell is removed from the system (Figure 2, F).
The technical details of the model are discussed in Appendix A, and a full list of the model parameters is given in Table 1. For each parameter, Table 1 also lists the range of values investigated in Section 3, and a so-called ‘default’ value, which is assigned unless that parameter is explicitly varied.
3 Simulation results
A multiplicity of physiological events takes place in the resorption cone of a BMU and it can be difficult to gain an understanding of the specific influence of each of these events on the dynamics of bone resorption in the BMU. However, some of these influences can be studied using our model. To this end, we develop an understanding of the model by including model features incrementally. We denote this incremental introduction of model features by Simulation I, Simulation II and Simulation III, in increasing order of complexity. The model features taken into account in each of these simulations are highlighted in Figure 2.111It is noted that Simulation I and Simulation II can be retrieved from the full model (Simulation III) by considering extreme values for some parameters. Specifically, Simulation II is obtained from Simulation III by impeding nuclei renewal by fusion () and Simulation I is obtained from Simulation II by assuming non-renewed osteoclasts ().
A key model output that is used to narrow down a physiologically realistic parameter space is the shape and extent of the resorption cavity after a simulation of 30 days. This choice of the duration of the simulation enables the system to evolve from its initial conditions and to reach a pseudo steady state at the front of the BMU, where the shape of the cutting cone as well as the relative spatial distribution of cells is no longer changing over time on average. This simulation duration is also well within the average lifespan of a BMU, which is estimated to be about 6–12 months (Parfitt,, 1994).
3.1 Simulation I
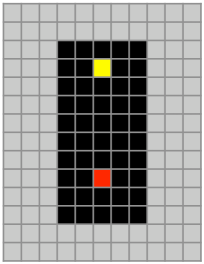
Simulation I has the fewest model features (Figure 2). In Simulation I, osteoclasts are neither dynamically generated nor eliminated. The total number of osteoclasts is fixed and their lifespan is assumed to be infinite (no blood vessel nor nuclei renewal mechanism is considered for this study). While this simulation is clearly not physiological, it allows us to develop an understanding of how osteoclast–osteoclast interaction, osteoclast–bone adhesion and extracellular collagen digestion (via the parameters , and , respectively) influence the dynamics of bone resorption, without the additional complexity of birth and death processes of the osteoclasts. The initial configuration for the simulation consists of nine osteoclasts placed at the nine central sites of the cavity shown in Figure 11(a).
Interestingly, a unidirectional resorption pattern (resulting in an elongated cavity) spontaneously emerges for an osteoclast–osteoclast adhesion much stronger than an osteoclast–bone adhesion (). However, one expects the physiological situation to be the reverse case, where osteoclast–bone adhesion is strong compared to an osteoclast–osteoclast interaction (). Indeed, it is well established that mature osteoclasts are found in the vicinity of bone surfaces and can strongly adhere to bone through the formation of a dense actin ring (the sealing zone) (Väänänen and Zhao,, 2008). But mature osteoclasts do not seem to strongly adhere to one another through the expression of specific adhesion molecules after their formation, though there are possibly some cadherin molecules on the mature osteoclast surface (Helfrich et al.,, 2008; Civitelli et al.,, 2008). To represent this fact, and because mature osteoclasts are not usually found isolated in cortical BMUs, a small osteoclast–osteoclast interaction energy is selected (see Table 1). In our simulations, a relatively strong osteoclast–bone adhesion energy makes bone resorption more persistent. At weaker values of , the osteoclast spends most of its time migrating within the connective tissue stroma and may be found far from a bone surface.
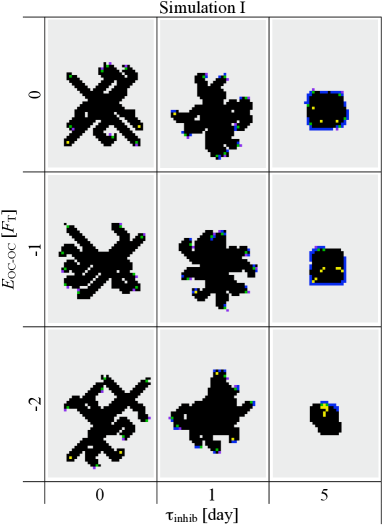
Figure 3 shows the combined effect of osteoclast–osteoclast interaction and extracellular digestion time on the resorption cavity. Preventing osteoclast attachment for a period for extracellular collagen digestion strongly affects the behaviour of bone resorption. With increasing values of , the osteoclast migrates for longer periods of time. At smaller values of , several osteoclasts are observed to resorb bone matrix side by side at the beginning. But they move apart from each other and independently resorb bone matrix at later times by branching out from the original resorption cavity and go their separate ways. Increasing the strength of osteoclast-osteoclast interaction slightly reduces the occurrence of branching. Collagen digestion time strongly affects branching behaviour, but this parameter also strongly influences the efficacy of bone resorption, as can be seen in Figure 3 for .
From Figure 3, one also sees that bone resorption in our model occurs preferentially in diagonal directions. Due to the relatively strong osteoclast–bone adhesion, s preferentially maximise contact with bone surfaces, leading to diagonal movement on the lattice, since bone surface at a corner is larger than bone surface along a flat edge. Such a diagonal bias introduces an unavoidable anisotropy from a lattice model. However, this shows that the local curvature of the bone surface directly affects osteoclastic bone resorption.
| (a) | (b) |
|---|---|
 |
|
Our results from Simulation I suggest that the magnitude of osteoclast–bone adhesion energy should be chosen large compared to so that bone resorption is more persistent and to avoid osteoclasts being far from a bone surface. As discussed above, these parameter values are in fact expected physiologically, but importantly, we observe that by themselves, they do not lead to a unidirectional progression of the resorption cavity. Rather, they lead to directionless openings that grow larger over time. It is apparent that the parameter (extracellular collagen digestion period) needs to be fairly small, as a large value strongly reduces the amount of bone resorption possible (see Figure 3; ).
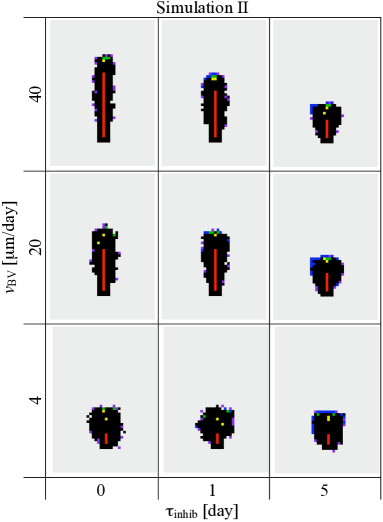
3.2 Simulation II
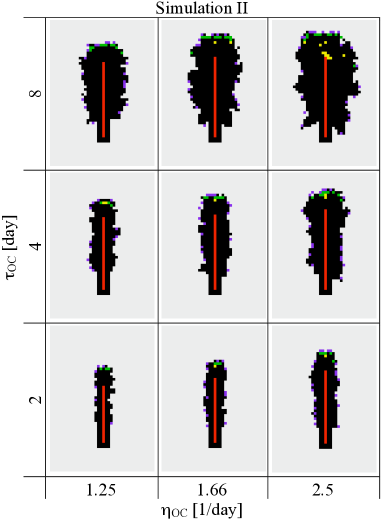
The absence of a preferred direction for the resorption of bone in Simulation I is a clear indication that the model requires additional processes to produce a ‘cutting cone’. Such an outcome can be obtained by including the growth of a blood vessel. This model feature can account for both the renewal of the osteoclast population and the unidirectional progression of the BMU. Three new parameters are introduced in Simulation II, namely: the maximal rate of growth of the blood vessel (), the generation rate of osteoclasts () and the lifespan of osteoclasts (). The initial configuration of the simulation is depicted in the appendix (Figure 11(b)). Experimentally, osteons have a diameter of the order of 200–350 and BMUs progress through bone at a rate of 20–40 /day (Parfitt, 1983a, ; Parfitt,, 1994; Robling et al.,, 2006). To retrieve such osteon diameters and BMU progression rates in our simulations, a combination of both values of of 20–40 /day and small values of needs to be chosen (see Figure 4(a)). For such small values of , osteoclasts are not observed to migrate away from a previous resorption site before starting to resorb again. This suggests that ‘detachment–delay–reattachment’ behaviour of an osteoclast is very localised within a cortical BMU (with no significant migration before reattachment). We infer that extracellular collagen dissolution is unlikely to be a rate limiting step for resorption within a cortical BMU.
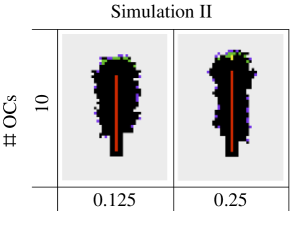
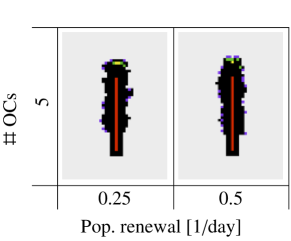
Figure 4(b) shows the combined effect of the generation rate of osteoclasts () and of the lifespan of osteoclasts () on the resorption cavity. These model parameters affect both the average number of osteoclasts in the cavity (which is equal to ) and the renewal rate of this population (which is equal to ). The generation rate and lifespan of osteoclasts are often disrupted in bone diseases (Manolagas,, 2000), and they may also slightly vary locally or in different bone sites, leading to local inhomogeneities of osteon morphology or BMU cutting cone shape (see Section 4). Not surprisingly, osteon diameter strongly depends on the number of osteoclasts in the cavity: it increases as either or (or both) increases in Figure 4(b). The renewal rate of the osteoclast population for a given number of osteoclasts only marginally affects osteon diameter. However, this renewal rate modifies the roughness of the cavity surface. In Figure 5, we reproduce four snapshots of the lattice from Figure 4, but organise them according to the average number of osteoclasts and osteoclast population renewal rate. The snapshots reproduced correspond to the snapshots of Figure 4 obtained for , and , which both have an average number of osteoclasts but population renewal rates of and , respectively, and the snapshots obtained for , and , which both have an average number of osteoclasts and population renewal rates of and , respectively. A smaller population renewal rate is seen to induce slightly more ragged cavities. Indeed, low renewal rates allow the long-living osteoclasts to resorb for a long time away from the front of the BMU. This leads to budding of resorption cavities (and thus rougher surfaces), particularly as seen in the snapshots of the lattice with in Figure 4.
Our results from Simulation II are consistent with the expectation that the number of osteoclasts in a BMU significantly affects the osteon diameter (Martin et al.,, 1990; van Oers et al., 2008b, ; Britz et al.,, 2009). Our simulations suggest in addition that osteoclast population renewal rate influences the roughness at the osteonal cement line. It would be interesting to compare this prediction of our model with experimental data, but to our knowledge, there are no experimental studies investigating how roughness at the cement line of osteons may vary in various bone diseases or drug treatments targetting osteoclasts.
3.3 Simulation III
The life history of osteoclasts (from their generation to their apoptotic death) is a fundamental feature influencing bone resorption (Parfitt et al.,, 1996; Manolagas,, 2000). The lifespan and/or activity of osteoclasts is believed to be dynamically influenced by the renewal of their nuclei. However, it is not yet experimentally possible to follow the paths of single osteoclasts in vivo, and so where and how osteoclasts are degraded remains unclear (Parfitt et al.,, 1996; Bronckers et al.,, 1996; Boyce et al.,, 2002; Burger et al.,, 2003). To investigate the interplay between osteoclast removal and nuclei renewal, we include in Simulation III the possibility that s renew their nuclei (and thereby increase their lifetime) through fusion with s (Fukushima et al.,, 1991). In Simulation III, all the model features presented in Section 2 now play a significant role, except for extracellular collagen digestion period , which is set to , and for fusion between two s, which is ruled out (see Appendix A).
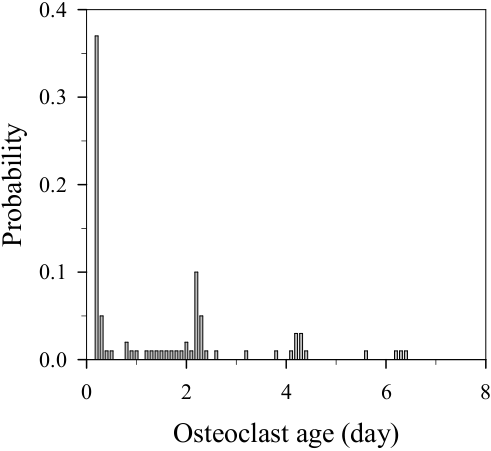
Figure 6 shows the probability distribution of the age reached by osteoclasts in our model before their removal from the BMU, whether by apoptotic death or by fusion into an existing . This probability distribution thus represents the likelihood for a nuclei renewal process to occur in our simulations. In Simulation II, every osteoclast undergoes apoptosis at an age exactly equal to and such a probability distribution is uniquely peaked at . By contrast, in Simulation III the various peaks reflect modification of the lifespans upon nuclei renewal. Any peak before 2 days corresponds to s that are removed by fusion with an existing . Any peak after 2 days corresponds to s whose nuclei have been renewed once or several times. It is seen that the most probable fate of s is to fuse with an existing shortly after their generation, at of age. Due to the observed decay in peak height with age, the probability for an of undergoing a nuclei renewal process decreases with time in our model. This is because long-lived osteoclasts gradually move further away from the location where new s are generated, making fusion less likely (see Section 4 for further discussion).
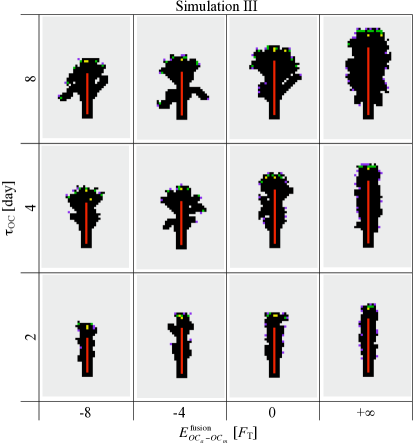
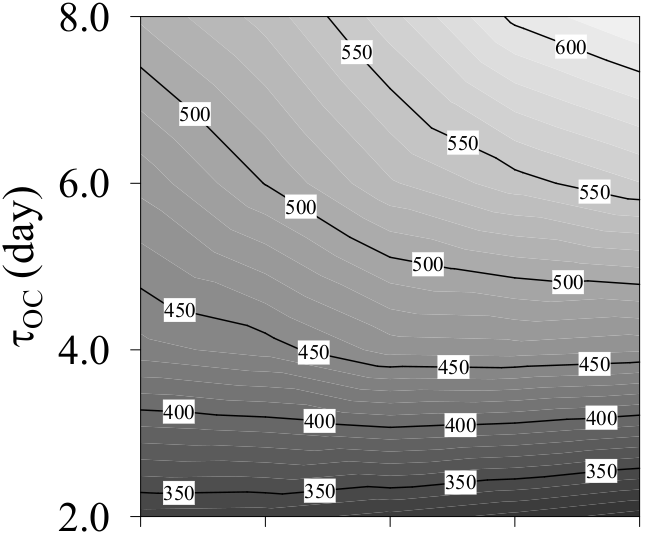
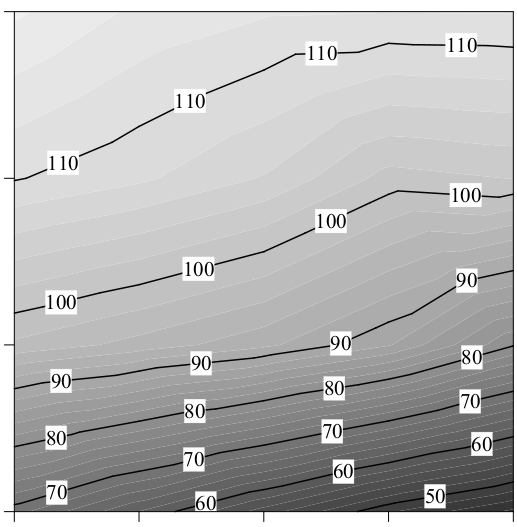
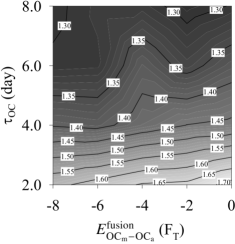
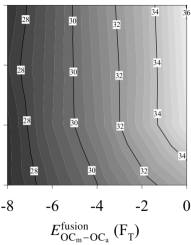
Figure 7 shows that there is a striking difference in osteon morphology and osteon diameter between increasing the lifespan of osteoclasts through (the initial lifespan of s at their birth) or through nuclei renewal. Indeed, while increasing increases the average osteon diameter as in Simulation II (see columns of Figure 7), the strength of fusion affinity () impacts the morphology of the osteon more strongly than its diameter (see rows of Figure 7). This can also be appreciated in Figure 8, where the influence of and on the average osteon diameter, on the cavity surface roughness, on the BMU progression rate, and on the mean resorption rate per osteoclast is shown.222For the calculation of these quantities, the initial rectangular cavity, still visible in the lower part of the snapshots in Figure 7, is discarded.
From the snapshots of the lattice in Figure 7 at constant , nuclei renewal appears to support the emergence of ‘budding branches’ from the main resorption cavity. The osteonal structures in humans and other animals is known to branch and anastomose into a network structure (Cohen and Harris,, 1958; Tappen,, 1977; Stout et al.,, 1999; Moshin et al.,, 2002; Cooper et al.,, 2006). In our simulations, these branches do not progress further as we do not model branching of the central blood vessel, so osteoclasts are not renewed in the buds.
An interesting observation from our simulation results is that the BMU progression rate is a poor indicator of the mean resorption rate per osteoclast (and vice-versa). Comparing Figures 8(c) and (d), one sees that the BMU progression rate is mainly independent of (the initial lifespan of s at their birth) but depends on (the fusion energy), while the reverse is true of the mean resorption rate per osteoclast. These results show that the nuclei renewal process plays an important role in how fast a BMU may resorb a path through bone, indicating that the trajectories of the individual osteoclasts within the resorption cone are influenced by the nuclei renewal process.
| (a) Osteon diameter | (b) Cavity roughness |
 |
 |
| (c) Mean resorption rate/OC | (d) BMU progression rate |
 |
 |
Our results from Simulation III suggest that an increase in lifespan of osteoclasts by nuclei renewal could possibly lead to different typical trajectories of the osteoclasts in the cutting cone of the BMU, and so may influence the occurrence of branching. This nuclei renewal process has, to our knowledge, not been considered in a computational model previously. The systematic study of cavity properties as well as the age probability distribution of the osteoclasts may provide ways to deduce how often nuclei renewal in an osteoclast occurs before it undergoes apoptosis.
4 Discussion
Osteoclast resorption behaviour in cortical BMUs is complex. Histological serial sectioning and microCT technology have revealed branching osteon structures, and have identified the non-uniformity between individual osteons and BMUs (Cohen and Harris,, 1958; Tappen,, 1977; Stout et al.,, 1999; Moshin et al.,, 2002; Cooper et al.,, 2006). Osteons and BMU cutting cones may have different diameters, morphologies, and roughnesses. While these structural features of osteons and BMUs are revealed by these experimental techniques, no information on the underlying cellular processes coordinating osteoclast movement and resorption behaviour is obtained. But it is the behaviour of osteoclasts and their interaction with each other and the bone matrix that create these complex network structures. In this paper, we have developed a novel computational model to gain a deeper understanding about the way osteoclast properties and cell-cell and cell-bone interactions can lead to different structural features of resorption cavities.
We found that osteoclast–bone adhesion has to be strong to prevent osteoclasts from migrating far from the bone surface and that extracellular collagen digestion time () is unlikely to be a rate limiting step in osteoclastic bone resorption. In our model, a critical parameter determining unidirectionality of osteons is the growth direction of the blood vessel.
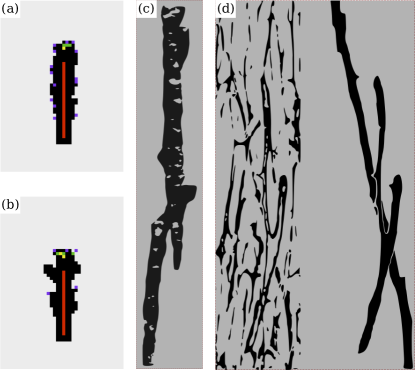
In Figure 9, we compare osteonal shapes obtained from Simulation II and Simulation III with experimental data from Cohen and Harris, (1958) and Cooper et al., (2006). Qualitatively our simulation results resemble the experimentally observed osteonal structures. For a suitable choice of model parameters osteonal diameters are in the range of experimentally observed diameters, i.e. – (Parfitt, 1983a, ; Robling et al.,, 2006). The osteon diameter is found to be strongly dependent on the average number of osteoclasts in the resorption cavity. Furthermore, we found that the osteoclast population renewal rate is related to the roughness of the osteon boundary at the cement line. Looking carefully at Figure 9(c) one can see that the cement line is ragged, reflecting nonuniformity in the osteoclast resorption process, as in Figures 9(a) and (b) for our model. Figure 9(d) clearly shows the complex network stucture of Haversian systems (grey) and a branching secondary osteon (red). The osteoclast nuclei renewal process suggested in our model seems to support the occurrence of branching, as can be seen by comparing Figures 9(a) and (b). Figures 9(a) and (b) are obtained with the same parameter values except that nuclei renewal is taken into account in Figure 9(b). We do not account for branching of the blood vessel, so buds of the cavity do not evolve into progressing branches. Still, osteoclast nuclei renewal is seen to have a distinctive effect on osteonal morphology, which is partly due to osteoclasts living longer but also due to osteoclasts taking different trajectories within the BMU cavity. We now consider osteoclast trajectories within a BMU.
Nuclei renewal in Simulation III occurs through a fusion process, but fusion only takes place if two osteoclasts are found in the same region of space. This mechanism for lifespan extension is thus conditional and local. An osteoclast’s nuclei are more likely to be renewed in the vicinity of the tip of the blood vessel, where new s are generated. But an osteoclast’s nuclei may also be renewed further away from the osteoclast source, in s that would otherwise undergo apoptosis. It can thus be expected that a nuclei renewal mechanism may influence, on average, the typical trajectory of osteoclasts within the BMU cutting cone.
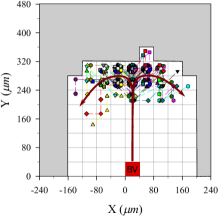
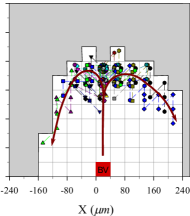
The question of the specific trajectories taken by osteoclasts within a BMU cutting cone has been raised by Burger et al., (2003). Burger et al., (2003) hypothesised that osteoclasts may follow a ‘treadmill’ movement pattern (i.e. following a trajectory from the tip of the blood vessel, where they are formed, to the front of the BMU, where they mature, and down the sides of the cavity). In Figure 10, we show the relative trajectories in the BMU taken by all osteoclasts created during in Simulation II and Simulation III.333We have checked that these trajectories are typical and representative for both Simulation II and Simulation III by running the simulations several times with different ‘random seeds’. These trajectories are shown from the point of view of an observer moving with the tip of the blood vessel, and so represent the trajectories of the osteoclasts within the cutting cone. In Figure 10, each osteoclast is assigned a different symbol and a slight offset within a lattice site to be able to distinguish overlapping paths. In both models, osteoclasts are generated in the middle and progressively move towards the sides of the cavity. Most osteoclasts are found to stay within a layer approximately two lattice sites thick against the cavity wall near the front of the BMU. However, it is seen that the nuclei renewal mechanism introduced in Simulation III modifies the movement pattern of the osteoclasts compared to Simulation II. The increase in lifespan due to nuclei renewal allows osteoclasts to progressively come further towards the back of the BMU in Simulation III, suggestive of the ‘treadmill’ movement pattern referred to by Burger et al., (2003).
| (a) Simulation II | (b) Simulation III |
|---|---|
 |
 |
5 Conclusions
Our novel computational approach has allowed the investigation of resorption within a single BMU. In particular, the study of the movement pattern of osteoclasts in the BMU and the effect of the osteoclasts’ life history on their collective resorption behaviour is a challenge that computational modelling is able to shed some light on. Our model shows the importance of osteoclast–bone adhesion and of the growth of a blood vessel. Our model suggest that the ‘clean-up’ of the resorption site by extracellular components following resorption by an osteoclast is unlikely to be rate limiting. The model is able to generate cavity shapes that closely resemble those observed experimentally, and produces osteoclast trajectories within the BMU that are consistent with a previous hypothesis by Burger et al., (2003). Clearly, our simulations already capture essential features of osteoclast resorption behaviour.
Nevertheless, future models can be improved. For example, representing the three dimensional geometry of the BMU cavity would be expected to lead to more realistic simulations of osteoclast movement within the BMU cavity. In our current model, the growth of the blood vessel influences strongly resorption cavity shape, but it is likely that resorption cavity shape in turn influences the growth of the blood vessel, in a feedback interaction. And finally, the BMU progresses through a stress field in bone matrix, encountering osteocytes and various signalling molecules. Including these features in future models is expected to help explain BMU initiation, the diversity of resorption cavity shapes, changes in direction, branching and BMU termination.
Acknowledgements
The authors would like to thank Colin R. Dunstan for helpful discussions and comments in the preparation of the manuscript, the late Gregory R. Mundy for his insightful discussions, as well as one of the anonymous reviewers for his/her remarks on osteoclast biology. Support by the Australian Research Council in the framework of the project Bone regulation - cell interactions to disease (project number DP0879466, PP), by the National Cancer Institute (grant number U54CA113007, PTC), and by the National Science Foundation (grant number EPS-0919436, PTC) is gratefully acknowledged.
Appendix A Model description
The technical details of the model description outlined in Section 2 are given below.
Lattice composition.
The region around the cutting cone of a cortical BMU is known to be mainly composed of mineralised bone matrix, active osteoclasts, bone precursor cells, a blood vessel, and loose connective tissue stroma filling the space between these components (Parfitt,, 1998; Martin et al.,, 1998). Accordingly, each lattice site of the model carries one of the following: (i) mineralised bone matrix, (ii) an osteoclast, (iii) components of a blood vessel, or (iv) loose connective tissue stroma (see Figure 1). Bone precursor cells are not considered explicitly in the present model, but their effect for osteoclastogenesis is implicitly accounted for by the generation of new osteoclasts near the tip of a blood vessel.
Blood vessel.
The blood vessel (BV) in a cortical BMU provides the local BMU microenvironment with both nutrients and precursor cells (in particular precursor osteoclasts) that are necessary to sustain the remodelling process (Parfitt,, 1998). The blood vessel is assumed in the model to occupy a width of one lattice site and to grow towards the front of the BMU at a maximum rate (in ) provided it has enough cavity space to do so. A minimal vertical distance of 280 (corresponding to 7 lattice sites) between the tip of the blood vessel and the bone surface (Parfitt,, 1998) is always enforced by slowing this rate of growth if necessary.
Maturation and activation of osteoclasts.
The maturation of osteoclasts in a BMU is the result of a cascade of events that take place around the tip of the blood vessel. This cascade of events is known to involve several cell types and molecules (such as pre-osteoblasts, MCSF and RANKL etc., see (Roodman,, 1999; Martin,, 2004)). While these cell types and molecules are not explicitly considered in the present model, we assume that their net effect is to generate new mature osteoclasts at a rate (in units of ) at a distance of about or 6 lattice sites ahead of the tip of the blood vessel.444The exact position at which newly-generated s are placed in the model depends on whether a lattice site is free of other osteoclasts. Specifically, this position is chosen to be in a range of – ahead of the tip of the blood vessel (Parfitt,, 1998), corresponding to 4–6 lattice sites. New s are thus placed at a distance of – (– lattice sites) from the front of the cavity surface. In all the simulations performed, this range always allowed the positioning of new s on osteoclast-free stromal sites, ensuring a constant generation rate at all times. These mature osteoclasts (which we denote by s) are assumed to be fully differentiated: they represent multinucleated cells capable of migrating through the connective tissue stroma and of attaching to the bone surface for its resorption. Mature osteoclasts that are attached to the bone surface and are actively resorbing the bone matrix are referred to as active osteoclasts (which we denote by s). The attachment of an osteoclast to the bone surface and its activation is in reality a complex process that requires several signalling pathways to be activated, in particular the RANK-RANKL pathway (Roodman,, 1999; Martin,, 2004). In our model, it is considered that a mature osteoclast becomes ‘active’ as soon as it is adjacent to or diagonal with a bone lattice site (i.e., as soon as it is in the so-called ‘Moore neighbourhood’ of a bone lattice site, see Figure 11(a)). An active osteoclast is assumed to stay active until all the bone sites in its Moore neighbourhood are resorbed, after which the becomes a migrating again (Fukushima et al.,, 1991).
| (a) Simulation I | (b) Simulation II and III |
|---|---|
 |
 |
Migration behaviour of osteoclasts—evolution rules.
Several mathematical approaches exist in the literature to represent the migration of cells in their microenvironment (Noble,, 1987; Schweitzer,, 2003; Peruani and Morelli,, 2007; Othmer et al.,, 1988). Here, we represent the migration of s through connective tissue stroma as a biased random walk (van Kampen,, 1998; Schweitzer,, 2003; Othmer and Stevens,, 1997). The migration behaviour of an is specified in the model by so-called ‘evolution rules’. The evolution rules determine towards which neighbouring site the will migrate during the next time increment. This site is chosen randomly in the Moore neighbourhood of the with unequal probabilities that depend on the lattice composition in the ’s surroundings. The immediate surroundings of an osteoclast predominantly determine the cell’s migration through the extracellular connective tissue stroma, or the cell’s adhesion to other cells or the bone surface, via a number of local biochemical signals mediated by enzymes, cytokines, cell adhesion molecules etc. However, to an individual cell, these biochemical signals have a fluctuating character. Fluctuations are due to small-scale inhomogeneities in the connective tissue, or to fluctuations in signalling pathways or in biochemical reactions occurring at multiple levels; from the molecular level (e.g. thermal fluctuations) to the cellular level (e.g. membrane fluctuations) to the organism level (e.g. food intake and other exogeneous fluctuations) (Schienbein et al.,, 1994; Mombach and Glazier,, 1996). The probabilistic character of the migration behaviour of the s precisely accounts for such fluctuations in local biochemical signals. The total interaction energy between an located at position on the lattice and entities located in the Moore neighbourhood of the determines the strength of the biases introduced in the random walk.
In (Beysens et al.,, 2000; Drasdo and Hoehme,, 2005; Block et al.,, 2007), the strength of the above-mentioned background of metabolic fluctuations is quantified by the so-called ‘metabolic energy’ . Depending on the strength of the metabolic energy relative to the total interaction energy , the migration behaviour of the is given more or less randomness, much in the same way that thermal energy gives more or less random fluctuations in ‘Brownian motion’ of atoms or molecules at the molecular level. The probability for an at to migrate to its Moore neighbour (Figure 11(a)) is assumed to be given by
| (1) |
where denotes the total energy at the Moore neighbour . The migration scheme (1) is such that the cell is more likely to migrate towards neighbouring lattice sites at which the ’s total energy is minimum. The denominator ensures that . If the metabolic energy is high (), biases in the probabilities are reduced, leading to more erratic migration. If the metabolic energy is low (, biases in the probabilities are accentuated, leading to more persistent migration towards the local minimum of energy.
Schemes similar to Eq. (1) have been previously used for cellular automata in the literature (see, e.g., (Block et al.,, 2007; Ghaemi and Shahrokhi,, 2006)). The scheme (1) essentially differs from the traditional Glauber dynamical scheme and the Metropolis dynamical scheme (Glauber,, 1963) in that the system does not evolve towards equilibrium of the metabolic energy (corresponding to thermal equilibrium if ).555Indeed, the scheme (1) does not satisfy detailed balance of the corresponding Master equation with Boltzmann-like stationary distribution (van Kampen,, 1998). This is not contradictory, as a cortical BMU is a nonequilibrium entity, requiring a continual source of new cells and metabolic energy to maintain itself.
Interaction energies.
The total energy of an at on the lattice is the sum of the interaction energy between the and other osteoclasts, the interaction energy between the and bone, and the interaction energy between the and blood vessel components. We denote these interaction energies by , and , respectively. The subscript indicates the relative position of the entity that the interacts with. The range of these interaction energies is assumed to be restricted to the Moore neighbourhood of the , so represents a Moore neighbour index and the total energy is the sum:
| (2) |
where is equal to if the Moore neighbour is occupied by the entity , and equal to otherwise (). We define , and by
| (3) | ||||
| (4) | ||||
| (5) |
where indexes the Moore neighbours of the . In Eq. 3–5, the energy value at represents an ‘exclusion energy’. If infinite, this exclusion energy corresponds to a so-called ‘hard-core repulsion’. If finite, the may coexist with another entity on the same lattice site. Energy values at determine short-range interaction between the and an entity on a neighbouring site. These energy values determine the adhesion properties of the with its neighbouring entities. Consequently:
-
•
Eq. (3) specifies that if is finite (), an may migrate onto a site previously occupied by another osteoclast, in which case fusion with this existing osteoclast is assumed to take place (see also ‘nuclei renewal’ below). Because is negative, an osteoclast–osteoclast adhesion is assumed;
-
•
Eq. (4) specifies that an cannot occupy the same lattice site as bone. Because is negative, an osteoclast–bone adhesion is assumed;666The assumption that the interaction with an orthogonal site () has the same strength as that with a diagonal site () in Eqs. (3) and (4) implicitly introduces a lattice anisotropy. Such lattice anisotropies are unavoidable in any regular lattice (Markus and Hess,, 1990; Drasdo,, 2005; Nishiyama and Tokihiro,, 2010). Still, the Moore neighbourhood is expected to limit lattice artefacts compared to the von Neumann neighbourhood (Poplawski et al.,, 2007) and it allows in our model to maximise the interaction of an osteoclast with bone sites.
-
•
Eq. (5) specifies that an cannot occupy the same lattice site as blood vessel components, and that an shows no particular preference to adhere to blood vessel components.
The concept of ‘interaction energies’ is a high-level simplification for complex molecular processes, but it allows to integrate the underlying biochemical signals and resultant cell properties into a single concept. In (Beysens et al.,, 2000; Drasdo and Hoehme,, 2005; Block et al.,, 2007), it is estimated that such biochemically-induced interaction energies are typically of the order –. In this paper, all energies are measured in units of the metabolic energy and their physiological range is assumed to be within –.777This narrow range of values restricts the allowable parameter space substantially.
Migration behaviour examples.
We provide two examples of the migration behaviour of an in response to its surrounding. (i) When an ’s microenvironment is composed of connective tissue stroma only, all neighbouring lattice sites have the same total interaction energy and the probability to migrate to any of those sites is equal: the ’s migration resembles a so-called ‘random walk’ (van Kampen,, 1998; Schweitzer,, 2003; Othmer and Stevens,, 1997) and results in an isotropic diffusive motion for the , with an effective diffusion coefficient (see below). (ii) For the situation depicted in Figure 11(a), the located on the lattice site ‘0’ is more likely to migrate to even-numbered sites than to odd-numbered sites. Indeed, on even-numbered sites, the presence of a neighbouring bone site lowers the energy due to a negative osteoclast–bone adhesion energy .
Osteoclast lifespan: nuclei renewal, cell apoptosis.
In our model, s that are newly generated near the tip of the blood vessel are initially assigned a fixed lifespan . To account for a lifespan-increasing nuclei renewal process in our simulations, we consider that migrating s can fuse with existing s or s with different probabilities and , respectively (see Eq. (3)). The lifespan of the osteoclast resulting from this fusion is increased by the remaining lifetime of the fusing , and the latter is removed from the system. This fusion process is assumed to refresh at once the nuclei of the resulting osteoclast. The resulting osteoclast is not assumed to grow any bigger as a result of nuclei fusion. It is implicitly assumed that older nuclei of the cell are degraded and removed when new nuclei are added. This fusion algorithm between two multinucleated cells can be interpreted to represent multiple fusions by mononuclear cells jointly with individual nuclei degradation.
Depending on whether the fusion energy is greater or lesser than the adhesion energy , fusion or adhesion is preferentially selected by the stochastic scheme (1)–(3). According to the observations by Fukushima et al., (1991), we assume that an and an should preferentially fuse, while two s should preferentially not fuse. We thus consider that
| (6) |
and take (no fusion between two s). Note that when an has several nearby osteoclasts that it could fuse with, the algorithm selects preferentially the ones that are active and next to the maximum number of bone sites. In case of osteoclasts with identical properties, the probability to fuse with any one of them is equal.
When the age of an osteoclast reaches its alloted lifespan (whether that lifespan has been increased by nuclei renewal or not), the cell is assumed to undergo apoptosis irrespective from its activity state (migrating or resorbing) and it is removed from the system. We assume that the renewal of an osteoclast’s nuclei does not influence that osteoclast’s activity state (Miller,, 1981; Fukushima et al.,, 1991).
Bone matrix dissolution.
An resorbs a single neighbouring bone site at a time, in such a way that the density of this bone site decreases exponentially with time:
| (7) |
where denotes the relative bone density (normalised by fully-mineralised bone density) and is the dissolution rate. The kinetic law (7) for dissolution, which prescribes a rate of bone density loss proportional to bone density, is motivated by chemical bone dissolution kinetics, where the efficiency of the dissolution changes with the mineral component composition and density (Boyde and Jones,, 1991; Grynpas and Cheng,, 1988; Huang et al.,, 2006). Bone matrix with density lower than a critical bone density value is assumed to become a cavity site filled with connective tissue stroma.
To account for a possible rate-limiting extracellular collagen digestion, we introduce in our model a hypothetical inhibition period during which a newly exposed bone surface (due to resorption) is inaccessible to s. This is achieved within the scheme (1) by tagging newly-resorbed sites momentarily (before they become stromal sites) as “quiescent” bone sites: an in the proximity of such a site is prevented to migrate through it and is prevented to become activated into an , unless other bone sites are in the ’s neighbourhood.
Initial conditions and simulation parameters.
The initial lattice configurations used in Simulation I, Simulation II and Simulation III are shown in Figure 11. The evolution of the system is simulated for 30 days with time increments of . At each time increment, all osteoclasts are selected in random order and an update of their state and position is performed according to the flow chart in Figure 2 (i.e., asynchronous update). The dissolution of bone sites by the s is implemented in this selected order too. The possible growth of the blood vessel as well as the generation of new s is performed last.
Finally, it is noted that the time increment cannot be chosen arbitrarily. Indeed, and the lattice step size determine the diffusion coefficient for the pure random walk (in stromal tissue only) of the s. With the Moore neighbourhood, one has .888For random walks in two dimensions, the mean square displacement is , where is the diffusion coefficient. This mean square displacement can also be formulated as the product of the mean number of time steps required to observe a jump with nonzero length and the mean square displacement during such a jump. Considering that the 2D Moore neighbourhood includes the possibility of resting, jumps of nonzero length only occur of the time, so . The average length of a jump with nonzero length is . Thus, .
In Table 1 we list all the parameters of the model along with the range of values investigated in Section 3, and a so-called ‘default’ value, which is assigned unless that parameter is explicitly varied. These ranges of values implicitly exclude regions of the parameter space that were either not physiological, or that were leading to physiologically unrealistic results (e.g. an abnormally-large resorption cavity or a too slow BMU progression rate). Default values are shown in bold, and do lead to realistic resorption cavity geometries (see Section 4).
| Parameters | Description | Values (default) |
|---|---|---|
| lattice step size | ||
| diffusion coefficient of an osteoclast (pure random walk) | ||
| osteoclast–osteoclast adhesion energy | () | |
| osteoclast–bone adhesion energy | () | |
| fusion energy between a mature osteoclast and an active osteoclast | () | |
| fusion energy between mature osteoclasts | ||
| initial relative bone density at all bone sites | ||
| critical relative bone density under which a bone site is removed | ||
| dissolution rate of relative bone density by active osteoclasts | ||
| initial lifespan of osteoclasts | ||
| generation rate of osteoclasts by the blood vessel | ||
| maximum rate of growth of the blood vessel | ||
| period of inhibition of further resorption at a newly-resorbed bone site |
References
- Anderson et al., (2006) Anderson, A. R. A., Weaver, A. M., Cummings, P. T., and Quaranta, V. (2006). Tumor morphology and phenotypic evolution driven by selective pressure from the microenvironment. Cell, 127:905–915.
- Baron et al., (1993) Baron, R., Chakraborty, M., Chatterjee, D., Home, W., Lomri, A., and Ravesloot, J. H. (1993). Biology of the osteoclast. Handbook Exp. Pharmacol., 107:111–147.
- Beysens et al., (2000) Beysens, D., Forgacs, G., and Glazier, J. A. (2000). Cell sorting is analogous to phase ordering in fluids. Proc. Natl. Acad. Sci. USA, 97:9467–9471.
- Block et al., (2007) Block, M., Schöll, E., and Drasdo, D. (2007). Classifying the expansion kinetics and critical surface dynamics of growing cell populations. Phys. Rev. Lett., 99:248101.
- Boyce et al., (2002) Boyce, B. F., Xing, L., Jilka, R. L., Bellido, T., Weinstein, R. S., Parfitt, A. M., and Manolagas, S. C. (2002). Apoptosis in bone cells. In Bilezikian, J. P., Raisz, L. G., and Rodan, G. A., editors, Principles of bone biology, volume 1, pages 151–168. Academic Press, San Diego, 2 edition.
- Boyde and Jones, (1991) Boyde, A. and Jones, r. J. (1991). Pitfalls in pit measurements. Calcif. Tissue Int., 49:65–70.
- Britz et al., (2009) Britz, H. M., Thomas, C. D. L., G., C. J., and L., C. D. M. (2009). The relation of femoral osteon geometry to age, sex, height and weight. Bone, 45:77–83.
- Bronckers et al., (1996) Bronckers, A. L. J. J., Goel, W., Luo, G., Karsenty, G., D’Souza, R. N., Lyaruu, D. M., and Burger, E. H. (1996). DNA fragmentation during bone formation in neonatal rodents assessed by transferase-mediated end labelling. J. Bone Miner. Res., 11:1281–91.
- Buenzli et al., (2011) Buenzli, P. R., Pivonka, P., and Smith, D. W. (2011). Spatio-temporal dynamics of cell distribution in Bone Multicellular Units. Bone, 48:918–926. doi:10.1016/j.bone.2010.12.009.
- Burger et al., (2003) Burger, E. H., Klein-Nulend, J., and Smit, T. H. (2003). Strain-derived canalicular fluid flow regulates osteoclast activity in a remodelling osteon - a proposal. Journal of Biomechanics, 36(10):1453–1459.
- Chambers et al., (1985) Chambers, T. J., Darby, J. A., and Fuller, K. (1985). Mammalian collagenase predisposes bone surfaces to osteoclastic resorption. Cell Tissue Res., 241:671–675.
- Civitelli et al., (2008) Civitelli, R., Stains, J. P., Shin, C. S., and orgensen, J. (2008). Intercellular junctions and cell-cell communication in the skeletal system. In Bilezikian, J. P., Raisz, L. G., and Martin, T. J., editors, Principles of bone biology, volume 1, pages 425–445. Academic Press, San Diego, 3 edition.
- Cohen and Harris, (1958) Cohen, J. and Harris, W. H. (1958). The three-dimensional anatomy of Haversian systems. J Bone Joint Surg Am, 40(2):419–434.
- Cooper et al., (2006) Cooper, D. M., Thomas, C. D. L., Clement, J. G., and Hallgrimsson, B. (2006). Three-dimensional microcomputed tomography imaging of basic multicellular unit-related resorption spaces in human cortical bone. The Anatomical Record Part A: Discoveries in Molecular, Cellular, and Evolutionary Biology, 288A(7):806–816.
- Drasdo, (2005) Drasdo, D. (2005). Coarse-graining in simulated cell populations. Advances in Complex Systems, 8:319–363.
- Drasdo and Hoehme, (2005) Drasdo, D. and Hoehme, S. (2005). A single-cell-based model of tumor growth in vitro: monolayers and spheroids. Phys. Biol., 2:133–147.
- Everts et al., (2002) Everts, V., Delaissé, J. M., Korper, W., Jansen, D. C., Tigchelaar-Gutter, W., Saftig, P., and Beertsen, W. (2002). The bone lining cell: its role in cleaning Howship’s lacunae and initiating bone formation. J. Bone Miner. Res., 17:77–90.
- Frost, (1969) Frost, H. M. (1969). Tetracycline-based histological analysis of bone remodeling. Calcif. Tissue Res., 3:211–237.
- Frost, (1983) Frost, H. M. (1983). The skeletal intermediary organization. Metab. Bone Dis. Rel. Res., 4:281–290.
- Fukushima et al., (1991) Fukushima, O., Bekker, P. J., and Gay, C. V. (1991). Characterization of the functional stages of osteoclast by enzyme histochemistry and electron microscopy. Anat. Rec., 231:298–315.
- García-Aznar et al., (2005) García-Aznar, J. M., Rueberg, T., and Doblaré, M. (2005). A bone remodelling model coupling microdamage growth and repair by 3D BMU-activity. Biomech. Model Mechanobiol., 4:147–167.
- Gerlee and Anderson, (2007) Gerlee, P. and Anderson, A. R. A. (2007). An evolutionary hybrid cellular automaton model of solid tumour growth. J. Theor. Biol., 246:583–603.
- Ghaemi and Shahrokhi, (2006) Ghaemi, M. and Shahrokhi, A. (2006). Combination of the cellular Potts model and lattice gas cellular automata for simulating the avascular cancer growth. In El Yacoubi, S., Chopard, B., and S., B., editors, Lecture Notes in Computer Science, volume 4173, pages 297–303. Springer. Proceedings of the 7th International Conference on Cellular Automata for Research and Industry (ACRI).
- Glauber, (1963) Glauber, R. J. (1963). Time-dependent statistics of the Ising model. Journal of Mathematical Physics, 4(2):294–307.
- Glazier and Graner, (1993) Glazier, J. A. and Graner, F. (1993). Simulation of the differential adhesion driven rearrangement of biological cells. Phys. Rev. E, 47:2128–2154.
- Grynpas and Cheng, (1988) Grynpas, M. D. and Cheng, P.-T. (1988). Fluoride reduces the rate of dissolution of bone. Bone and Mineral, 5:1–9.
- Hall, (1991) Hall, B. K., editor (1991). Bone, volume 2: The osteoclast. CRC Press.
- Helfrich et al., (2008) Helfrich, M. H., Stenbeck, G., Nesbitt, S. A., and Horton, M. A. (2008). Integrins and other cell surface attachment molecules of bone cells. In Bilezikian, J. P., Raisz, L. G., and Martin, T. J., editors, Principles of bone biology, volume 1, pages 385–424. Academic Press, San Diego, 3 edition.
- Huang et al., (2006) Huang, J., Zhang, T.-L., Xu, S.-J., Li, R.-C., Wang, K., Zhang, J., and Xie, Y.-N. (2006). Effects of Lanthanum on composition, crystal size, and lattice structure of femur bone mineral of wistar rats. Cacif. Tissue Int., 78:241–247.
- Jaworski et al., (1981) Jaworski, Z. F. G., Duck, B., and Sekaly, G. (1981). Kinetics of osteoclasts and their nuclei in evolving seconday Haversian systems. J. Anat., 133:397–405.
- Jeon et al., (2010) Jeon, J., Quaranta, V., and Cummings, P. T. (2010). An off-lattice hybrid discrete-continuum model of tumor growth and invasion. Biophys. J., 98:37–47.
- Manolagas, (2000) Manolagas, S. C. (2000). Birth and death of bone cells: basic regulatory mechanisms and implications for the pathogenesis and treatment of osteoporosis. Endocr. Rev., 21:115–137.
- Mansury et al., (2002) Mansury, Y., Kimura, M., Lobo, J., and Deisboeck, T. S. (2002). Emerging patterns in tumor systems: Simulating the dynamics of multicellular clusters with an agent-based spatial agglomeration model. J. Theor. Biol, 219:343–370.
- Markus and Hess, (1990) Markus, M. and Hess, B. (1990). Isotropic cellular automaton for modelling excitable media. Nature, 347:56–58.
- Martin, (1994) Martin, R. B. (1994). On the histologic measurement of osteonal BMU activation frequency. Bone, 15:547–549.
- Martin et al., (1998) Martin, R. B., Burr, D. B., and Sharkey, N. A. (1998). Skeletal Tissue Mechanics. New York, Springer.
- Martin et al., (1990) Martin, R. B., Pickett, J. C., and Zinaich, S. (1990). Studies of skeletal remodeling in aging men. Clin. Orthop. Relat. Res., 149:268–282.
- Martin, (2002) Martin, T. J. (2002). Some light shines on the resorption cavity. IBMS BoneKEy, doi:10.1138/2002025.
- Martin, (2004) Martin, T. J. (2004). Paracrine regulation of osteoclast formation and activity: milestones in discovery. J. Musculoskel. Neuron. Ineract., 4:243–53.
- Matsuoka et al., (1998) Matsuoka, H., Nakamura, T., Takadama, H., Yamada, S., Tamura, J., Okada, Y., Oka, M., and Kokubo, T. (1998). Osteoclastic resorption of bone-like apatite formed on a plastic disk as an in vitro assay system. J. Biomed. Mat. Res., 42:278–285.
- Miller, (1981) Miller, S. C. (1981). Osteoclast cell-surface specializations and nuclear kinetics during egg-laying in Japanese quail. Am. J. Anat., 162:35–43.
- Mombach and Glazier, (1996) Mombach, J. C. M. and Glazier, J. A. (1996). Single cell motion in aggregates of embryonic cells. Phys. Rev. Lett., 76:3032–3035.
- Moshin et al., (2002) Moshin, S., Taylor, D., and Lee, L. C. (2002). Three-dimensional reconstruction of Haversianc systems in ovine compact bone. European J. Morphology, 40:309–315.
- Nishiyama and Tokihiro, (2010) Nishiyama, A. and Tokihiro, T. (2010). Construction of an isotropic cellular automaton for a reaction-diffusion equation by means of a random walk. Preprint online: arXiv:1001.0505.
- Noble, (1987) Noble, P. B. (1987). Extracellular matrix and cell migration: locomotory characteristics of MOS-11 cells within a three-dimensional hydrated collagen lattice. J. Cell Science, 87:241–248.
- Othmer et al., (1988) Othmer, H. G., Dunbar, S. R., and Alt, W. (1988). Models of dispersal in biological systems. J. Math. Biol., 26:263–298.
- Othmer and Stevens, (1997) Othmer, H. G. and Stevens, A. (1997). Aggregation, blowup, and collapse: The ABC’s of taxis in reinforced random walks. SIAM J. Appl. Math., 57:1044–1081.
- Parfitt, (1979) Parfitt, A. M. (1979). Quantum concept of bone remodeling and turnover: implications for the pathogenesis of osteoporosis. J. Cell. Biochem., 28:1–5.
- Parfitt, (1994) Parfitt, A. M. (1994). Osteonal and hemi-osteonal remodeling: The spatial and temporal framework for signal traffic in adult human bone. J. Cell. Biochem., 55:273–286.
- Parfitt, (1998) Parfitt, A. M. (1998). Osteoclast precursors as leukocytes: Importance of the area code. Bone, 23:491–494.
- Parfitt et al., (1996) Parfitt, A. M., Mundy, G. R., Roodman, D., Hughes, D. E., and Boyce, B. F. (1996). A new model for the regulation of bone resorption with particular reference to the effects of bisphosphonates. J. Bone Miner. Res., 11:150–159.
- (52) Parfitt, M. A. (1983a). The physiological and clinical significance of bone histomorphometric data. In Recker, R. R., editor, Bone histomorphometry: Techniques and interpretation, pages 143–223. CRC Press, Boca Raton.
- (53) Parfitt, M. A. (1983b). Stereologic basis of bone histomorphometry: Theory of quantitative microscopy and reconstruction of the third dimension. In Recker, R. R., editor, Bone histomorphometry: Techniques and interpretation, pages 53–87. CRC Press, Boca Raton.
- Parfitt et al., (1987) Parfitt, M. A., Drezner, M. K., Glorieux, F. H., Kanis, J. A., Malluche, H., Meunier, P. J., Ott, S. J., and Recker, R. R. (1987). Bone histomorphometry: Standardization of nomenclature, symbols and units: Report of the ABMR histomorphometry nomenclature committee. J. Bone Miner. Res., 2:595–610.
- Peruani and Morelli, (2007) Peruani, F. and Morelli, L. G. (2007). Self-propelled particles with fluctuating speed and direction of motion in two dimensions. Phys. Rev. Lett., 99:010603.
- Poplawski et al., (2007) Poplawski, N. J., Swat, M., Gens, J. S., and Glazier, J. A. (2007). Adhesion between cells, diffusion of growth factors, and elasticity of the AER produce the paddle shape of the chick limb. Physica A-Statistical Mechanics and its Applications, 373:521–532.
- Robling et al., (2006) Robling, A. G., Castillo, A. B., and Turner, C. H. (2006). Biomechanical and molecular regulation of bone remodeling. Annu. Rev. Biomed. Eng., 8:455–498.
- Roodman, (1999) Roodman, G. D. (1999). Cell biology of the osteoclast. Exp. Hematol., 27:1229–41.
- Ryser et al., (2009) Ryser, M. D., Nigma, N., and Komarova, S. V. (2009). Mathematical modeling of spatio-temporal dynamics of a single Bone Multicellular Unit. J. Bone Miner. Res., 24:860–870.
- Schienbein et al., (1994) Schienbein, M., Franke, K., and Gruler, H. (1994). Random walk and directed movement: comparison between inert particles and self-organized molecular machines. Phys. Rev. E, 49:5462–5471.
- Schilling et al., (2006) Schilling, A. F., Filke, S., Brink, S., Korbmacher, H., Amling, M., and Rueger, J. M. (2006). Osteoclasts and biomaterials. Europ. J. Trauma, 32:107–113.
- Schweitzer, (2003) Schweitzer, F. (2003). Brownian agents and active particles. Springer.
- Stout et al., (1999) Stout, S. D., Brunsden, B. S., Hildebolt, C. F., Commean, P. K., Smith, K. E., and Tappen, N. C. (1999). Computer-assisted 3D reconstruction of serial sections of cortical bone to determine the 3D structure of osteons. Calcif. Tissue Int., 65:280–284.
- Susa et al., (2004) Susa, M., Luong-Nguyen, N.-H., Cappellen, D., Zamurovic, N., and Gamse, R. (2004). Human primary osteoclasts: in vitro generation and applications as pharmacological and clinical assay. J. Transl. Med., 2:6. doi:10.1186/1479-5876-2-6.
- Tappen, (1977) Tappen, N. C. (1977). Three-dimensional studies of resorption spaces and developing osteons. Am. J. Anat., 149:301–332.
- Väänänen and Zhao, (2008) Väänänen, H. K. and Zhao, H. (2008). Osteoclast function: biology and mechanisms. In Bilezikian, J. P., Raisz, L. G., and Martin, T. J., editors, Principles of bone biology, volume 1, pages 193–209. Academic Press, San Diego, 3 edition.
- van Kampen, (1998) van Kampen, N. G. (1998). Stochastic processes in Physics and Chemistry. Elsevier, Amsterdam, 3 edition.
- (68) van Oers, R. F. M., Ruimerman, R., Tanck, E., Hilbers, P. A. J., and Huiskes, R. (2008a). A unified theory for osteonal and hemi-osteonal remodeling. Bone, 42(2):250–259.
- (69) van Oers, R. F. M., Ruimerman, R., van Rietbergen, B., , Hilbers, P. A. J., and Huiskes, R. (2008b). Relating osteon diameter to strain. Bone, 43:476–482.
- Walker et al., (2004) Walker, D. C., Southgate, J., Hill, G., Holcombe, M., Hose, D. R., Wood, S. M., Mac Neil, S., and Smallwood, R. H. (2004). The epitheliome: agent-based modelling of the social behaviour of cells. Biosystems, 76:89–100.
- Zhang et al., (2009) Zhang, L., Wang, Z., Sagotsky, J. A., and Deisboeck, T. S. (2009). Multiscale agent-based cancer modeling. J. Math. Biol., 58:545–559.