Streamer Wave Events Observed in Solar Cycle 23
Abstract
In this paper we conduct a data survey searching for well-defined streamer wave events observed by the Large Angle and Spectrometric Coronagraph (LASCO) on-board the Solar and Heliospheric Observatory (SOHO) throughout Solar Cycle 23. As a result, 8 candidate events are found and presented here. We compare different events and find that in most of them the driving CMEs ejecta are characterized by a high speed and a wide angular span, and the CME-streamer interactions occur generally along the flank of the streamer structure at an altitude no higher than the bottom of the field of view of LASCO C2. In addition, all front-side CMEs have accompanying flares. These common observational features shed light on the excitation conditions of streamer wave events.
We also conduct a further analysis on one specific streamer wave event on 5 June 2003. The heliocentric distances of 4 wave troughs/crests at various exposure times are determined; they are then used to deduce the wave properties like period, wavelength, and phase speeds. It is found that both the period and wavelength increase gradually with the wave propagation along the streamer plasma sheet, and the phase speed of the preceding wave is generally faster than that of the trailing ones. The associated coronal seismological study yields the radial profiles of the Alfvén speed and magnetic field strength in the region surrounding the streamer plasma sheet. Both quantities show a general declining trend with time. This is interpreted as an observational manifestation of the recovering process of the CME-disturbed corona. It is also found that the Alfvénic critical point is at about 10 R⊙ where the flow speed, which equals the Alfvén speed, is 200 km s-1.
keywords:
Coronal Seismology; Waves, Propagation; Magnetic fields, Corona; Coronal Mass Ejections1 Introduction
S-Introduction Streamer waves can be excited by the interaction of a rapidly moving and expanding CME ejecta with a nearby streamer structure, representing one of the largest wave phenomena ever observed in the solar corona (Chen et al., 2010, Paper \@slowromancapi@). We interpret the waves as the fast kink body mode (Edwin and Roberts, 1982) carried by and propagating outwards along the streamer plasma sheet structure in the wake of the CME-caused streamer deflections (e.g., Hundhausen, Holzer, and Low, 1987; Sheeley, Hakala, and Wang, 2000; Tripathi and Raouafi, 2007; Filippov and Srivastava, 2010). Using the LASCO coronagraph data, Paper \@slowromancapi@ obtains the wave properties like the period, wavelength, and propagation phase speed for the streamer wave event on 6 July 2004. In the follow-up study by Chen et al. (2011, Paper \@slowromancapii@), a coronal seismological method was developed to diagnose the values of the Alfvén speed and magnetic field strength in the region surrounding the plasma sheet structure, with the assumption that the streamer wave is the fast kink mode propagating along the plasma sheet. Interesting results concerning the temporal evolution of the physical conditions of the CME-disturbed corona are found. However, only one specific streamer wave event which started on 6 July 2004 was investigated in these studies.
This gives rise to natural questions asking about how many other similar events exist and, if they do, how the waves get excited and how their properties compare with the well-studied 2004 event. To address these questions, a complete data survey of LASCO observations during Solar Cycle 23 was conducted. It was found that in only about 8 cases there exist well-defined wavy motions along the streamer stalk among innumerable CME-streamer interaction events. Therefore, it is apparent that the generation of streamer waves requires certain strict excitation conditions to be satisfied. The conditions may relate to the large-scale coronal magnetic field topology, CME dynamics and morphological evolution, and physical details of the CME impact on the streamer structure. One main purpose of this paper is to provide more clues on the wave excitation conditions by studying the 8 candidate streamer wave events observed in Solar Cycle 23 and collecting common observational features of these events.
The paper is organized as follows. In Section 2, we first present observations of the 8 events and discuss the physical factors that may play a role in the wave formation. In Section 3, we conduct further detailed investigations on a specific event on 5 June 2003 to deduce the evolution of the wavelength, period, and propagation phase speed, we also present a coronal seismological study to diagnose the distribution of the Alfvén speed and magnetic field strength in the plasma sheet region. A summary is provided in the final section of this paper.
2 Candidate streamer wave events observed in Solar Cycle 23
S-general CDAW (Coordinated Data Analysis Workshops) data center provides a detailed catalog of the CME events observed by LASCO (Gopalswamy et al., 2009), including the associated white light and running difference images (RDIs) as well as some deduced physical parameters. Our data survey focusing on the streamer wave events was conducted taking advantage of the information gathered by the data center. All CME events in the CDAW data base during Solar Cycle 23 were viewed to find those in which the streamer stalk presented snakelike wavy motions after being hit by a nearby CME. The RDIs were further examined to confirm the presence of one to a few pairs of bright-dark and dark-bright (BD-DB) patches along the streamer stalk, which could be a manifestation of the wavy motions. Eight candidate streamer wave events, including the event on 6 July 2004, studied previously, were found. In the following text, the events will be named after the date on which the associated CME is first observed. For example, the just-mentioned event will be called the 20040706 event. Some relevant physical parameters of the CMEs are presented in the first to sixth columns of Table 1, including the appearance time (UT) of the CME ejecta in the C2 field of view (FOV), the CME type, the central position angle (CPA), the linear speed, the class of the accompanying flares according to the X-ray flux recorded by the GOES satellite. The last column of Table 1 gives the CPA of the associated streamer structure measured at 5 R⊙. In 3 events, it is difficult to rule out the possibility of the wavy motions being humps pushed by the CME trailing material or magnetic structures adjacent to the streamer. That is to say in these events it is possible that both processes, including the action of the magnetic restoring force as a result of the streamer deflection and the direct interaction with nearby structures trailing the CME, may play a role in forming the streamer wavy motions. The 3 events have been indicated by the symbol “” after the observation dates given in the first column.
From the table, we see that most events take place in 2003 and 2004, years of high level of solar activity, and few events occur in the rising or declining phase of solar activity. This is easy to understand since statistically CMEs and streamers interact much more frequently and energetically during times of higher than lower solar activity. We also find that there are 6 halo CMEs, in all except one event the apparent angular widths exceed 100∘, and the average width is about 290∘. The lowest linear speed is 964 km s-1 for the 20030527 event and for all the other events it is larger than 1000 km s-1 with the largest speed being 2861 km s-1 for the 20050115 event, and the average speed being 1580 km s-1. In addition, accompanying flares are observed for the four front-side events. The flare class varies from C8.8 to X3.6. The other four events, indicated by the symbol “”, are mostly back-side events according to EIT observations (Delaboudinière et al., 1995). Considering that all front-side events have accompanying flares, it is highly possible that this may also be the case for the back-side CMEs. In the following section, we will continue to describe some of these observational features and discuss their relevance to the excitation conditions of streamer waves.
2.1 Individual events
Among the candidate streamer wave events listed in Table 1, events 20040705 and 20040706 have been already reported with the latter carefully studied in Paper \@slowromancapi@ and \@slowromancapii@. In the following text, we will first present a brief introduction to these two events, and then describe relevant observations of the other events in the order of their occurrence.
2.1.1 Events 20040706 and 20040705
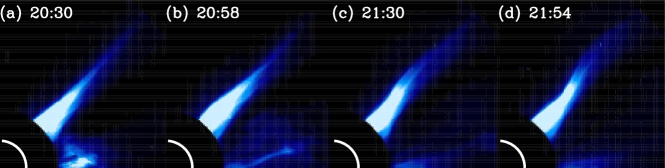
According to Table 1, the 20040706 event results from the interaction between a fast brightness-asymmetric (BA) halo CME with a linear speed of 1307 km s-1 and a streamer structure with a CPA of 225∘ as measured at 5 R⊙. The interaction starts at about 20:30 UT as recorded by C2, causing an obvious deflection of the streamer structure away from its original position. The deflection is seen at the bottom of the C2 FOV indicating that the interaction takes place at an even lower height. At 20:58 UT, the CME ejecta already left the C2 FOV, and the streamer starts to move backwards. In Paper \@slowromancapi@, it was suggested that the wavy motion is controlled by the magnetic restoring force given by the deflection of the streamer structure. The wavy motion is indicated by the BD-DB pairs observed in the RDIs. The presence of these difference structures facilitates greatly the extraction of the wave profiles and further quantitative measurements of the heliocentric distances of selected wave phases, which are given by subsequent wave crests and troughs observable in the event.
The distances of 5 phases, marked as P1 to P5, are measured for event 20040706 in Paper \@slowromancapi@. In other words, about two wavelengths of the streamer wave are observable in the event, with the distance between P1 to P3 representing the first wavelength and P3 to P5 the second one. The wavelength is about 2 - 3 R⊙, and the period is about 1 hour. It is interesting to find that both parameters increase with the outward propagation of the wave. More quantitative results and discussions will be presented in Section 3 together with that for event 20030605, to facilitate the comparison between events. Studies in Paper \@slowromancapi@ also examined the magnetic field topology given by the extrapolation of the measured photospheric magnetic field with the Potential Field Source Surface (PFSS) model (Schatten, Wilcox, and Ness, 1969; Schrijver and De Rosa, 2003). It was concluded that the CME source lies at the flank of the closed loop systems corresponding to the streamer. Such geometry makes it possible that the expanding CME ejecta hits the streamer from the flank, which has been considered as a physical condition favoring the formation of streamer wave.
The other event 20040705 results from the interaction between the same streamer structure and a previous fast halo CME. The CME, taking place, 23 hours before, possibly originates from the same source region and has a linear speed of 1444 km s-1. The RDIs of this event have been shown in Paper \@slowromancapi@ and will not be presented here. The morphological evolution of the two events look similar. However, from the RDIs we find that there exist loop-like trailing eruptive structures moving together with the streamer kinks. This makes it difficult for us to rule out the possibility that the wavy motions are streamer humps pushed by the nearby CME structures. In the following, we shall discuss relevant observations of the other events listed in Table 1. For each event, we will pick out several white light images obtained by C2 to illustrate the CME-streamer interaction process and the morphology of the streamer wavy motion. For some events, we will also show several RDIs for better visualizations of the motion.
2.1.2 Event 20010420
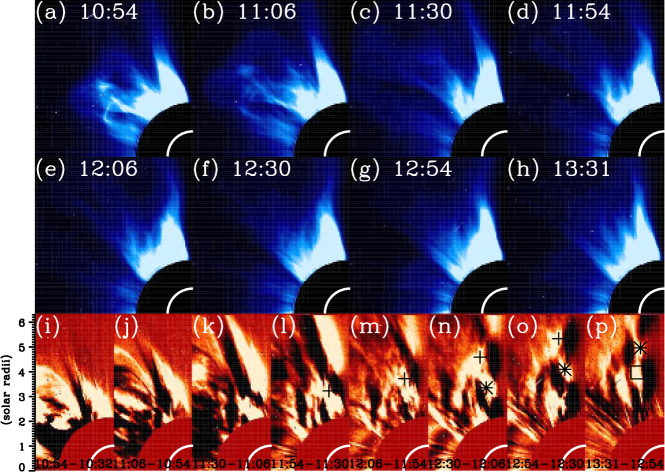
The CME ejecta appears in the C2 FOV at 10:06 UT with a CPA of 65∘, an angular width of 127∘, and a linear speed of 1160 km s-1. The CME hits a nearby streamer structure with a CPA of about 15∘. From the first two white light images of Figure 1, we observe the deviation of the streamer structure away from its previous position. This results in the left (east)-dark and right (west)-bright feature appearing at the bottom of the first RDI. At 11:30 UT, we see that the CME front has left the C2 FOV; till 13:31 UT, the streamer stalk presents a wave-like motion. The wavy motion can be easily related to the BD-DB pairs in the RDIs of the corresponding intervals. It should be noted that trailing material continues to flow outwards even after the CME left, as seen from the corresponding white light and difference images. The motion of this material produces the complex difference structures below the CME ejecta. Some of them are rather close to the streamer structure, and thus may get mixed up with the bright-dark pairs associated with the streamer wavy motion, which makes our judgement of the driving mechanisms of the wavy motions nontrivial. However, with a careful examination of the white light images, we prefer the explanation that the motions are driven by the streamer inherent magnetic restoring force, as an aftermath of the streamer deflection caused by the CME.
Examining the RDIs, we find that a left-bright and right-dark feature start to emerge from the bottom of the C2 FOV between 10:54 and 11:06 UT. This color pattern is distinct from what emerged earlier in association with the CME-streamer deflection, indicating that the streamer starts to swing backwards (eastwards), probably under the action of the magnetic restoring force. From the 11:06 - 11:54 UT RDIs shown in Figures 1k and 1l, we see that the streamer starts to move westwards again. In the meantime, the left-bright and right-dark feature observed in Figure 1j already moves upwards to the location marked by the plus sign, which gives the first wave crest of the streamer wave. During the interval of 12:06 - 12:30 UT, we observe again the eastward motion of the streamer structure. Therefore, the streamer structure completes one period of the wavy motion from 11:06 UT to 12:30 UT. The period is thus estimated to be about 1 - 1.5 hours. In the last three RDIs, the locations of the following wave trough and crest are marked by the stars and squares. It is roughly estimated that the wavelength of the streamer wave is about 2 - 3 R⊙ and the phase speed is about 300 - 400 km s-1.
2.1.3 Event 20030527
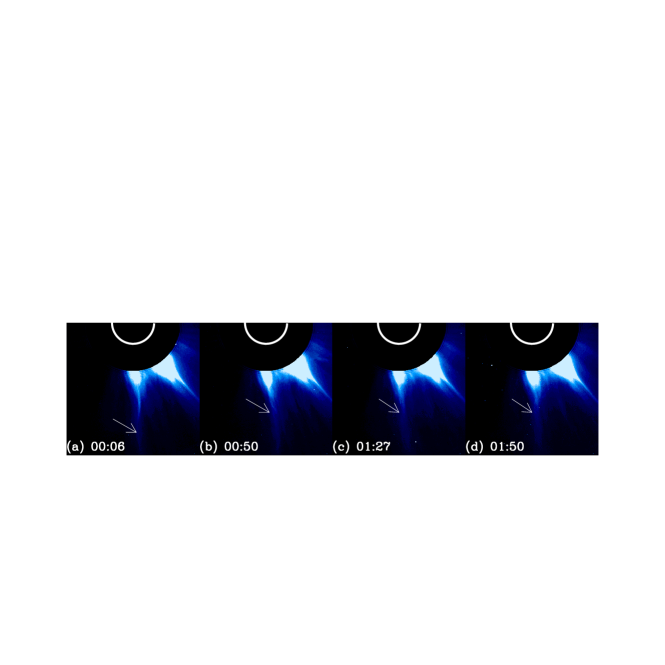
At 23:50 UT on May 27, LASCO recorded a halo CME with a linear speed of 964 km s-1 accompanied by an X1.5 solar flare. At 00:06 UT on the following day, another BA halo CME with a linear speed of 1366 km s-1 accompanied by an X3.6 flare is observed. According to the corresponding EIT data, we find that both CMEs probably originate from the same active region. During the eruptions, both CMEs trigger wavy motions of a nearby streamer with a CPA being about 185∘, as shown in Figure 2. The most interesting observational feature seen from this figure is that the streamer exhibits a waving and tangling morphology from 00:50 to 01:50 UT. Possible reasons accounting for the tangling morphology can be deduced by examining the Wilcox Solar Observatory Source Surface Synoptic Charts (http://wso.stanford.edu/synsourcel.html) for CR2003. It is found that the current sheet structure relevant to the streamer in question lies in between 50∘ - 60∘ southern latitude and extends over a rather wide longitudinal range from 200∘ - 300∘. Thus, it is suggested that distinctive wavy motions can be supported by different longitudinal parts of the plasma sheet, whose projections onto the sky plane form the observed tangling morphology. During the event, the CME structures associated with both CMEs flow outwards persistently, and we are unable to tell the exact mechanism driving the wavy motions.
2.1.4 Event 20030605
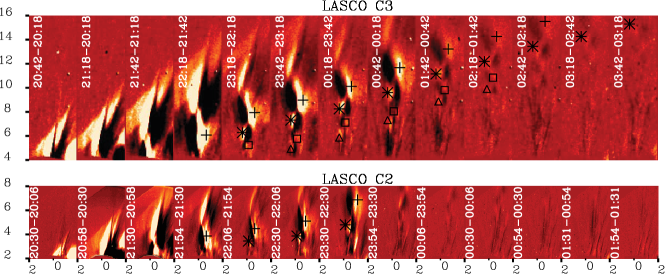
From Table 1, we see that the CME appears in the C2 FOV at 20:06 UT with a CPA of 230∘, an angular width of 310∘, and a linear speed of 1458 km s-1. At 20:30 UT, the CME hits a streamer structure with a CPA being about 316∘ from the bottom of the C2 FOV, as seen from Figure 3a. This results in an obvious leftward deflection, and a subsequent rightward motion of the streamer structure. It can be seen that the CME front leaves the C2 FOV very rapidly within about 1.5 hours after its first appearance. The majority of the CME ejecta is present on the right side of the streamer. On the other side, there exist structures with relatively weak brightness moving outwards along with the CME front. The material trailing these weak frontal structures are looking faint from the white light observations on the left side of the streamer. We therefore take this event as a streamer wave event suggesting that the wavy motion is supported by the inherent magnetic restoring force of the deflected structure. The morphology of the wavy motion can be observed from the last two images taken at 21:30 UT and 21:54 UT, when most part of the CME already leaves the C2 FOV. It is found that the event is simple and clear with more than three wave phases observable. This allows us to conduct a further investigation on the wave properties, which will be done as we proceed.
2.1.5 Event 20031118
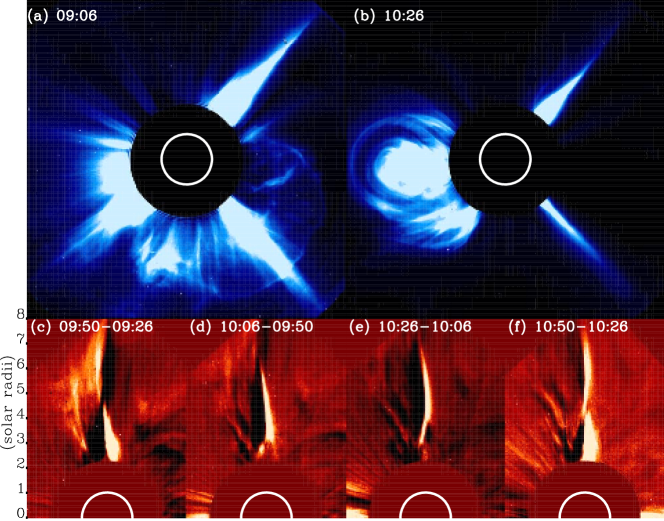
The CME driving this event appears in the C2 FOV at 8:50 UT with an accompanying M3.9 flare and a linear speed of 1660 km s-1, whose image observed at 9:06 UT is given in Figure 4a. At 10:26 UT, another CME with a CPA of 95∘ and a linear speed of 1824 km s-1 is observed by C2 and shown in Figure 4b. The ejecta of the first CME interacts with a streamer structure with a CPA of about 319∘. From Figure 4a, we see that the interaction starts from the bottom of the C2 FOV or probably at an even lower height, which results in a leftward deflection of the streamer structure. The RDIs in the streamer region rotated by 41∘ counterclockwise are shown in Figures 4c - 4f. From Figure 4c, it is easy to see that the CME-caused deflection, corresponding to the left-bright and right-dark feature in the upper part of the figure, is followed by a rightward motion as indicated by the right-bright and left-dark feature in the lower part, while no obvious trailing material of the CME is present on the left side of the streamer. Therefore, it is suggested that the above rightward motion is supported by the inherent magnetic restoring force of the streamer, and thus gives another example of streamer wave event.
According to the timing and the enhanced deflection of the streamer structure as seen from the second right-bright and left-dark feature at the bottom of Figures 4e and 4f, we suggest that this feature represents the streamer deflection caused by the second CME. It is found that the associated ejecta has no direct contact with the streamer structure. So it is possible that the impact of the CME on the streamer is achieved by expelling the surrounding coronal magnetic field and/or propagating disturbances. Examining the data from Wind/WAVES (Bougeret, et al., 1995), we find that there exists a type \@slowromancapii@ radio burst at 10:10 UT, corresponding temporally to the presence of the lower right-bright and left-dark feature of Figure 4e. Therefore, it is possible that the feature is a result of the streamer deflection caused by the associated CME shock (see, e.g., Sheeley, Hakala, and Wang, 2000). The subsequent observation indicates that this deflection does not grow into a streamer wave, yet terminates the development of the wave event caused by the previous eruption.
2.1.6 Event 20050115
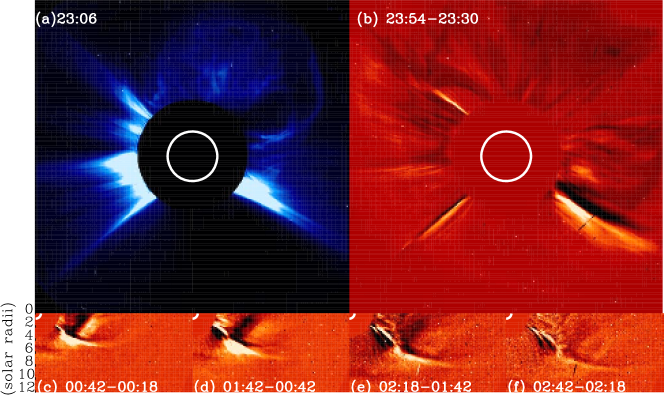
At 23:06 UT, a halo CME appears in the C2 FOV with a linear speed as large as 2860 km s-1 and an accompanying X2.6 solar flare. According to Figures 5a and 5b, we see that the eruption results in a global perturbation with all the streamers observed in the plane of the sky deflected. Among the streamers, the one with a CPA of 240∘ at 5 R⊙ presents the largest amplitude of deflection, along which the concerned wavy motion develops. In Figures 5c - 5f, we show the corresponding RDIs in the streamer region within the range of 4 R⊙ to 12 R⊙ taken from the C3 observations. The right-bright and left-dark feature in the upper part, i.e., father away from the Sun, of Figure 5c is associated with the rightward deflection of the streamer structure in response to the CME impact. The feature with different brightness distribution in the lower part of this figure is believed to be caused by the inherent magnetic restoring force of the streamer since no obvious trailing structures are observed on the right side of the streamer. In the last three panels of RDIs, we observe the outward propagation of the bouncing motion. At the lower part of Figures 5e and 5f we can discern the presence of another rightward wavy motion of the streamer structure. Thus, only one pair of the BD-DB feature is observable in this event.
2.1.7 Event 20061106
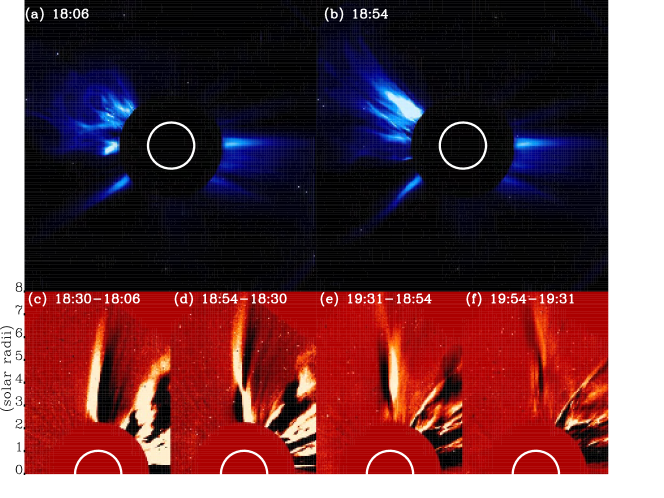
The CME driving this wave event is present in the C2 FOV at 17:54 UT with a CPA of about 80∘, an angular width of about 80∘, and a linear speed of 1994 km s-1. The streamer with a CPA of about 128∘ is deflected by the ejecta, as seen from Figures 6a and 6b. From Figures 6b and 6d, we see that the CME front already leaves the C2 FOV at 18:54 UT. The streamer starts to wave rightwards from the CME deflection producing the left-dark and right-bright feature in the streamer region at the bottom of Figure 6d. From Figures 6e and 6f, we see that the feature continues to propagate outwards along the streamer stalk to the outer edge of the FOV. There are no obvious trailing structures observed on the left side of the streamer. So this event is suggested to be a streamer wave event. It is also found that there is no direct contact of the CME ejecta with the streamer structure indicating that the interaction is possibly achieved by the CME expelling the surrounding coronal magnetic field and/or relevant disturbances. The Wind/WAVES data show that there exists a type \@slowromancapii@ decametric radio burst at about 18:00 UT. Therefore, it is also possible that the streamer wave is related to the shock disturbance driven by the eruption.
2.2 Discussion on the excitation conditions of streamer waves
S-labels
As mentioned previously, the excitation or formation of streamer wave requires certain strict physical conditions to be satisfied. The conditions may be related to the large-scale magnetic geometry of the corona, the CME dynamics and morphology, as well as the details of the CME-streamer interaction. To provide clues on these conditions, we first summarize the common observational features among the candidate events of streamer waves discussed in the previous subsection. First, all the driving CMEs are fast and wide with an average linear speed of 1580 km s-1 and an average apparent angular width of 290∘. Second, all the front-side CMEs have accompanying flares indicating the occurrence of magnetic reconnections during the process. Third, in most events CMEs hit the streamer from the flank, and the sites where the impact takes place are no higher than the bottom of the C2 FOV, i.e., lower than about 2 R⊙ in heliocentric distance. Keeping these observational common characteristics in mind, in the following we explain why the above conditions can be taken as necessary conditions for the excitation of streamer waves. We start by discussing the physical origin of the associated restoring force.
It is generally believed that the dynamical equilibrium between the expansion of hot coronal plasmas and the confinement of closed magnetic arcades gives rise to coronal streamers consisting of closed field arcades rooted on the photosphere and a cusp atop of them. Upon the impact of the CME ejecta, the streamer structure below the cusp gets deflected away from its equilibrium position. Due to the photospheric line-tying effect of the deflected field lines, the streamer structure responds to the CME impact with a magnetic restoring force, which may be given by both the magnetic tension and pressure. Thus, to produce such a restoring force, the closed field arcades in the streamer should be deflected. This requires that the site where the initial interaction between the ejecta and the streamer structure takes place be low enough, in agreement with the observations. Furthermore, to have a restoring force strong enough to produce observable effects on the streamer structure, the following conditions should also be satisfied.
First, the deflection amplitude should be large enough. This requires that the CME ejecta be close enough to the streamer, and the CME expands fast enough, also consistent with the observations of most of our events. Second, the duration of the CME interacting with the streamer structure below the cusp, say from 1.5 2.5 R⊙, should be short in comparison with the acting time scale of the inherent restoring force. For a fast-moving CME with a speed no less than 1000 km s-1, the ejecta can travel more than 5 R⊙ in 1 hour. In this case, the duration of the CME-streamer interaction in the region between about 1.5 2.5 R⊙ is appreciably short compared to the time scale of the restoring force which is estimated to be about 1 hour according to our observations. Therefore, a fast CME is also believed to be one necessary excitation condition for the growth of streamer waves. In addition, to make space for the bouncing motion of the streamer structure following the deflection, some of the magnetic field lines stretched outward by the ejecta should close back. This requires the occurrence of magnetic reconnections along with the eruptions, consistent with the presence of solar flares with all front-side CMEs.
We note that the above conditions are only necessary ones, other conditions including the details of the CME-streamer interacting process may be also required. On the other hand, it is true that whether the streamer wave, if already formed, is observable with the coronagraph still depends on the observational view angle, presence of interfering bright structures in the fore- and background corona, and existence of disturbing features of the present eruption and/or other nearby CMEs. We note that the work on excitation conditions of streamer waves is expected to improve by the analysis of more events in the future, as well as magnetohydrodynamic (MHD) modeling efforts designed to study the physics of CME-streamer interaction.
3 Wave properties and relevant seismological study on the 20030605 event
S-features This is suggested to be a simple and clear streamer wave event, which allows us to conduct a further analysis of the wave properties. In the following subsection, we will first determine the heliocentric distances of four wave crests/troughs based on the LASCO observations; then, we deduce the radial profiles of the wave period and wavelength, as well as the propagating phase speeds. In the second subsection, following the seismological approach developed by Paper \@slowromancapii@ we estimate the radial profiles of the Alfvén speed and magnetic field strength in the region surrounding the plasma sheet. The results will be compared with the 20040706 event studied previously.
3.1 Wave properties
S-equations Four white light images of this event have been presented in Figure 3. In Figure 7, we show all the relevant RDIs given by LASCO C2 (lower panels) and C3 (upper) observations. From the RDIs, it is easy to recognize the dark-bright pairs corresponding to the streamer deflection and the subsequent wavy motion. Using these difference images, we delineate the profiles of the streamer wave, and determine four specific wave phases at which the wavy motion reaches the maximum amplitude. The phases are called as P1, P2, P3, and P4, and marked with plus signs, asterisks, squares, and triangles. In comparison with the first three phases, P4 appears later associated with a smaller wave amplitude and a lower number of observations and less accuracy of distance and speed measurements as a result. Therefore, in the following text we will focus on the behavior of the first three phases.
The variations of the heliocentric distances of the four phases are shown in Figure 8a with corresponding symbols. The solid lines are given by the second order polynomial fittings to the measurements, which are then used to deduce the radial and temporal profiles of the propagation speed of a certain phase. Before presenting the speed profiles, we first discuss the variation of the wave period and wavelength deduced from Figure 8a.
For streamer waves, the wavelength is defined as the distance between two adjacent wave crests or wave troughs, e.g., the distance between P1 and P3 at a fixed time; the wave period is defined as the time difference of P1 and P3 passing the same altitude. With these definitions, radial evolutions of the two parameters can be deduced from Figure 8a and are shown in Figures 8c and 8d, respectively. Results for the 20040706 event are also plotted with dashed lines. We can see that, for the 20030605 (20040706) event, the period and wavelength increase from 2.4 R⊙ and 70 minutes (2.0 R⊙ and 50 minutes) at 4 R⊙ to 2.8 R⊙ and 85 minutes (2.6 R⊙ and 85 minutes) at 8 R⊙. Both parameters exhibit similar increasing trend with distances. It should be pointed out that, the statement regarding the wavelength increasing with distance has been explained with the positive difference of speeds of preceding and trailing wave phases in Paper \@slowromancapi@. For example, P1 moves faster than P2 and P3, as observed, this makes the distance between P1 and P3, i.e., the first wavelength, increases with the wave propagation. Nevertheless, the increase of period with the wave propagation is not mentioned in previous studies. Here, we provide an explanation of this observation still making use of the difference of phase speeds. From the definition of wave period given above, the time required by P1 to pass through a certain distance range, say from 4 to 6 R⊙, is shorter than the time used by P3 since at a fixed distance P1 moves faster than P3 in general. It can be found that in this case the wave period increases with distance. The phase speed variations involved here have both the spatial and temporal contributions, which are likely associated with the recovering process of the CME-disturbed corona. We will further discuss this process in the following subsection.
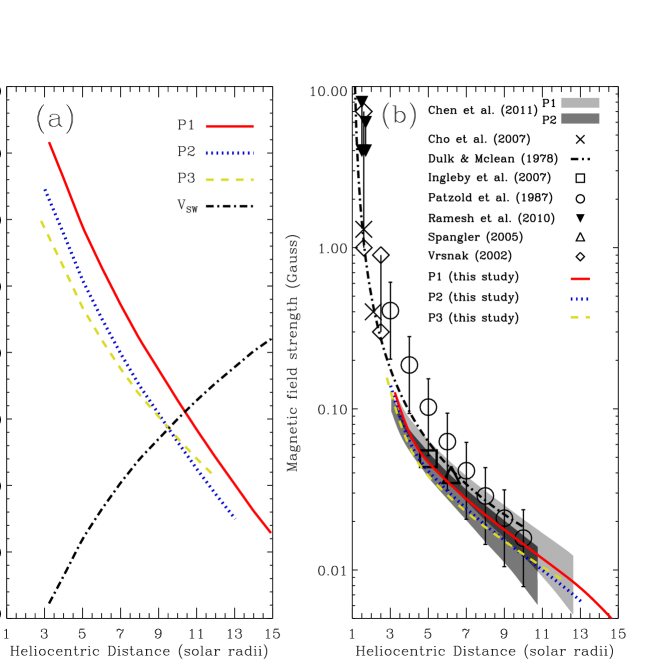
The phase speeds deduced from the distance-time fittings are plotted as solid lines in Figure 8b. From this figure, we see that the speeds of both P1 and P2 decrease from 435 and 400 km s-1 at 3 R⊙ to 425 and 390 (415 and 382) km s-1 at 5 (7) R⊙, while the speed of P3 keeps almost constant at about 371 km s-1. In addition, the speed averages of the four phases are 402, 376, 371, and 350 km s-1, which basically decrease with the order of their presence. Comparing the results of events 20030605 and 20040706, we find that the values and variation trends of the speeds associated with individual phases are essentially similar.
3.2 Relevant seismological study
S-simple-equations Using measurements of the 20040706 event, Paper \@slowromancapii@ conducted a seismological study to diagnose the distribution of the Alfvén speed and magnetic field strength in the region surrounding the streamer plasma sheet, interpreting the streamer wave as the fast kink body mode propagating along the sheet structure. The measured phase speed has two contributions, one is the speed of the background solar wind , the other is the phase speed of the mode at the plasma rest frame . The possible variation range of the former parameter is constrained by the statistical results of the speeds of blobs flowing together with the wind along the plasma sheet (Wang et al., 2000). The latter is connected to the Alfvén speed in the region outside of the plasma sheet () with an approximation deduced from a parameter study of the corresponding dispersion relation given by Edwin and Roberts (1982). We note that the situation considered by them, where a slab is embedded in an otherwise uniform environment, is different from the present case where an electric current sheet exists inside the high density slab, as suggested by the PFSS extrapolation results for all streamers studied here. The magnetic field reverses its direction across this sheet, thereby presenting a further transverse structuring. However, it can be shown that this current sheet is transparent to the two-dimensional perturbations we consider, as long as it is infinitely thin. Details of our deductions are given in the Appendix.
Thus, the radial profiles of can be deduced for individual phases. With the electron density distribution limited by the inversion of the pB (polarized brightness) data (van de Hulst, 1950; Hayes, Vourlidas, and Howard, 2001) recorded by LASCO, the magnetic field strengths associated with individual phases are then evaluated. It should be pointed out that these diagnoses have large errors and uncertainties. Measurement errors of the phase speeds are estimated to be about 10 (or a total of 20) in Paper \@slowromancapi@, and factors contributing to the uncertainties of our seismological studies are discussed in Paper \@slowromancapii@ and will not be repeated here.
Following the approach developed in Paper \@slowromancapii@, we conduct a seismological study using the streamer wave observations in the 20030605 event. For simplicity, only the average speed of the blob measurements is used in the study, which is plotted as the dot-dashed line in Figure 9a. It can be seen that the solar wind speed increases gradually from 50 km s-1 at 3 R⊙ to 110 (150) km s-1 at 5 (7) R⊙. Subtracting the above values of , we get the phase speed of the kink mode at the plasma rest frame . According to the parameter study on the dispersion relation carried out in Paper \@slowromancapii@, is related to with , where . Note that this value of is determined with the electron density distribution for the 20040706 event, which is basically similar to that for the present event as seen from the results of the pB inversion plotted in the following figure. Therefore, we make use of the same value of in this study.
The obtained radial profiles of associated with phases P1, P2, and P3 are shown in Figure 9a with solid, dotted, and dashed lines, respectively. From this figure, we see that values of are 408 (P1), 373 (P2), and 343 (P3) km s-1 at 3 R⊙, and decrease to 341 (P1), 304 (P2), and 283 (P3) km s-1 at 5 R⊙ and 287 (P1), 249 (P2), and 237 (P3) km s-1 at 7 R⊙. It can also be seen that in the region surrounding the plasma sheet the Alfvénic critical point, where , lies at 10 R⊙ and the Alfvén speed is 200 km s-1 there. This result is in agreement with the previous deduction using data from the Helios spacecraft (Pizzo et al., 1983).
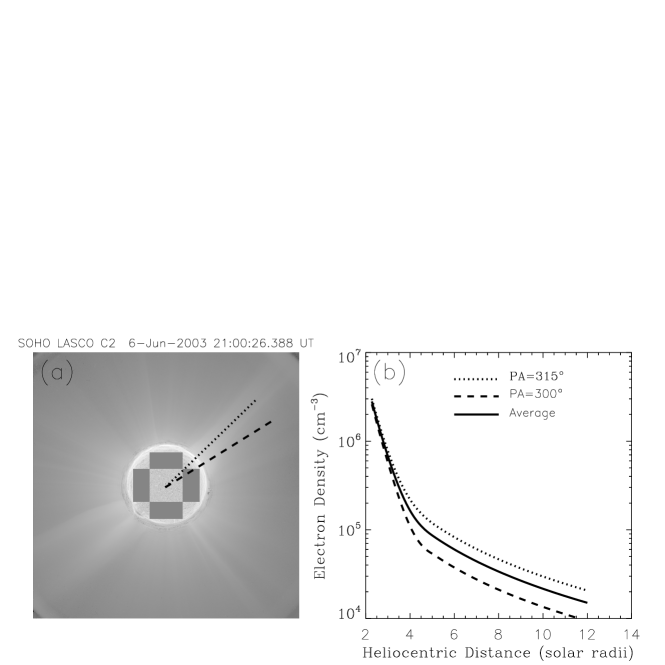
The radial profiles of the electron density below 5 R⊙ can be obtained with the pB inversion method given in the SolarSoft package, and that beyond 5 R⊙ are given by assuming an dependence. The pB data on 5 June 2003 were recorded at 21:05 UT when the streamer exhibits significant snakelike motion and, therefore, are not appropriate for the density inversion along a specific radial direction. There are no data obtained on the previous day, so we make use of the pB data recorded at 21:00 on 6 June for the required density deduction. This is equivalent to assume that the density along the streamer structure does not change appreciably during the day after the CME eruption. The densities along position angles of 315∘ and 300∘, representing different directions along and away from the streamer, are plotted in Figure 10b with dotted and dashed lines, respectively. The average of the two sets of densities is delineated with the solid line with values of , cm-3 at 3 (5, 7) R⊙, this is substituted in the deduced profiles of to diagnose the magnetic field strengths in the corresponding region. The obtained field strengths are shown in Figure 9b for phases P1 (red-solid), P2 (blue-dotted), and P3 (yellow-dashed). From the figure, we see that is 0.145 (0.045, 0.028) G for P1, 0.139 (0.041, 0.024) G for P2, and 0.129 (0.038, 0.023) G for P3 at 3 (5, 7) R⊙, respectively. Basically decreases according to the dependence.
In Figure 9b, we also show other estimates on the magnetic field strength in the corona with various symbols, including results from our previous study employing the streamer wave method to the 20040706 event presented as shadow areas, and several other diagnoses obtained employing various radio methods. To be specific, the strength-distance relationship in the heliocentric range of 1.02 - 10 above active regions (dot-dashed line) given by Dulk and McLean (1978) is mainly based on radio burst observations, the results of Vršnak et al. (2002) and Cho et al. (2007) presented as crosses and diamonds are deduced using the band-splitting phenomenon of type \@slowromancapii@ radio bursts, the results from the Faraday-rotation measurement of radio signals emitted from the Helios spacecraft and extragalactic radio sources are included as open circles with error bars (Pätzold et al., 1987), triangles (Spangler, 2005), and squares (Ingleby et al., 2007). The latest results obtained by Ramesh et al. (2010) employing the low-frequency circularly polarized radio emission inside a streamer structure are given as solid inverse triangles. We note that the above list of diagnoses of the coronal field strength is incomplete, and there exist many other estimates (see e.g., references in Vršnak et al., 2002). From this figure, it can be seen that the magnitude and variation trend of the magnetic field strength in the region surrounding the plasma sheet are basically consistent with the results for event 20040706 and other estimates.
In addition, we also find that both the Alfvén speed and magnetic field strength have a general decline trend with time at a fixed distance. According to the explanation provided in Paper \@slowromancapii@, this trend of variation of the two quantities is a result of the recovering process of the CME-disturbed corona. From Figure 9, it can be seen that both the magnetic field strength and Alfvén speed decline by about 15% during about 60-90 minutes, i.e., in about one wave period. Of course, the coronal field can not decrease unlimitedly. However, at this time it is not possible to assess how the magnetic field strength may evolve in such a short interval in the absence of a well-observed streamer wave phenomenon. Finally, we note that the differences between the diagnostic results for the three wave phases are possibly not significant considering the errors and uncertainties associated with our diagnostics.
4 Conclusions
In this paper, we present 8 candidate streamer wave events found via a data survey through LASCO observations in Solar Cycle 23. We find the following three common observational features in these events: (1) the driving CMEs are wide and fast with a linear speed no less than 1000 km s-1; (2) all front-side CMEs have accompanying flares; (3) in most events the bright CME and streamer structures have direct contact with each other, and the interaction starts at a height no higher than the bottom of the C2 FOV, i.e., lower than 2 R⊙. These common features shed light on the excitation conditions of streamer waves. Nevertheless, more similar events, when available in the future, should be analyzed and MHD models should be developed for a better understanding on the physics of CME-streamer interaction.
A further study on the event dated on 5 June 2003 gives radial and temporal evolution of wave properties including the period, wavelength, and propagation speeds of four observable wave crests/troughs. It is found that both the period and wavelength increase gradually with the wave propagation along the streamer plasma sheet, and the phase speed of the preceding wave phase is generally faster than that of the trailing ones. The associated coronal seismological study yields the radial profiles of the Alfvén speed and magnetic field strength in the region surrounding the streamer plasma sheet. It is found that the Alfvénic critical point is at about 10 R⊙ where the flow speed, which equals the Alfvén speed, is 200 km s-1. The magnetic field strengths corresponding to the first three wave phases are 0.145, 0.139, and 0.129 G at 3 R⊙, and decrease generally according to the dependence to 0.045, 0.041, and 0.038 G at 5 R⊙, and to 0.028, 0.024, and 0.023 G at 7 R⊙, respectively. The obtained results are generally consistent with that of another well-studied event on 6 July 2004.
Acknowledgements
The SOHO/LASCO data used here are produced by a consortium of the Naval Research Laboratory (USA), Max-Planck-Institut für Aeronomie (Germany), Laboratoire d’Astronomie Spatiale (France), and the University of Birmingham (UK). SOHO is a project of international cooperation between ESA and NASA. We thank Dr. A. Vourlidas for helping us analyze the LASCO pB data. This work was supported by grants NNSFC 40825014, 40890162, A Foundation for the Author of National Excellent Doctoral Dissertation of PR China (2007B24), and the Specialized Research Fund for State Key Laboratory of Space Weather in China. B Li is supported by the grant NNSFC 40904047, LD Xia by 40974105, and HQ Song by Natural Science Foundation of Shandong Province ZR2010DQ016 and Independent Innovation Foundation of Shandong University 2010ZRYB001.
We note that the situation considered by Edwin and Roberts (1982, ER82 from now on), where a slab is embedded in an otherwise uniform environment, is different from the present case where an electric current sheet (CS) exists inside the high density slab. The magnetic field reverses its direction across this sheet, thereby presenting a further transverse structuring. However, it can be shown that this CS is transparent to the two-dimensional perturbations we consider, as long as it is infinitely thin. To illustrate this, let us start with Figure 1 in ER82 where the vertical lines separate the slab from its environment. The dispersion relation (Equation (11) in ER82) then follows from the linearized ideal MHD equations, the ansatz that any small-amplitude time-dependent perturbation is in the form , the condition that the perturbations are not identically zero, as well as the requirements that the perturbed total pressure (gas plus magnetic) and transverse velocity be continuous across the interfaces . With the above ansatz in mind, a pair of that satisfies the dispersion relation will give a continuous throughout the entire plane. To be specific, Equation (10) in ER82) expresses both kink and sausage modes, with the former satisfying , and the latter obeying . Here or is arbitrary. Among the rest of perturbations pertaining to these modes, , are given by Equations (17) and (18) in Roberts (1981), while and can be found via Equation(10) in Roberts (1981), via Equation (9) and via Equation (6a). Here and are the velocity and magnetic field perturbations, respectively. Moreover, and represent the perturbed pressure, density and total pressure. The hat refers to the Fourier amplitudes. Let the solution set be denoted by . Now suppose the sign of the magnetic field in equilibrium in the right half of the plane () turns negative. It turns out that is also a solution of the linearized MHD equations in this case, the only modification being that should be in the opposite direction to found in ER82 for . Across the (perturbed) interface initially located at in equilibrium, the normal magnetic field, transverse displacement, and the perturbed total pressure are all continuous. (That is continuous follows from the fact that and are both continuous, and one can easily see that the latter does not change if and changes their signs simultaneously.) This allows us to see the CS as transparent within the framework of linear, ideal MHD. In particular, the dispersion relation derived in ER82 also applies.
References
- Bougeret (1995) Bougeret, J.L., Kaiser, M.L., Kellogg, P.J., Manning, R., Goetz, K., Monson, S.J., Monge, N., Friel, L., Meetre, C.A., Perche, C., et al.: 1995, Space Sci. Rev. 71, 231
- Brueckner (1995) Brueckner, G.E., Howard, R.A., Koomen, M.J., Korendyke, C.M., Michels, D.J., Moses, J.D., Socker, D.G., Dere, K.P., Lamy, P.L., Llebaria, A., et al.: 1995, Solar Phys. 162, 357.
- Chen (2010) Chen, Y., Song, H.Q., Li, B., Xia, L.D., Wu, Z., Fu, H., Li, X.: 2010, Astrophys. J. 714, 644.
- Chen (2010) Chen, Y., Feng, S.W., Li, B., Song, H.Q., Xia, L.D., Kong, X.L., Li, X.: 2011, Astrophys. J. 728, 147.
- Cho (2007) Cho, K.S., Lee, J., Gary, D.E., Moon, Y.J., Park, Y.D.: 2007, Astrophys. J. 665, 799.
- Dulk (1978) Dulk, G.A., Mclean, D.J.: 1978, Solar Phys. 57, 279.
- Delaboudiniere (1995) Delaboudinière, J.P., Artzner, G.E., Brunaud, J., Gabriel, A.H., Hochedez, J.F., Millier, F., Song, X.Y., Au, B., Dere, K.P., Howard, R.A., et al.: 1995, Solar Phys. 162, 291.
- Edwin (1982) Edwin, P.M., Roberts, B.: 1982, Solar Phys. 76, 239.
- Filippov and Srivastava (2010) Filippov, B., Srivastava, A.K.: 2010, Solar Phys. 266, 123.
- Gopalswamy (2009) Gopalswamy, N., Yashiro, S., Michalek, G., Stenborg, G., Vourlidas, A., Freeland, S., Howard, R.: 2009, Earth, Moon, and Planets, 104, 295.
- Hayes (2001) Hayes, A.P., Vourlidas, A., Howard, R.A.: 2001, Astrophys. J. 548, 1081.
- Hundhausen (1987) Hundhausen, A.J., Holzer, T.E., Low, B.C.: 1987, J. Geophys. Res. 92, 11173.
- Ingleby (2007) Ingleby, L.D., Spängler, S. R., Whiting, C.A.: 2007, Astrophys. J. 668, 520.
- Patzold (1987) Pätzold, M., Bird, M.K., Volland, H., Levy, G.S., Seidel, B.L., Stelzried, C.T.: 1987, Solar Phys. 109, 91.
- Pizzo (1983) Pizzo, V., Schwenn, R., Marsch, E., Rosenbauer, H., Muehlhaeuser, K.H., Neubauer, F.M.: 1983, Astrophys. J. 271, 335.
- Ramesh (2010) Ramesh, R., Kathiravan, C., Sastry, Ch. V.: 2010, Astrophys. J. 711, 1029.
- Roberts (1981) Roberts, B.: 1981, Solar Phys. 69, 27.
- Schatten (1969) Schatten, K.H., Wilcox, J.M., Ness, N.F.: 1969, Solar Phys. 6, 442.
- Schrijver (2003) Schrijver, C.J., De Rosa, M.L.: 2003, Solar Phys. 212, 165.
- Sheeley (2000) Sheeley, N.R., Hakala, W.N., Wang, Y.M.: 2000, J. Geophys. Res. 105, 5081.
- Spangler (2005) Spangler, S.R.: 2005, Space Sci. Rev. 121, 189.
- Tripahti (2007) Tripathi, D., Raouafi, N.E.: 2007, Astron. Astrophys. 473, 951.
- Hulst (1950) van de Hulst, H.C.: 1950, Bull. Astron. Inst. Neth. (11), 135.
- Vranak (2002) Vršnak, B., Magdalenic, J., Aurass, H., Mann, G.: 2002, Astron. Astrophys. 396, 673.
- Wang (2000) Wang, Y.M., Sheeley, N.R., Socker, D.J., Howard, R.A., Rich, N.B.: 2000, Geophys. Res. Lett. 105, 25133.
| CME | Streamer | |||||
| Date | Time | CPA | Width | Speed | Flares | CPA |
| (yyyy/mm/dd) | (UT) | (deg) | (deg) | (km s-1) | (deg) | |
| 20010420 | 10:06:05 | 65 | 127 | 1160 | 15 | |
| 20030527* | 23:50:05 | Halo/S | 360 | 964 | X1.3 | 185 |
| (20030528) | (00:50:05) | (Halo/BA) | (360) | (1366) | (X3.6) | (185) |
| 20030605 | 20:06:05 | 230 | 239 | 1458 | 316 | |
| 20031118* | 08:50:05 | Halo/BA) | 360 | 1660 | M3.9 | 319 |
| 20040705* | 23:06:05 | Halo | 360 | 1444 | 225 | |
| 20040706 | 20:06:06 | Halo(BA) | 360 | 1307 | 225 | |
| 20050115 | 23:06:50 | Halo(BA) | 360 | 2861 | X2.6 | 240 |
| 20061106 | 17:54:04 | 80 | 80 | 1994 | C8.8 | 128 |
f3
f7