Pulse-to-pulse variability of bright accreting pulsars
Abstract:
In addition to coherent pulsation, many accreting neutron stars exhibit flaring activity and strong aperiodic variability on time scales similar to or shorter than their pulsation period. Such a behavior shows that the accretion flow in the vicinity of the accretor must be highly non-stationary. Although from the theoretical point of view the problem of non-stationary accretion has been addressed by many authors, observational study of this phenomenon is often problematic as it requires very high statistics of X-ray data and a specific analysis technique. In our research we used high-resolution data taken with RXTE and INTEGRAL on a sample of bright transient and persistent pulsars, to perform an in-depth study of their variability on time scales comparable to the pulsation period – ”pulse-to-pulse variability”. The high-quality data allowed us to collect individual pulses of different amplitude and reveal differences in their spectra (such an analysis we refer to as ”pulse-to-pulse spectroscopy”). The described approach allowed us for the first time to study luminosity-dependence of pulsars’ X-ray spectra in observations where the averaged (over many pulse cycles) luminosity of the source remained constant and discuss them in the frame of the current physical models of the accretion flow close to the neutron star surface.
1 Introduction
Strong aperiodic variability is a well known characteristic of many X-ray binary systems – both black hole candidates and accreting neutron stars. Although homogeneity and stationarity of the accretion flow is often assumed in calculation dealing with the structure of the X-ray emitting region above neutron star, the observed variability clearly indicates that the accretion flow in the vicinity of the accretor must be highly non-stationary. Morfill et al. (1984); Demmel et al. (1990); Orlandini & Boldt (1993) have shown that the inhomogeneity of the flow is generally expected in accreting pulsars and that it does not necessarily arise from the original inhomogeneity of the accreted matter but is rather produced by instabilities close to the magnetospheric boundary of the neutron star.
So far, the aperiodic variability of accreting pulsars has mostly been studied by means of power spectra of high-time-resolution light curves (e.g. Belloni & Hasinger, 1990; Revnivtsev et al., 2009). In our work, however, we focus on the variable profile shape of individual X-ray pulses exhibited by many accreting neutron stars – pulse-to-pulse variability. Such a variability seems to be a common phenomenon among accreting pulsars and has been reported by several authors (Frontera et al. 1985 for A0535+26, Kretschmar et al. 2000 for Vela X-1, Tsygankov et al. 2007 for 4U 0115+63). However, a detailed study of pulse-to-pulse variability is usually limited by the photon statistics. In the present work, we used the archival data from high-sensitivity X-ray detectors onboard RXTE and INTEGRAL taken on a sample of bright accreting pulsars. Using a special analysis technique, we collected individual pulses of different amplitude and studied differences in their X-ray spectra.
| Source name | Instrument | middle MJD | Exposure (ksec) | Remarks |
|---|---|---|---|---|
| V0332+53 | RXTE | 53354 | 23.7 | Giant outburst 2004 |
| 4U 0115+63 | RXTE | 51249 | 32.8 | Giant outburst 1999 |
| A 0535+26 | RXTE/Integral | 53615 | 30.8/6.6 | Normal outburst 2005 |
| Her X-1 | RXTE | 52600 | 98.7 | Main-On state |
2 Observational data and analysis technique

For our analysis we used the data taken with the RXTE satellite during intense outbursts of the transient high mass X-ray binaries V0332+53, 4U 0115+63, and A 0535+26 and during a main-on state of the persistent intermediate mass X-ray binary Her X-1 (such states of high X-ray flux repeat in the system about every 35 days). For A 0535+26 we also used the data taken with INTEGRAL simultaneously with the RXTE observations.
For each of the three transient sources we used a short continuous set of pointings covering 1 day or less of the bright part of an outburst so that the average flux level was not changing significantly within the observations. For the persistent pulsar Her X-1 we used the data from the main-on state of the source which is best covered by RXTE observations (we restricted ourselves with the data from the middle part of the main-on where the flux does not change significantly). The observational data are summarized in Table 1
For the pulse-to-pulse analysis we extracted a high-resolution light curve of each source where single pulses are clearly distinguishable. An example of such a light curve obtained with RXTE/PCA on V0332+53 is shown in Fig. 1 where strong variability of the profile shape from one pulse to the next is visible. For each individual pulsation cycle in the extracted light curve we measured the average count rate within a pre-selected pulse-phase interval covering the brightest peak of the source’s pulse profile (the pulse), which we call amplitude of a pulse. As can be seen in Fig. 1 the amplitudes of individual pulses vary over a broad range. This allows one to explore the variation of the source X-ray spectrum as a function of the pulse amplitude, which is the central point of the presented analysis. We collected the data from pulses within narrow ranges of amplitude – amplitude bins – and for each bin performed spectral extraction. As a result, we obtained X-ray spectra as a function of the individual pulse amplitude or pulse flux.
3 Results
For each pulsar from our sample we obtained a series of broad band (3–80 keV) X-ray spectra corresponding to different pulse fluxes. The spectral continuum was modeled using a usual powerlaw-cutoff function. The four accreting pulsars are well established cyclotron line (or Cyclotron Resonant Scattering Feature, CRSF) sources. The absorption features were modeled using a multiplicative Gaussian absorption line model. We checked our fits for intrinsic dependencies between different pairs of the model parameters using contour plots to exclude any degeneracies. The presented results were also found to be stable with respect to the choice of different spectral functions (e.g. cutoffpl vs. powerlaw*hichecut XSPEC models). We are, therefore, confident that the variability reported below arises from the data and reflects real physics.
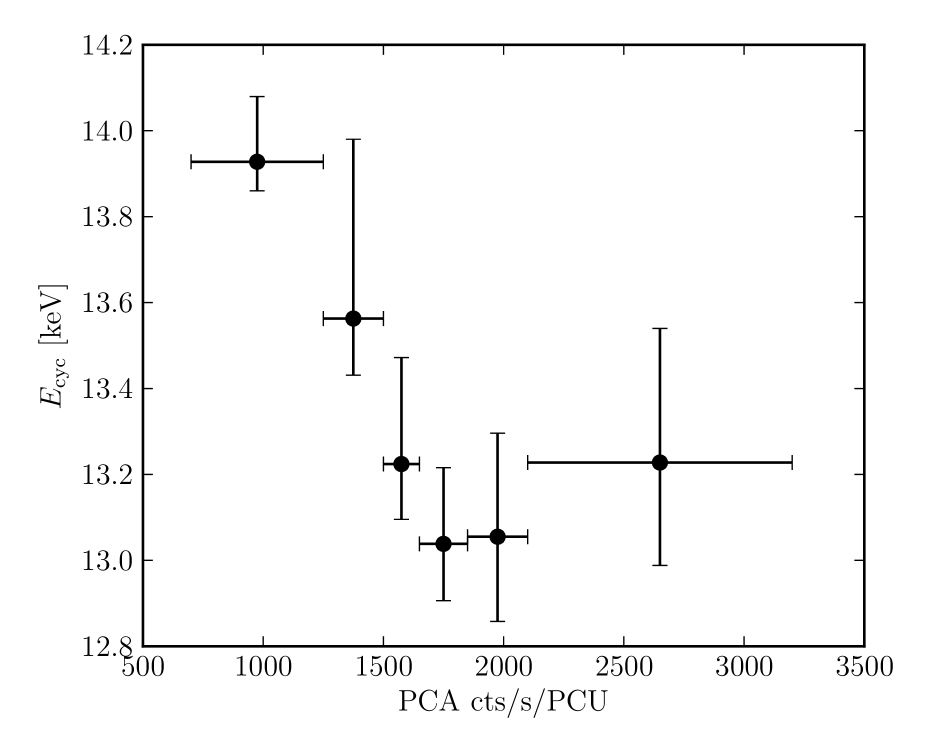
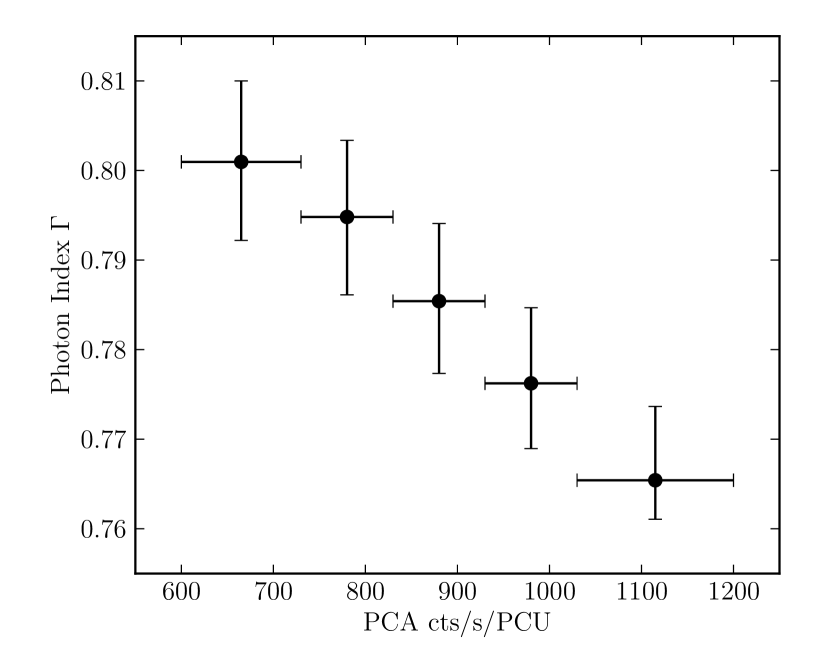
V0332+53. In this source we were able to measure the changing of two spectral parameters: the photon index and the fundamental cyclotron line energy as shown in Fig. 2. There is an indication of softening of the spectral continuum with increasing pulse flux (see the left panel). The negative correlation of the cyclotron line energy with the pulse amplitude clearly appears on the right panel. A negative correlation of with the averaged flux level has been reported for this source by Mowlavi et al. (2006); Tsygankov et al. (2010) during the rise and decay of strong outbursts. In our analysis, however, we observe the correlation during a short set of pointing where the averaged flux level stays constant.
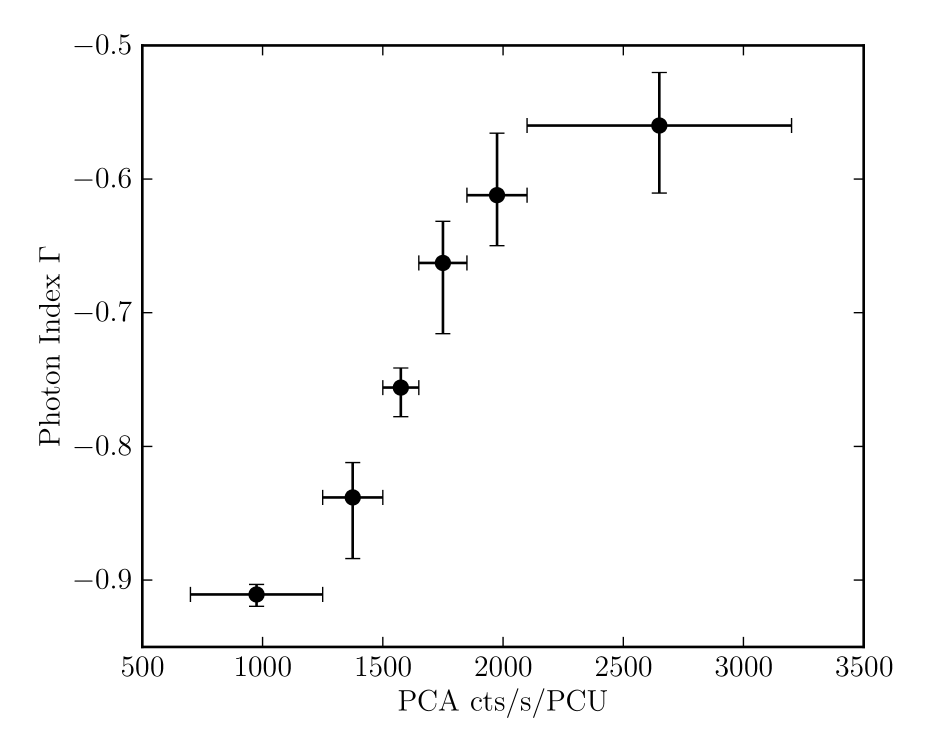
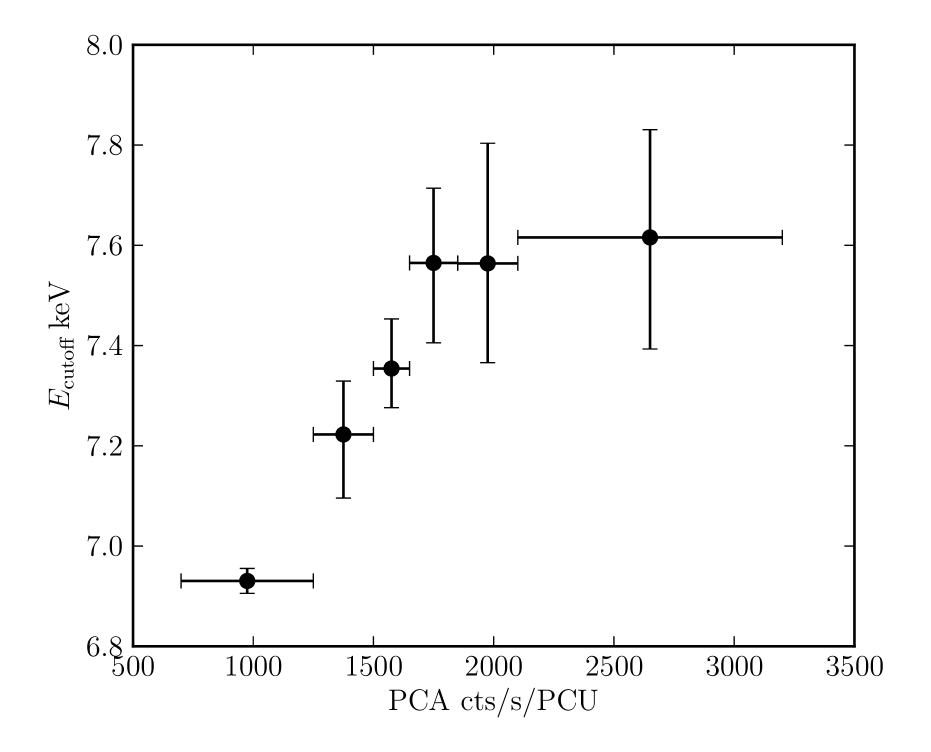
4U 0115+63. The measured dependencies of the photon index , exponential cutoff energy , and the cyclotron line energy are presented in Fig. 3. The positive correlation of with pulse amplitude (left panel) is similar to that measured in V0332+53. The cutoff energy is strongly positively correlated with pulse flux (middle panel). A strong decrease of the cyclotron line energy with pulse flux is seen in the right panel. Similar to V0332+53, a negative correlation of with the averages (over many pulsation cycles) flux was reported during gradual flux changes in giant outbursts of this source (Mihara et al., 1998; Tsygankov et al., 2007). Again, in our work we find a similar correlation on the bases of pulse-to-pulse variation while the averaged flux level does not change significantly.
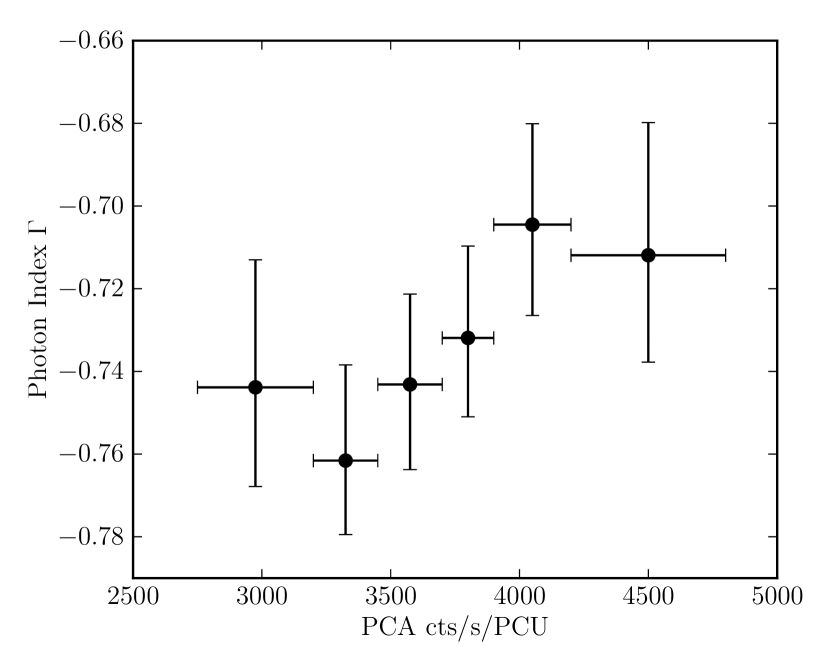
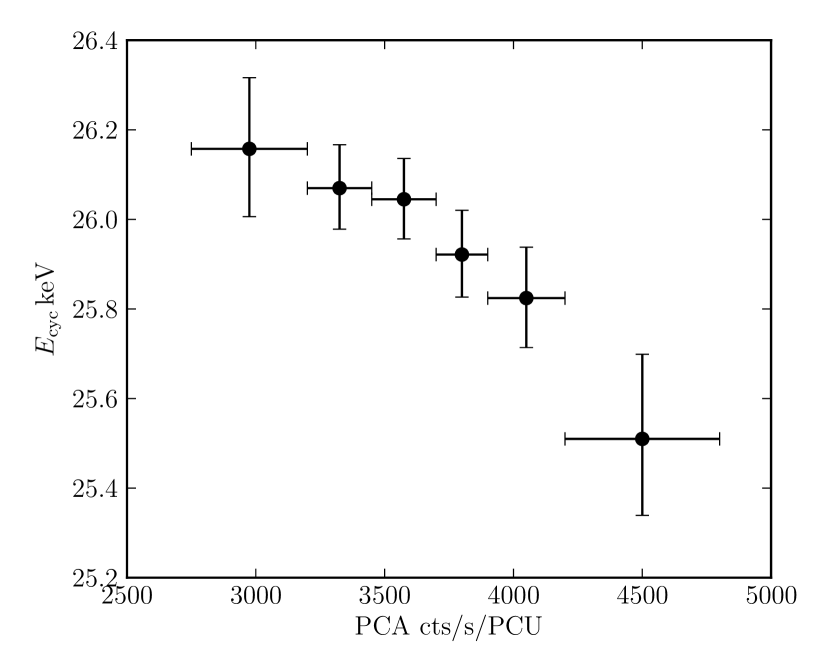
Her X-1. This source is particularly interesting as far as the flux-dependence of the X-ray spectrum is concerned. First, it is a persistent pulsar showing only minor variation of the averaged intrinsic X-ray luminosity compared to the transient sources, which makes the pulse-to-pulse technique probably the only way to study the luminosity-dependence of the spectrum. Second, contrary to V0332+53 and 4U 0115+63, a positive correlation of and the X-ray luminosity was reported on the basis of the entire set of RXTE observations of the source (Staubert et al., 2007). Using our method we were able to detect a significant positive correlation between and the pulse amplitude during a single main-on state where the averaged luminosity of the pulsar remained constant, thus, confirming the finding of Staubert et al. (2007). Additionally, we detected a negative correlation between the photon index and the pulse amplitude which is also contrary to V0332+53 and 4U 0115+63 (see above), probably indicating a different accretion regime in this system (see Discussion in Staubert et al. 2007). The photon index and the cyclotron line energy are shown in Fig. 4 as a function of single pulse amplitude.
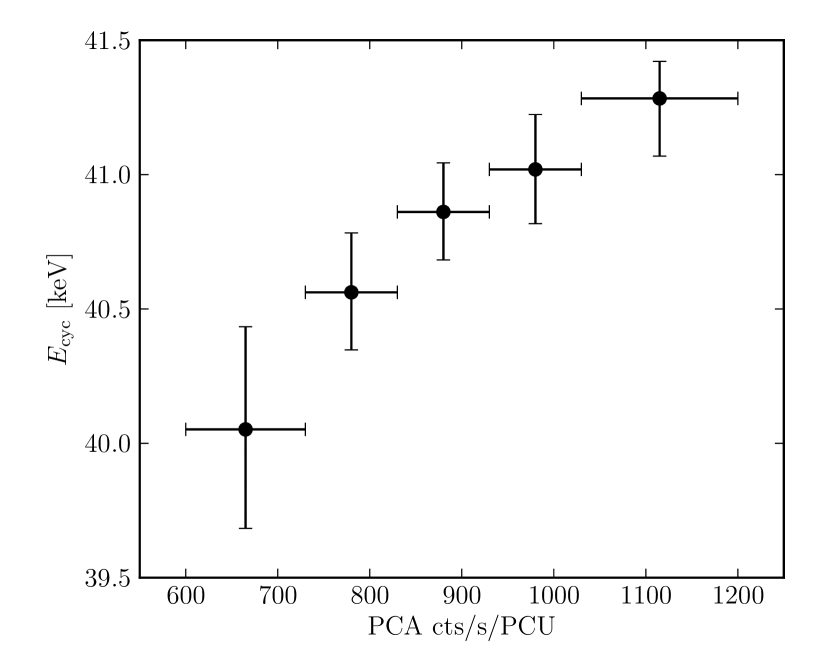
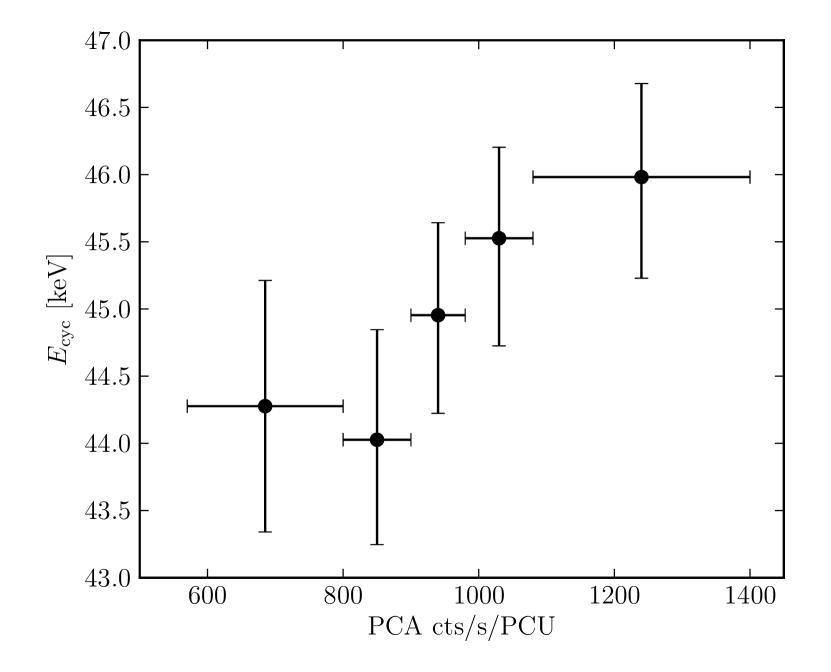
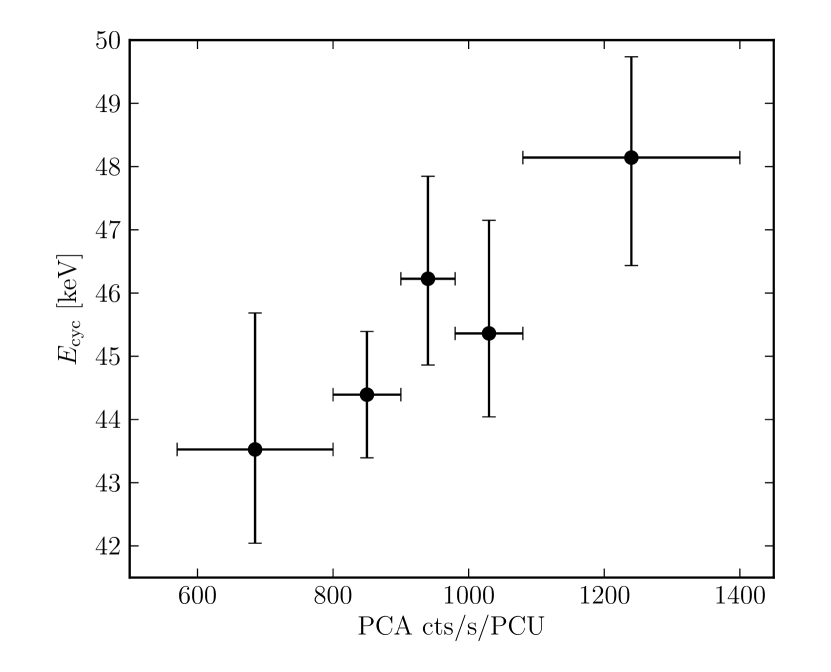
A0535+26. Despite many observed outbursts, no clear variations of the cyclotron line energy with flux have so far been reported (Caballero et al., 2008, end references therein). For this source our pulse-to-pulse spectroscopy revealed for the first time a positive correlation between the fundamental cyclotron line energy and the pulse amplitude (Fig. 5). For A0535+26 we used the data obtained simultaneously with RXTE and INTEGRAL. The RXTE/PCA light curve was used to select pulses (for a subsequent spectral analysis) for both satellites. Therefore the X-axis of the two graphs in Fig. 5 (representing the pulse amplitude) is in PCA count rate units. The correlation appears in the data from both satellites which straightens the evidence. Our finding makes A0535+26 only the second source (after Her X-1) showing positive correlation of the cyclotron line energy with flux.
4 Summary and conclusions
The reported analysis of a sample of bright accreting pulsars allowed us for the first time to find strong dependence of the X-ray spectral continuum and the cyclotron line energy on the amplitude of individual pulses. We argue that the observed variability most probably reflects the changing structure of the emitting region above the neutron star poles which is able to adjust on a short time scale (seconds) to the variable accretion rate . Indeed, the observed correlations of with the single pulse amplitude are in line with those reported on the basis of the averaged flux level for some of the sources. The latter were interpreted assuming a variable height of the accretion column which depends on (see discussions in Mowlavi et al., 2006; Staubert et al., 2007). Thus, similar changes of the polar accretion structure occurring on much smaller time scales are most probably responsible for the pulse-to-pulse spectral variations reported here.
References
- Belloni & Hasinger (1990) Belloni, T. & Hasinger, G. 1990, A&A, 230, 103
- Caballero et al. (2008) Caballero, I., Santangelo, A., Kretschmar, P., et al. 2008, A&A, 480, L17
- Demmel et al. (1990) Demmel, V., Morfill, G., & Atmanspacher, H. 1990, ApJ, 354, 616
- Frontera et al. (1985) Frontera, F., dal Fiume, D., Morelli, E., & Spada, G. 1985, ApJ, 298, 585
- Kretschmar et al. (2000) Kretschmar, P., Kreykenbohm, I., Wilms, J., et al. 2000, in American Institute of Physics Conference Series, Vol. 510, American Institute of Physics Conference Series, ed. M. L. McConnell & J. M. Ryan, 163–167
- Mihara et al. (1998) Mihara, T., Makishima, K., & Nagase, F. 1998, Advances in Space Research, 22, 987
- Morfill et al. (1984) Morfill, G. E., Truemper, J., Tenorio-Tagle, G., & Bodenheimer, P. 1984, A&A, 139, 7
- Mowlavi et al. (2006) Mowlavi, N., Kreykenbohm, I., Shaw, S. E., et al. 2006, A&A, 451, 187
- Orlandini & Boldt (1993) Orlandini, M. & Boldt, E. 1993, ApJ, 419, 776
- Revnivtsev et al. (2009) Revnivtsev, M., Churazov, E., Postnov, K., & Tsygankov, S. 2009, A&A, 507, 1211
- Staubert et al. (2007) Staubert, R., Shakura, N. I., Postnov, K., et al. 2007, A&A, 465, L25
- Tsygankov et al. (2007) Tsygankov, S. S., Lutovinov, A. A., Churazov, E. M., & Sunyaev, R. A. 2007, Astronomy Letters, 33, 368
- Tsygankov et al. (2010) Tsygankov, S. S., Lutovinov, A. A., & Serber, A. V. 2010, MNRAS, 401, 1628