20xx Vol. 9 No. XX, 000–000
22institutetext: Graduate University of Chinese Academy of Sciences, Beijing 100049, China \vs\noReceived [year] [month] [day]; accepted [year] [month] [day]
Kinematics and Stellar Population Properties of the Andromeda Galaxy by the Spectroscopic Observations of the Guoshoujing Telescope
Abstract
The Andromeda galaxy was observed by the Guoshoujing Telescope (GSJT, formly named the Large Sky Area Multi-Object Fiber Spectroscopic Telescope – LAMOST) during the 2009 commissioning phase. Due to the absence of standard stars for flux calibration, we use the photometric data of 15 intermediate bands in the Beijing-Arizona-Taipei- Connecticut (BATC) survey to calibrate the spectra. Total 59 spectra located in the bulge and disk of the galaxy are obtained. Kinematic and stellar population properties of the stellar content are derived with these spectra. We obtain the global velocity field and calculate corresponding rotation velocities outer to about 7 kpc along the major axis. These rotation velocity measurements complement those of the gas content, such as the H i and CO. The radial velocity dispersion presents that the stars in the bulge are more dynamically thermal and the disk is more rotation-supported. The age distribution shows that the bulge was formed about 12 Gyr ago, the disk is relatively younger, and the ages of some regions along the spiral arms can reach as young as about 1 Gyr. These young stellar populations have relatively richer abundance and larger reddening. The overall average metallicity of the galaxy approximates the solar metallicity and a very weak abundance gradient is gained. The reddening map gives a picture of a dust-free bulge and a distinct dusty ring in the disk.
keywords:
methods: data analysis — techniques: spectroscopic — galaxies: individual (M31) — galaxies: stellar content1 Introduction
Nearby galaxies are good probes to investigate the kinematic and dynamical properties, stellar populations, and formation and evolution histories of present-day galaxies in the local universe. Detailed analyses can be performed in respect to the bulge, disk, spiral arms, dust, H ii regions and so on with imaging of high resolutions and spectroscopy of high quality other than individual stars in the Milk Way. Therefore, large samples of nearby galaxies, covering different morphological types, luminosities, star formation rates and other properties, were handpicked in a variety of photometric and spectroscopic surveys from radio (Israel & van der Hulst 1983; Helfer et al. 2003; Walter et al. 2008), ultraviolet (Gil de Paz et al. 2007), optical(Kennicutt 1992; Rosales-Ortega et al. 2010) to infrared (Kennicutt et al. 2003) wavebands in order to study the chemical abundance, stellar population, stellar formation rate, gas content, interstellar medium and other physical properties of galaxies.
Most of the spectroscopic observations about the nearby galaxies were focused on the bright galactic cores (Heckman 1980; Ho et al. 1995) and large H ii regions (Neugebauer et al. 1976; van Zee et al. 1998), whose spectra were obtained mainly by aperture or long-slit spectrographs. A few large-aperture spectroscopic observations of nearby galaxies, such as Gallagher et al. (1989) and Kennicutt (1992), were taken in order to gain the integrated spectra and compare their integrated features with those of distant galaxies. Recently, integrated field spectroscopy techniques have played a very important role on spatially resolved spectroscopic measurements of nearby galaxies with high spatial resolutions in substantially large field of views (Bacon et al. 2001; Rosales-Ortega et al. 2010).
The Andromeda galaxy (M31 or NGC 224), as the largest and nearest spiral galaxy (SA(s)b) in the Local Group, has a major diameter of about 190\arcmin and distance of about 784 kpc (Stanek & Garnavich 1998). The systemic velocity is about -300 km s-1, the inclination is about 78∘ and the position angle of the major axis is about 38∘ (Gottesman & Davies 1970). These characteristic parameters will be adopted throughout the following study of this paper. Due to its great apparent scale length, distinct components (e.g., bulge, disk, spiral arms and halo) and a considerable number of resolvable sources and substructures such as single stars, star clusters, H ii regions, dust lanes and gas ingredients can be explored by imaging and spectroscopy to understand its distance, stellar population, age, chemical abundance distributions, tidal interaction, galactic formation and dynamical evolution (van den Bergh 1969; Blair et al. 1982; Brinks & Burton 1984; Choi et al. 2002; Ibata et al. 2005; Chapman et al. 2008).
Due to its large optical size (optical radius ), M31 is chosen to be one of the testing targets during the commissioning of the GSJT survey whose field of view (FOV) is about 5 degrees (Wang et al. 1996; Su et al. 1998; Cui 2009). The GSJT, located at the Xinglong Station of National Astronomical Observatories of China, is a quasi-meridian reflecting Schmidt telescope with a clear aperture of 4 meters and a focal length of 20 m. Special and unique designs make this telescope possess both large aperture and FOV. Four thousand fibers deployed on the focal plane of a 1.75 m diameter can simultaneously obtain the spectra of 4000 celestial objects. Individual point sources, normal and luminous red galaxies, planetary nebulae (PNe) and candidates as well as low red-shift quasars are selected as the observed objects in two M31 testing fields which are centered close to the optical nucleus of M31 and in the northeastern halo, respectively.
Although the GSJT is undergoing the commissioning phase and many aspects such as the telescope observing conditions (e.g., dome seeing), fiber positioning, instruments and data processing software are not in their perfect status, some preliminary results were published with the commissioning data observed in the winter of 2009 (quasars of Huo et al. (2010), Wu et al. (2010a), and Wu et al. (2010b) and planetary nebulae of Yuan et al. (2010)). At present, the pointing of fibers can not be directed so accurately, but they lie not far away from their preassigned positions on the sky. For studying the galactic surface, the accuracy of pointing is not so important because the fibers still point to the places of our interest. Observing conditions like seeing are not important at all for the extended galaxy. We will make use of the spectra near the core and inner disk in one of the M31 testing fields to study the distributions of the radial velocity, velocity dispersion, age, metallicity and reddening. In view of the absence of appropriate standard stars, the photometric observations of 15 intermediate-band filters in the BATC survey (Fan et al. 1996) are used to flux-calibrate the GSJT spectra.
There are substantial published studies about the kinematics and stellar population properties of M31, which can be used to compare with our results. Both the neutral atomic hydrogen (H i) observation by the Half-Mile telescope with an angular resolution of 1.5–2.2\arcmin and a velocity resolution of 39 km s-1 (Emerson 1976) and a molecule 12CO(J=1–0)-line survey with a high angular resolution of 23\arcsec and a velocity resolution of 2.6 km s-1 (Nieten et al. 2006) mapped the radial velocity field of the Andromeda galaxy. A large velocity gradient, rotational characteristics and much lower gas density near the center than the outer gas ring were presented in these two measurements. A slit spectrum covering the wavelength range from 4918 to 5302 Å at the point-like nucleus of M31 was obtained by Morton & Thuan (1973). Comparing the spectrum with those of G and K stars, they gained the total line of sight velocity dispersion of about 120 30 km s-1. Whitmore (1980) also observed the spectrum of the nucleus and provided the nuclear velocity dispersion of about 181 km s-1. Meanwhile, dispersion measurements in some literature were summarized by him, giving the average velocity dispersion of about 164 km s-1.
Multi-band photometric data from ultraviolet to infrared and images with resolved stars from the Hubble Space Telescope were used to drive the age, mass, metallicity and reddening of globular clusters in M31 by either stellar population synthesis or color magnitude diagrams (Fan et al. 2008; Ma et al. 2009; Perina et al. 2010). Spectroscopic data of several hundred of globular clusters extending from the galactic center out to 1.5∘ revealed that metal-richer clusters have a centrally concentrated distribution with high rotation amplitudes, which are consistent with the bulge population (Perrett et al. 2002). These globular clusters present panoramic views of different parameters and provide extremely good constraints of the structure formation and evolution of this spiral galaxy. Large samples of planetary Nebulae, supernova remnants and H ii regions were also observed to obtain the chemical abundance and reddening features across the whole galaxy (Kumar 1979; Blair et al. 1982; Jacoby & Ciardullo 1999; Galarza et al. 1999; Richer et al. 1999).
This paper is organized as follows. In §2, the telescopes, relevant facilities and observations are described. In §3, we present the detailed data reduction including the data processing of the GSJT spectra and flux-calibrating these spectra using the photometric observations of 15 intermediate bands in the BATC survey. Results of the kinematic and stellar population parameters derived by the synthesis model and discussions on the distributions of these parameters are given in §4. Finally, conclusions are summarized in §5.
2 Telescopes and Observations
The GSJT is the largest optical reflecting Schmidt telescope in China with a clear aperture of 4 meters and a wide FOV of 5 degrees (Wang et al. 1996; Su & Cui 2003). Its architecture is comprised of a reflecting Schmidt corrector (MA) at the north end, a spherical primary mirror (MB) at the south end and a focal plane with diameter of 1.75 meters lying between MA and MB (20 meters away from the primary mirror). Light from celestial objects is reflected by MA into the telescope enclosure, reflected again by MB and at last converged at the focal plane. MA, as a coelostat and corrector, consists of 24 hexagonal plane submirrors giving the size of 5.724.40 m2. It is exposed to air with a wind screen preventing wind buffeting. This alt-azimuth mounting corrector together with the focal plane can track the celestial objects within the sky area of for 1.5 hours during their crossing the meridian. MB has 37 spherical submirrors giving the size of 6.676.05 m2 and its enclosure is ventilated to keep a good dome seeing. Active optics composed of segmented mirror active optics and thin deformable mirror active optics is achieved by the force actuators set on each submirror and two wave front sensors (Su & Cui 2004).
At the focal plane of the telescope, there are 4000 fibers medially distributed to 16 spectrographs. Each fiber with a diameter of 3.3 arcsec is directed to an entrance slit, where a dichroic filter splits the incident light beam into blue (3700–5900Å) and red (5700–9000Å) channels. Low and median resolution spectrographs are or will be equipped and in the current phase only the low resolution spectrographs come into service. Full and half sizes of slits yield the spectral resolutions of 1000 and 2000. All the fibers are parallelly controlled by two micro-stepping motors in individual domains (within a circle of 30 mm diameters, corresponding to 340 arcsec) (Xing et al. 1998). The separation between two adjacent units is designed to be 20 mm which ensures no blind spot on the convex focal surface. The minimal separation of two observable objects is 55\arcsec in order to avoid the collision of fibers.
During the early commissioning phase, nine fields were proposed to be observed in the winter of 2009, which is the best observational season in the Xinglong Station (Yuan et al. 2010). Two fields related to M31 were included in the test plan: one is centered on , close to the optical galactic center (), and the other is located in the northeastern outskirt of the Andromeda halo, centered on . Sorts of objects were selected as targets including low redshift quasars, normal and luminous red galaxies, standard stars, PNe and PN candidates, and sources complemented by the stars from the Two Micron All Sky Survey. Nearly 5% of the fibers were assigned to get the sky spectra. Observations were carried out on 2009 October 19 and December 15 (see details in Huo et al. (2010)). Bright and faint sources are observed respectively with three exposures (600 s each) and two exposures (1800 s each). Arc spectra from a mercury vapor and neon lamp and flat fields from a tungsten lamp and the offset sky were also obtained during observation. Given the goals of this paper and the spectral quality, only the field centered near the nucleus is analyzed in the following sections.
Since there is no available spectroscopic standard star in the field of our interest, we intend to flux-calibrate all the spectra by the photometric data of 15 intermediate bands in the BATC survey. The survey is based on a 60/90 cm Schmidt telescope also mounted at the Xinglong Station (Fan et al. 1996). A 20482048 charge-coupled device (CCD) with the pixel size of 1.7\arcsec is installed at the focal plane (focal ratio: f/3), generating a FOV of 58\arcmin58\arcmin. A set of 15 intermediate-band filters with bandwidths of 200–300 Å covers the wavelength range from 3000 to 10000 Å. They are specifically designed to exclude the bright and variable night sky emission lines. Four Oke-Gunn standard stars are used for flux calibration during the photometric nights (Yan et al. 2000; Zhou et al. 2001). In the BATC survey project, dozens of nearby galaxies including the Andromeda galaxy have been observed. Observations centered on the galactic nucleus of M31 began in 1995 and all the normal and photometric observations for 15 filters are completed now.
3 Data Reduction
3.1 Normal Data Processing for the GSJT
The original blue and red CCD frames are separately reduced by the basic two-dimensional data processing pipeline (Luo et al., 2004). In the beginning, CCD biases are subtracted from the raw frames including arc lamp, flat and target ones. Each spectral frame includes 250 spectra and each spectrum covers about 16 pixels in the spatial direction. Because of the high signal to noise (S/N), flat flames are used to trace the fiber spectra. The profile centers are determined by centroids and a proper aperture is selected to extract the flux along the dispersion direction for each fiber. Then, the extracted one-dimensional target spectra are corrected for various variations (e.g., relative throughputs of fibers, fiber transmissions and spectrograph responses) by the the lamp and sky flat fields. Wavelength calibrations are performed with the help of the arc lamp and sky emission lines which enforce the calibration accuracy. All sky spectra are combined to construct a “super sky”, which is interpolated to remove the sky light from the specified target spectra. Due to the absence of appropriate standard stars in the M31 field, we can get reliable blue and red spectra only with wavelength calibrations and sky subtractions but without flux calibration.
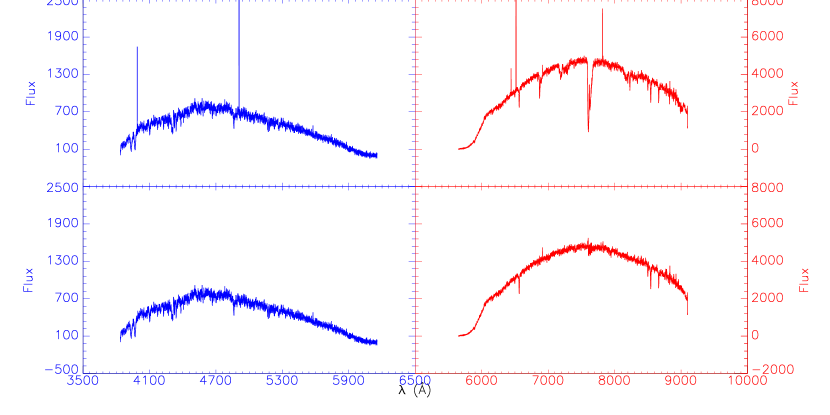
Cosmic rays are removed via replacing the relevant pixel values by interpolations. The red spectrum has considerable strong atmospheric absorption lines from O2 and H2O around 6300 Å, 6900 Å, 7200 Å, 7600 Å, 8200 Å and 9400 Å, but the blue spectrum is to the contrary. We select several spectra of relatively bright stars who have few intrinsic absorption lines in their red wavelength region and use them to construct a normalized spectrum of the atmospheric absorption. All observed red spectra are corrected by this normalized spectrum. Figure 1 displays the results of removing cosmic rays for the blue spectrum of a bright star in the left part and removing cosmic rays and correcting atmospheric absorption lines for the red spectrum of the same star. Finally, spectra of different exposures are combined to reduce noises.
3.2 Flux Calibration by the BATC Photometric Data
Photometric CCD images from the BATC survey are reduced by some standard procedures including the bias subtraction, flat-fielding and astrometry. Frames of different exposures for each band are combined to increase the S/N and delete the cosmic rays. Meanwhile, frames with relatively large sky backgrounds or short exposures are eliminated. Standard stars observed at photometric nights are used to obtain the instrumental zeropoints and atmospheric extinctions, which can convert the CCD counts to the out-of-atmosphere fluxes.
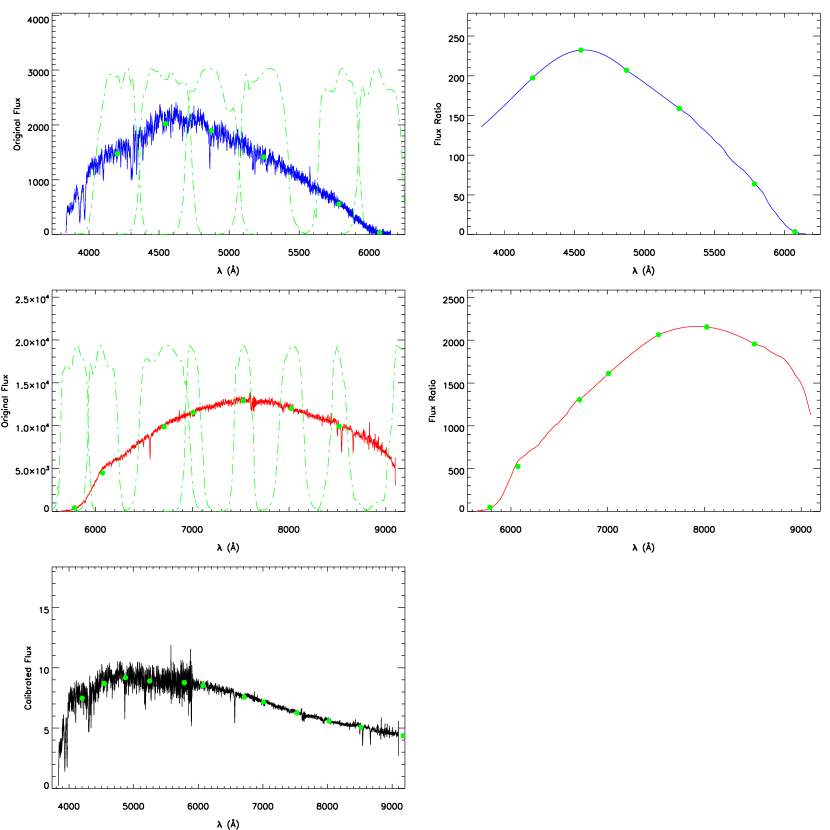
Since the M31 sky field has been observed by the BATC survey using 15 intermediate band filters, for the GSJT fibers near the galactic core and bright disk we can flux-calibrate the spectra of these fibers very well with the spectral energy distributions (SEDs) in 15 discrete wavelengths, ranging from 3000 Å to 10000 Å. First, we map all the objects in the GSJT input catalog to the BATC images and calculate the calibrated fluxes in the fiber aperture of 3.3\arcsec. Actually, the astrometry of photometric images has errors, seeing condition affects the flux distributions and the fiber-positioning is not so accurate. So we count the fluxes in a diameter of 6 pixels in the BATC images and then scale them to the fiber size of 3.3\arcsec. Second, we convolve the LAMOST spectra with the BATC filter transmission curves to obtain the instrumental fluxes. Both the blue and red spectra and convolutions with the filter transmissions for the same star as shown in Figure 1 are displayed in the top-left and middle-left panels of Figure 2. The blue spectrum is convolved with 6 filter transmissions (green dash dotted curves) ranging from 4200 to 6075Å and the red one is convolved with 8 filter transmissions ranging from 5795 to 9190Å. Flux ratios between the convolved instrumental fluxes and calibrated fluxes, as shown in the filled circles in the top-right and mid-right panels of Figure 2, are computed to derive the instrumental responses. Due to the complexity of instrumental responses near both two ends of the spectra, we interpolate the calibrated flux at several interm wavelengths among the bands in these areas, then get the corresponding fluxes in the original spectra at the same positions and calculate their ratios. The continuous instrumental responses are obtained by the piecewise quadratic interpolation using all the discrete flux ratios as plotted as curves in those two panels. These response curves are applied to flux calibrate the original spectra. At last, the red and blue calibrated spectra are spliced into a single spectrum as shown in the bottom panel of Figure 2.
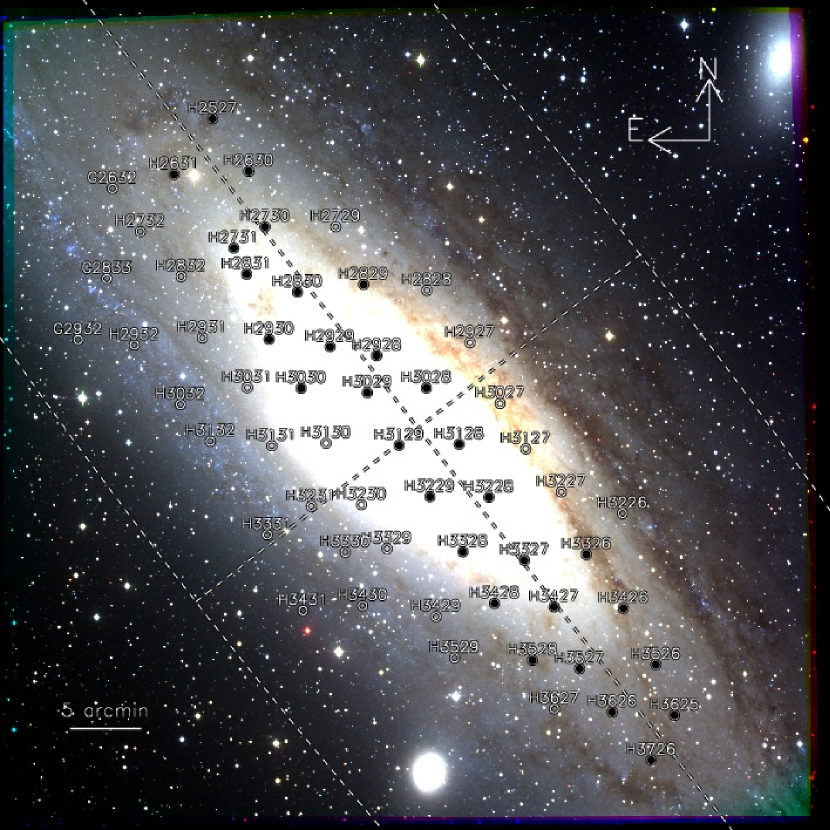
There are 4000 fibers which observed 4000 different objects in a FOV of 5 degrees as mentioned previously. Due to the FOV of the BATC survey is about 1 degree, most of the fibers lie out of the BATC sky field. In addition, some of the rest spectra come from point sources such as the foreground stars and planetary nebulae, not from the galaxy itself. Finally, excluding the spectra with low S/Ns and bad flux calibrations, we totally obtain 59 usable spectra of relatively high qualities which are located on the M31 surface of our interest. Figure 3 shows the positions of those 59 fibers on the true color map of the Andromeda galaxy which is combined with three BATC intermediate band images (effective wavelengths of 4550, 6075 and 8082 Å for the blue, green and red channels, respectively). Most of the spectra are originated from the bulge and bright disk, while a couple of them are related to the dust lane and spiral arms. For the next analyses of this paper, we smooth the spectra in the whole wavelength range by averaging the fluxes in every five data points to improve the S/Ns.
4 Results and Discussions
4.1 Parameters Derived by STARLIGHT
A stellar population synthesis code, STARLIGHT (Cid Fernandes et al. 2005), is employed to get the physical properties of the M31 spectra. STARLIGHT considers that a complex stellar population, for example a galaxy, should be a linear combination of a set of simple stellar populations (SSPs). Optimal match of the observed spectrum with the theoretic model spectra is executed by subtly designed algorithms to obtain a sequence of parameters (e.g., age and metallicity). During the match, an appropriate extinction, a velocity shift and a velocity dispersion by Gaussian convolution are added to the model spectrum and so the program also outputs the radial velocity, velocity dispersion and reddening value. The SSP spectral base we adopt comes from the evolutionary synthesis model of Bruzual & Charlot (2003) in the high revolution version. The SSPs in the base are the same as those of Cid Fernandes et al. (2005), which are generated with the initial mass function of Chabrier (2003). This base is composed of 45 SSPs encompassing 15 ages between 1 Myr and 13 Gyr and three metallicities ( = 0.2, 1 and 2.5 ). Galactic reddening law of Cardelli et al. (1989) with = 3.1 is served as the dust extinction model.
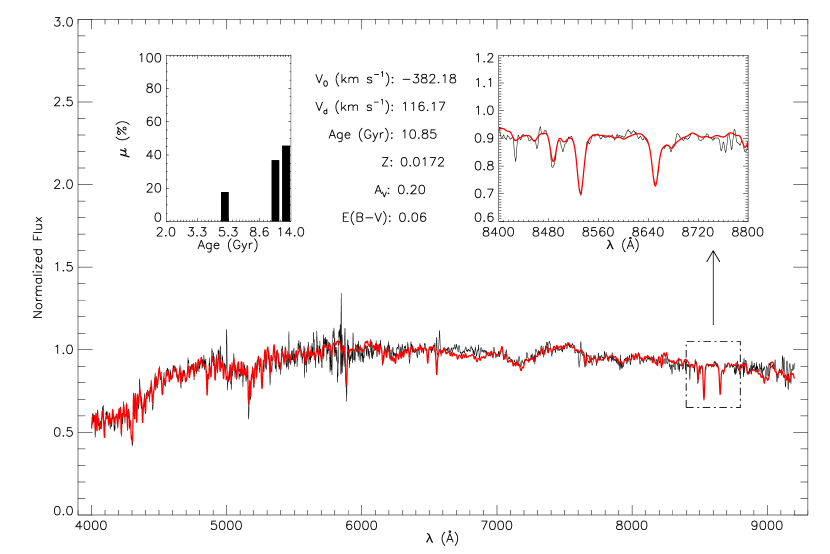
Before being fitted by STARLIGHT, all spectra are corrected by the Galactic extinction of 0.206 in taken from the reddening map of Schlegel et al. (1998). Besides, they are sampled into integer wavelengths with a step of 1 Å, which is strongly recommended to do by Cid Fernandes et al. (2005). Figure 4 illustrates the fitting result for an individual spectrum lying in the bulge of M31 (, ). The observed spectrum is fitted very well by the synthetical model spectrum. The plot in the upper right corner of Figure 4 displays spectral details near the Ca ii triplet absorption lines (8498, 8542 and 8662 Å) which are partly dependent on the stellar atmospheric parameters (Zhou 1991). Such considerable absorption lines, their profiles and the continuum itself can ensure the reliable estimation of the radial velocity, velocity dispersion, metallicity and other parameters. In STARLIGHT, mass weights () of different SSPs can be gained to learn the star formation and chemical abundance evolution histories. From the histogram in the top-left corner of the Figure 4, we can understand that at that galactic position, about 82% of the total mass comes from stellar populations older than 11 Gyr and all the mass was formed 5 Gyr ago. In addition, the average age of about 11 Gyr and small reddening values of 0.06 mag denote that it belongs to the typical old bulge stellar population.
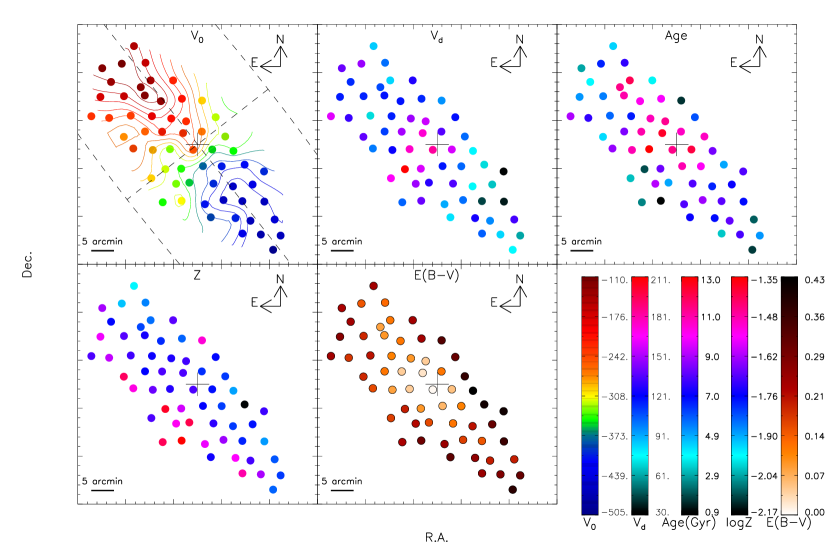
Different parameters for 59 spectra including the radial velocity, velocity dispersion, age, metallicity and extinction are listed in Table 1. All the radial velocities throughout this paper are converted to the heliocentric frame. The velocity dispersions are also corrected to true intrinsic stellar dispersions in consideration of the resolution of the base spectra (3 Å FWHM) and that of the GSJT spectra (R = 1250 as analyzed by Huo et al. (2010)). Correspondingly, the two-dimensional maps of these parameters on the galactic surface are displayed in Figure 5.
| ID | Sp | Fb | R.A. | Dec. | V0 | Vd | Age | |||
|---|---|---|---|---|---|---|---|---|---|---|
| (J2000) | (J2000) | () | () | (Gyr) | mag | mag | ||||
| (1) | (2) | (3) | (4) | (5) | (6) | (7) | (8) | (9) | (10) | (11) |
| G2632 | 15 | 112 | 11.1439590 | 41.5581530 | -118.7 | 138.7 | 2.8 | 0.0235 | 0.71 | 0.23 |
| G2833 | 15 | 107 | 11.1560830 | 41.4527510 | -174.2 | 115.3 | 5.1 | 0.0273 | 0.84 | 0.27 |
| G2932 | 15 | 109 | 11.2027500 | 41.3821370 | -230.6 | 160.3 | 9.0 | 0.0200 | 0.75 | 0.24 |
| H2527 | 15 | 176 | 10.9848750 | 41.6368900 | -148.4 | 83.7 | 4.4 | 0.0108 | 0.76 | 0.24 |
| H2630 | 15 | 187 | 10.9302500 | 41.5745280 | -163.1 | 100.2 | 7.5 | 0.0135 | 0.39 | 0.13 |
| H2631 | 15 | 182 | 11.0471460 | 41.5730550 | -110.2 | 147.2 | 6.5 | 0.0119 | 0.45 | 0.15 |
| H2729 | 15 | 197 | 10.7964160 | 41.5069730 | -221.3 | 126.2 | 3.7 | 0.0204 | 0.76 | 0.24 |
| H2730 | 15 | 188 | 10.9070840 | 41.5091100 | -151.4 | 81.6 | 12.0 | 0.0140 | 0.38 | 0.12 |
| H2731 | 15 | 192 | 10.9564340 | 41.4850010 | -125.3 | 106.3 | 11.4 | 0.0151 | 0.24 | 0.08 |
| H2732 | 15 | 119 | 11.1020000 | 41.5070000 | -133.8 | 112.3 | 3.9 | 0.0171 | 0.75 | 0.24 |
| H2828 | 15 | 191 | 10.6569170 | 41.4298060 | -297.6 | 94.0 | 1.5 | 0.0302 | 1.01 | 0.33 |
| H2829 | 15 | 190 | 10.7554790 | 41.4385410 | -209.8 | 113.0 | 9.9 | 0.0143 | 0.74 | 0.24 |
| H2830 | 15 | 196 | 10.8590000 | 41.4316670 | -139.6 | 117.0 | 10.2 | 0.0159 | 0.37 | 0.12 |
| H2831 | 15 | 178 | 10.9375620 | 41.4541400 | -118.1 | 116.5 | 11.0 | 0.0179 | 0.29 | 0.09 |
| H2832 | 15 | 193 | 11.0400210 | 41.4533040 | -163.3 | 113.5 | 5.4 | 0.0202 | 0.59 | 0.19 |
| H2927 | 15 | 235 | 10.5920000 | 41.3670000 | -323.3 | 117.5 | 5.9 | 0.0170 | 0.97 | 0.31 |
| H2928 | 15 | 199 | 10.7381060 | 41.3550000 | -225.4 | 155.9 | 11.3 | 0.0195 | 0.12 | 0.04 |
| H2929 | 15 | 200 | 10.8105000 | 41.3667910 | -208.5 | 148.1 | 10.8 | 0.0182 | 0.27 | 0.09 |
| H2930 | 15 | 194 | 10.9051040 | 41.3773060 | -184.9 | 114.6 | 6.6 | 0.0177 | 0.33 | 0.11 |
| H2931 | 15 | 198 | 11.0090000 | 41.3810000 | -235.6 | 67.7 | 5.7 | 0.0195 | 0.66 | 0.21 |
| H2932 | 15 | 104 | 11.1153130 | 41.3744870 | -231.7 | 130.6 | 7.5 | 0.0248 | 0.56 | 0.18 |
| H3027 | 15 | 239 | 10.5480000 | 41.2950000 | -324.9 | 100.7 | 10.7 | 0.0154 | 1.16 | 0.37 |
| H3028 | 15 | 195 | 10.6620420 | 41.3154980 | -267.0 | 135.5 | 10.7 | 0.0158 | 0.36 | 0.12 |
| H3029 | 15 | 183 | 10.7542290 | 41.3119870 | -229.1 | 173.9 | 12.5 | 0.0200 | 0.05 | 0.02 |
| H3030 | 15 | 180 | 10.8570410 | 41.3190840 | -215.6 | 149.9 | 11.0 | 0.0200 | 0.12 | 0.04 |
| H3031 | 15 | 184 | 10.9408330 | 41.3214150 | -256.4 | 108.8 | 8.4 | 0.0173 | 0.36 | 0.12 |
| H3032 | 15 | 185 | 11.0455840 | 41.3035850 | -277.7 | 137.5 | 4.3 | 0.0378 | 0.58 | 0.19 |
| H3127 | 3 | 148 | 10.5100000 | 41.2410000 | -349.9 | 75.8 | 8.3 | 0.0127 | 1.33 | 0.43 |
| H3128 | 3 | 138 | 10.6135830 | 41.2485280 | -353.9 | 158.4 | 12.2 | 0.0168 | 0.16 | 0.05 |
| H3129 | 4 | 44 | 10.7070000 | 41.2492490 | -245.7 | 183.4 | 11.4 | 0.0200 | 0.00 | 0.00 |
| H3130 | 4 | 31 | 10.8205830 | 41.2541390 | -331.8 | 175.0 | 13.0 | 0.0185 | 0.13 | 0.04 |
| H3131 | 4 | 46 | 10.9049590 | 41.2526400 | -287.8 | 121.6 | 10.9 | 0.0210 | 0.25 | 0.08 |
| H3132 | 4 | 26 | 11.0004160 | 41.2598320 | -241.6 | 97.8 | 8.7 | 0.0295 | 0.48 | 0.16 |
| H3226 | 3 | 149 | 10.3630000 | 41.1620000 | -404.6 | 30.5 | 7.9 | 0.0194 | 1.26 | 0.41 |
| H3227 | 3 | 144 | 10.4569170 | 41.1893350 | -416.1 | 68.0 | 4.9 | 0.0067 | 1.27 | 0.41 |
| H3228 | 3 | 133 | 10.5695620 | 41.1857360 | -412.5 | 102.0 | 10.1 | 0.0153 | 0.33 | 0.11 |
| H3229 | 4 | 33 | 10.6612080 | 41.1882780 | -382.2 | 116.2 | 10.9 | 0.0172 | 0.20 | 0.06 |
| H3230 | 4 | 42 | 10.7680000 | 41.1810000 | -345.6 | 159.0 | 8.2 | 0.0257 | 0.27 | 0.09 |
| H3231 | 4 | 43 | 10.8459170 | 41.1807210 | -319.2 | 210.7 | 1.8 | 0.0418 | 0.63 | 0.20 |
| H3326 | 3 | 137 | 10.4208340 | 41.1153340 | -440.2 | 64.0 | 7.0 | 0.0167 | 0.95 | 0.31 |
| H3327 | 3 | 147 | 10.5171670 | 41.1106110 | -463.6 | 72.8 | 6.5 | 0.0154 | 0.65 | 0.21 |
| H3328 | 4 | 30 | 10.6124160 | 41.1228070 | -405.8 | 134.3 | 7.9 | 0.0188 | 0.38 | 0.12 |
| H3329 | 4 | 38 | 10.7301250 | 41.1288870 | -360.4 | 127.1 | 4.9 | 0.0391 | 0.51 | 0.16 |
| H3330 | 4 | 32 | 10.7950000 | 41.1260000 | -331.2 | 148.3 | 9.1 | 0.0286 | 0.69 | 0.22 |
| H3331 | 4 | 48 | 10.9155840 | 41.1487240 | -297.1 | 166.9 | 3.1 | 0.0199 | 0.53 | 0.17 |
| H3426 | 3 | 128 | 10.3660000 | 41.0510000 | -454.2 | 35.1 | 6.8 | 0.0129 | 1.12 | 0.36 |
| H3427 | 3 | 134 | 10.4735410 | 41.0551680 | -469.3 | 42.0 | 8.0 | 0.0161 | 0.48 | 0.15 |
| H3428 | 4 | 34 | 10.5656660 | 41.0612790 | -455.8 | 100.5 | 8.8 | 0.0233 | 0.52 | 0.17 |
| H3429 | 4 | 47 | 10.6568750 | 41.0478060 | -413.9 | 89.8 | 7.9 | 0.0271 | 0.77 | 0.25 |
| H3430 | 4 | 28 | 10.7703750 | 41.0627520 | -310.4 | 139.0 | 0.9 | 0.0450 | 0.93 | 0.30 |
| H3431 | 4 | 40 | 10.8630000 | 41.0590000 | -347.7 | 102.1 | 2.4 | 0.0382 | 0.73 | 0.23 |
| H3526 | 3 | 132 | 10.3185000 | 40.9838910 | -452.7 | 132.2 | 2.0 | 0.0147 | 0.61 | 0.20 |
| H3527 | 4 | 6 | 10.4367500 | 40.9819450 | -459.3 | 95.2 | 8.1 | 0.0196 | 0.61 | 0.20 |
| H3528 | 4 | 25 | 10.5094170 | 40.9934730 | -407.0 | 123.8 | 6.8 | 0.0280 | 0.81 | 0.26 |
| H3529 | 4 | 24 | 10.6300000 | 40.9990000 | -393.3 | 79.5 | 7.0 | 0.0178 | 0.99 | 0.32 |
| H3625 | 3 | 150 | 10.2920000 | 40.9240000 | -470.6 | 58.6 | 5.1 | 0.0154 | 0.96 | 0.31 |
| H3626 | 3 | 140 | 10.3882910 | 40.9301380 | -481.8 | 81.5 | 7.8 | 0.0238 | 0.87 | 0.28 |
| H3627 | 4 | 23 | 10.4777500 | 40.9358600 | -435.5 | 103.1 | 3.2 | 0.0328 | 0.76 | 0.25 |
| H3726 | 3 | 160 | 10.3305630 | 40.8724020 | -505.1 | 75.1 | 1.6 | 0.0143 | 1.19 | 0.38 |
Column (1) is the temporary object ID in the LAMOST catalog. Column (2) and (3) are the No. of spectrographs and fibers, respectively. Column (4) and (5) give the equatorial coordinates in degrees. Column (6) is the heliocentric radial velocity. Column (7) is the intrinsic velocity dispersion. Column (8) is the mass-weighted age. Column (9) is the mass-weighted metallicity. Column (10) is the intrinsic extinction (), and column (11) is the corresponding reddening value in with of 3.1.
4.2 Parameter Uncertainties
For the estimations of the physical parameters, there are several sources of errors. The accuracy of the wavelength calibration has effect on the determination of the radial velocity. In the wavelength range of the red spectra, there are a considerable number of night sky emission lines such as OH and O lines. We use about 30 sky lines which are relatively strong, unblended and uniformly scattered to analyze the accuracy of the wavelength calibration for the red spectra. This gives the accuracies of about 6 , 4 and 9 for the No. 3, 4 and 15 spectrographs, respectively. Due to few sky lines in the blue spectra, we crudely estimate the accuracy of the wavelength calibration using the Oi line (5577 Å), which gives the accuracy of less than 4 for those three spectrographs. The accuracy measurements are similar to that of Huo et al. (2010) who gave the global accuracy of about 8 .
For our flux calibration method, most of the uncertainties should come from the photometric uncertainties in the BATC 15 intermediate bands. Due to the deep exposures of these bands, the average photometric errors of all the objects are smaller than 0.05 mag and can reach as low as to 0.02 mag. Such precise photometry makes us believe that the flux calibrations for all the spectra are accurate enough to get the reliable age, metallicity and reddening value by fitting the continuum with the synthesis model. From the galactic center to the outer regions, the spectral S/N gradually degrades, which might cause large uncertainties of parameters, especially the velocity dispersion in the outer regions. Smoothing the spectra broadens the spectral lines which might cause the velocity dispersion to be overestimated. As a whole, from the simulations of Cid Fernandes et al. (2005), for the spectra with S/N = 10, the uncertainties of velocity, dispersion, age in logarithm, , metallicity in logarithm are about 8.6 , 12.4 , 0.14 dex, 0.05 mag, and 0.13 dex, respectively. In this study, the S/Ns are larger than 10 for most of the spectra, so we consider those above uncertainties as the upper uncertainty limits of all our fitting results.
4.3 Velocity Field and Rotation Curve
In the first panel of Figure 5, the radial velocity ranging from -505 to -110 is approximately symmetric relative to both the major and minor axes. The average velocity is about -304 , which is close to the systemic velocity of about -300 and in very good agreements with the fitted systemic velocity of -304.5 in the H i measurements of Chemin et al. (2009), although our position distribution of the spectra is a little deviated from symmetry relative to the rotation center. These velocities presents a rotational velocity field of the stellar content of M31. They just complements those of the gas content such as H i and CO which is scarce near the core and in the inner disk of the galaxy.
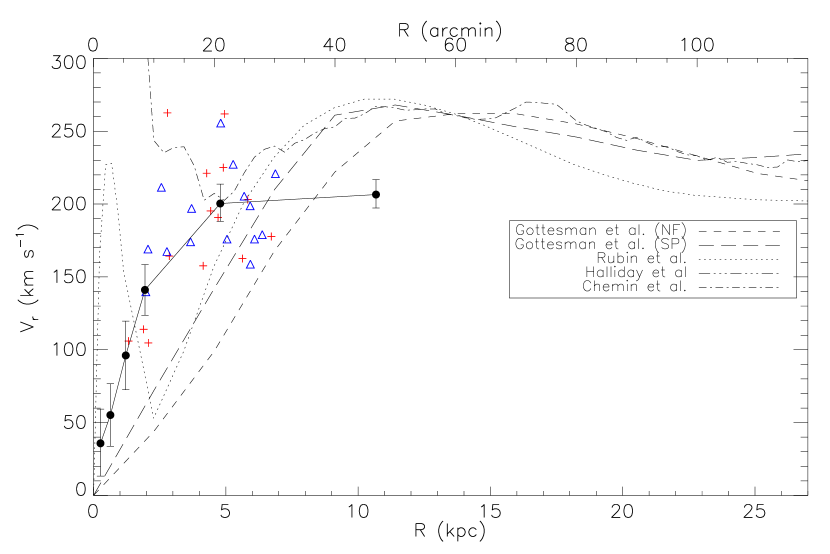
According to the velocity field and combining other velocity measurements, we can deduce the rotation curve of the galaxy, which can be used to constrain the galactic potential and the mass distribution and make it possible in detecting non-circular velocity components caused by either the radial expansion or the asymmetries due to the disk warp. Figure 6 shows the rotation velocity as a function of the radial distance from the galactic nucleus. The distances and rotation velocities are calculated under the assumption of a pure projected circular rotation with our selected dynamical parameters as covered previously (distance: 784 kpc, disc inclination: 78∘, and position angle: 38∘). In the figure, we only display the velocities of those positions within 1 kpc away from the major axis as denoted in filled circles in Figure 3. The velocities along the north direction of the major axis are denoted as crossings and those along the opposite direction are plotted as triangles. We do not find any discrepancy of the rotation velocity in these two sides, indicating that the stellar content of this galaxy is rotationally symmetric within about 7 kpc.
We compare our rotation velocities with the published rotation curves, which were derived by H i 21-cm observations of Gottesman & Davies (1970) and Chemin et al. (2009), emission lines (H and [N ii]) of Rubin & Ford (1970) and planetary nebulae of Halliday et al. (2006). Our circular velocities are close to other measurements around 5 kpc of both the gas and stellar contents. However, in the inner range, unlike to curve of Chemin et al. (2009), the velocity seems to decrease, which may be due to the rotational difference of those two contents in the galaxy. As a whole, our rotation velocities are proximate to those of Halliday et al. (2006).
4.4 Velocity Dispersion
In the velocity dispersion distribution of Figure 5, larger dispersions are concentrated on the galactic center, indicating the bulge is more dynamically thermal. In the east of the galaxy where a spiral arm is located as shown in the colored map of Figure 3, some of the velocity dispersions become a little larger, which may be caused by the perturbations of density waves. The global average velocity dispersion is about 114 and the dispersion close to the nucleus is about 183 . If we take the effective radius of the Andromeda bulge as 282.2 arcsec (Baggett et al. 1998), the average velocity dispersion of the bulge is about 153 , which generates the ratio of the dispersions between the bulge and nucleus of about 0.84. This ratio is very approximate to that of 0.83 derived by Whitmore (1980). In addition, the velocity dispersion of the nucleus bulge from Pritchet (1978) and Whitmore (1980) is about 150 . Global average dispersions from Halliday et al. (2006) and Merrett et al. (2006) are about 105 . All these measurements present a good consistency of the velocity dispersion with our results.
Figure 7 presents the radial distribution of the velocity dispersion along the major axis. The radial distances of all positions adopted here and in the rest of our paper are corrected with the characteristic parameters of the galaxy as previously mentioned. We can see that the dispersion becomes smaller when it goes further away from the center. The variation tendency is consistent with with the results of Halliday et al. (2006) and Merrett et al. (2006) in their study of PNe. As the distance extends for 4 kpc further, the dispersion seems to become stable around 100 .

4.5 Age, Metallicity and Extinction
From the age distribution in Figure 5, we can see that the bulge is older and younger stellar populations are likely to be located on the disk and near the spiral arms, which can be confirmed by the narrow band observations of emission lines. The average age is about 7.3 Gyr and the age of the bulge is about 11.5 Gyr showing the oldest component of the galaxy. The stellar populations close to the spiral arms can reach as young as about 1 Gyr. Such young components are likely to associate with the H ii regions where a number of young massive stars are being born.
Abundance map in Figure 5 shows that the spiral arms in the east are richer than other parts of the galaxy. The global average metallicity is about 0.02, the same as the solar abundance. For all spectra possible from the spiral arms and near the H ii regions, their mean metallicity is about 0.032, which is richer than the solar metallicity. We convert the metallicity in into [Fe/H] with the solar chemical composition of Grevesse & Sauval (1998). Although the scatter in this sample is substantial, the radial [Fe/H] distribution along the major axis as presented in Figure 8 gives a small metallicity gradient of -0.014 dex kpc-1.
Blair et al. (1982) determined both the nitrogen and oxygen abundances for 11 H ii regions by the empirical method. They derived the oxygen abundance gradient of about -0.44 dex which was scaled to the photometric radius of R25 where the surface brightness of the galaxy becomes 25 mag arcsec-2. Considering R25 of about 1.59∘ and the distance of about 784 kpc, the gradient of -0.44 dex in Blair et al. (1982) is equal to -0.02 dex kpc-1, which is somewhat larger than our result. The mean oxygen abundance of those 11 H ii regions is about 8.81 in log(O/H)+12. This gives the metallicity of about 0.016 which is a little lower than the average metallicity of 0.02 in our work. Globular clusters were gathered up to give the metallicity distribution by Barmby et al. (2000) and Fan et al. (2008), who showed a bimodal profile with peaks of [Fe/H] = -1.4 () and [Fe/H]= -0.6 () for the poor and rich groups, respectively. These globular clusters as the fossils during the evolution of the galaxy show much lower abundances than those of the galactic bulge and disk stellar populations as we measure.

The reddening distribution in Figure 5 shows that the bulge is clear of dust, while large extinctions tend to lie on the dust lane and the spiral arms, which take on a dusty ring. The average reddening is about 0.20 in . Kumar (1979) measured the reddening values of 22 H ii regions and presented the mean of about 1.31 (0.42 in ), which is much larger than the average of our measurements but closer to those of the spiral arms and H ii regions. Both Barmby et al. (2000) and Fan et al. (2008) determined the reddening values of globular clusters in M31 using the correlations between optical and infrared colors and metallicity as well as by defining various “reddening free” parameters. They gave the mean reddening values of about 0.22 and 0.28, respectively, close to our results. They also reported that the reddening is larger in the northwest of the galaxy than the other side, which can also be indicated in the reddening map as shown in the last panel of Figure 5.
4.6 Star Formation History
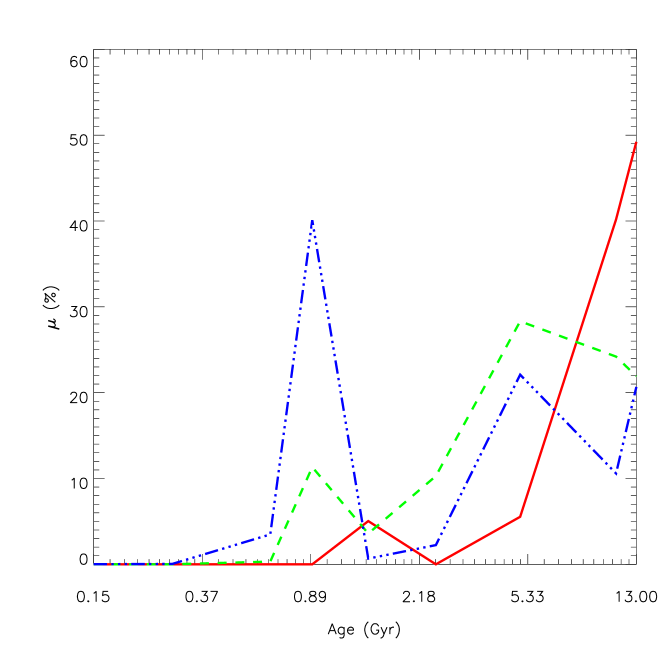
We divide all the spectra into three different components, i.e., the bulge, disk and spiral arms. Five spectra in total are located in the bulge and ten spectra lies in the spiral arms where much younger and metal-richer stellar populations are present. The rest of the spectra are considered to reside in the disk. For a specified spectrum, the mass fractions of SSPs with different ages are provided by STARLIGHT during fitting the spectrum with a linear combination of the SSP models. These mass fractions of different ages give the stellar evolution history. We plot the average mass fraction of the SSPs with the same age for each components in Figure 9. Most of the stellar mass in the bulge was formed as early as about 10 Gyr and no more star formation has occurred recently in this region. The disk seems to be more continuous in forming new generations of stars in its history and most of the disc stellar mass was formed about 5 Gyr ago. The spiral arms not only contain similar stellar populations of intermediate and old ages as the disk, but also have considerable young stellar populations formed about 1 Gyr ago. Since the spiral arms are the places where material density is perturbed by the density waves of the spiral structures, there are a great number of young massive stars are being born.
5 Conclusion
The GSJT is a fiber-feeding spectroscopic telescope with both a large field of view and a large aperture, which can obtain 4000 fiber spectra simultaneously. During the 2009 commissioning phase, two M31 fields were observed: one is centered near the galaxy core and the other is located in the halo. Since the data processing pipelines for the GSJT observed data are not in their perfect status and no suitable standard stars are found for flux calibration, we use the photometric data of 15 intermediate bands in the BATC survey which also observed M31 to flux-calibrate all the spectra in the field focused on the M31 center. As a result, there are 59 usable spectra in total. We use these spectra to study the kinematic properties and stellar populations of this galaxy. By STARLIGHT, we obtain the radial velocities, velocity dispersions, ages, metallicities and reddening values of all those 59 spectra. The distributions of these parameters are presented and comparisons with other measurements are also performed. The main conclusions are summarized as below:
(1) The radial velocity ranges from -505 to -110 , extending to the distance of about 7 kpc along the major axis. The average velocity is about -304 , very close to the systemic velocity of 300 . Rotation velocities of the spectra are calculated and compared with other rotation curves derived by the observations of the atomic hydrogen, ionized hydrogen regions and planetary nebulae.
(2) The average velocity dispersion is about 114 . The dispersions close to the nucleus and of the bulge within R = 282.2\arcsec are 183 and 153 , respectively, which yield the ratio of about 0.84 between the bulge and nucleus. This ratio approximates that of 0.83 derived by Whitmore (1980). The radial dispersion distribution shows that the dispersion becomes smaller as it is away from the center and the bulge is more dynamically thermal than the disk.
(3) The average age is about 7.3 Gyr and the bulge was formed about 11.5 Gyr ago. Some places close to the spiral arms regions can be as young as about 1 Gyr. The spiral arms and the areas close to H ii regions are both youngest and richest in abundance.
(4) The average abundance of the stellar content is about 0.02, the same as the solar metallicity. A small radial gradient of about -0.014 dex kpc-1 is gained. This metallicity gradient of the stellar content are somewhat lower than those of the gas content in the paper of Blair et al. (1982) who determined the abundances of 11 H ii regions.
(5) The reddening map shows that the nucleus and bulge is clear of dust and a distinct dust ring surrounds the galactic center. The mean reddening is about 0.2 in which approximates the average reddening value of the M31 globular clusters.
(6) The star formation history presents that the bulge, disk and spiral arms were formed in different stages of the evolution history. Most the stellar mass of those three components were formed 10 Gyr, 5 Gyr and 1 Gyr ago.
Acknowledgements.
The Guoshoujing Telescope (GSJT) is a National Major Scientific Project built by the Chinese Academy of Sciences. Funding for the project has been provided by the National Development and Reform Commission. The GSJT is operated and managed by the National Astronomical Observatories, Chinese Academy of Sciences. The STARLIGHT project is supported by the Brazilian agencies CNPq, CAPES and FAPESP and by the rance-Brazil CAPES/Cofecub program. This work was supported by the Chinese National Natural Science Foundation grands No. 10873016, 10633020, 10603006, 10803007, 10903011, 11003021, and 11073032, and by National Basic Research Program of China (973 Program), No. 2007CB815403.References
- Bacon et al. (2001) Bacon, R., et al. 2001, MNRAS, 326, 23
- Baggett et al. (1998) Baggett, W. E., Baggett, S. M., & Anderson, K. S. J. 1998, AJ, 116, 1626
- Barmby et al. (2000) Barmby, P., Huchra, J. P., Brodie, J. P., Forbes, D. A., Schroder, L. L., & Grillmair, C. J. 2000, AJ, 119, 727
- Blair et al. (1982) Blair, W. P., Kirshner, R. P., & Chevalier, R. A. 1982, ApJ, 254, 50
- Brinks & Burton (1984) Brinks, E., & Burton, W. B. 1984, A&A, 141, 195
- Bruzual & Charlot (2003) Bruzual, G., & Charlot, S. 2003, MNRAS, 344, 1000
- Cardelli et al. (1989) Cardelli, J. A., Clayton, G. C., & Mathis, J. S. 1989, ApJ, 345, 245
- Chabrier (2003) Chabrier, G. 2003, PASP, 115, 763
- Chapman et al. (2008) Chapman, S. C., et al. 2008, MNRAS, 390, 1437
- Chemin et al. (2009) Chemin, L., Carignan, C., & Foster, T. 2009, ApJ, 705, 1395
- Choi et al. (2002) Choi, P. I., Guhathakurta, P., & Johnston, K. V. 2002, AJ, 124, 310
- Cid Fernandes et al. (2005) Cid Fernandes, R., Mateus, A., Sodré, L., Stasińska, G., & Gomes, J. M. 2005, MNRAS, 358, 363
- Cui (2009) Cui, X. 2009, Bulletin of the American Astronomical Society, 41, 473
- Emerson (1976) Emerson, D. T. 1976, MNRAS, 176, 321
- Fan et al. (1996) Fan, X., et al. 1996, AJ, 112, 628
- Fan et al. (2008) Fan, Z., Ma, J., de Grijs, R., & Zhou, X. 2008, MNRAS, 385, 1973
- Galarza et al. (1999) Galarza, V. C., Walterbos, R. A. M., & Braun, R. 1999, AJ, 118, 2775
- Gallagher et al. (1989) Gallagher, J. S., Hunter, D. A., & Bushouse, H. 1989, AJ, 97, 700
- Gil de Paz et al. (2007) Gil de Paz, A., et al. 2007, ApJS, 173, 185
- Gottesman & Davies (1970) Gottesman, S. T., & Davies, R. D. 1970, MNRAS, 149, 263
- Grevesse & Sauval (1998) Grevesse, N., & Sauval, A. J. 1998, Space Science Reviews, 85, 161
- Halliday et al. (2006) Halliday, C., et al. 2006, MNRAS, 369, 97
- Heckman (1980) Heckman, T. M. 1980, A&A, 87, 152
- Helfer et al. (2003) Helfer, T. T., Thornley, M. D., Regan, M. W., Wong, T., Sheth, K., Vogel, S. N., Blitz, L., & Bock, D. C.-J. 2003, ApJS, 145, 259
- Ho et al. (1995) Ho, L. C., Filippenko, A. V., & Sargent, W. L. 1995, ApJS, 98, 477
- Huo et al. (2010) Huo, Z.-Y., et al. 2010, Research in Astronomy and Astrophysics, 10, 612
- Ibata et al. (2005) Ibata, R., Chapman, S., Ferguson, A. M. N., Lewis, G., Irwin, M., & Tanvir, N. 2005, ApJ, 634, 287
- Israel & van der Hulst (1983) Israel, F. P., & van der Hulst, J. M. 1983, AJ, 88, 1736
- Jacoby & Ciardullo (1999) Jacoby, G. H., & Ciardullo, R. 1999, ApJ, 515, 169
- Kennicutt (1992) Kennicutt, R. C., Jr. 1992, ApJ, 388, 310
- Kennicutt et al. (2003) Kennicutt, R. C., Jr., et al. 2003, PASP, 115, 928
- Kumar (1979) Kumar, C. K. 1979, ApJ, 230, 386
- Luo et al. (2004) Luo, A.-L., Zhang, Y.-X., & Zhao, Y.-H. 2004, Proc. SPIE, 5496, 756
- Ma et al. (2009) Ma, J., Fan, Z., de Grijs, R., Wu, Z., Zhou, X., Wu, J., Jiang, Z., & Chen, J. 2009, AJ, 137, 4884
- Merrett et al. (2006) Merrett, H. R., et al. 2006, MNRAS, 369, 120
- Morton & Thuan (1973) Morton, D. C., & Thuan, T. X. 1973, ApJ, 180, 705
- Neugebauer et al. (1976) Neugebauer, G., Becklin, E. E., Oke, J. B., & Searle, L. 1976, ApJ, 205, 29
- Nieten et al. (2006) Nieten, C., Neininger, N., Guélin, M., Ungerechts, H., Lucas, R., Berkhuijsen, E. M., Beck, R., & Wielebinski, R. 2006, A&A, 453, 459
- Perina et al. (2010) Perina, S., et al. 2010, A&A, 511, A23
- Perrett et al. (2002) Perrett, K. M., Bridges, T. J., Hanes, D. A., Irwin, M. J., Brodie, J. P., Carter, D., Huchra, J. P., & Watson, F. G. 2002, AJ, 123, 2490
- Pritchet (1978) Pritchet, C. 1978, ApJ, 221, 507
- Richer et al. (1999) Richer, M. G., Stasińska, G., & McCall, M. L. 1999, A&AS, 135, 203
- Rosales-Ortega et al. (2010) Rosales-Ortega, F. F., Kennicutt, R. C., Sánchez, S. F., Díaz, A. I., Pasquali, A., Johnson, B. D., & Hao, C. N. 2010, MNRAS, 405, 735
- Rubin & Ford (1970) Rubin, V. C., & Ford, W. K., Jr. 1970, ApJ, 159, 379
- Schlegel et al. (1998) Schlegel, D. J., Finkbeiner, D. P., & Davis, M. 1998, ApJ, 500, 525
- Stanek & Garnavich (1998) Stanek, K. Z., & Garnavich, P. M. 1998, ApJ, 503, L131
- Su et al. (1998) Su, D. Q., Cui, X., Wang, Y., & Yao, Z. 1998, Proc. SPIE, 3352, 76
- Su & Cui (2003) Su, L. P., & Cui, X. 2003, Proc. SPIE, 4837, 26
- Su & Cui (2004) Su, D.-Q., & Cui, X.-Q. 2004, Chinese J. Astron. Astrophys., 4, 1
- van den Bergh (1969) van den Bergh, S. 1969, ApJS, 19, 145
- van Zee et al. (1998) van Zee, L., Salzer, J. J., Haynes, M. P., O’Donoghue, A. A., & Balonek, T. J. 1998, AJ, 116, 2805
- Walter et al. (2008) Walter, F., Brinks, E., de Blok, W. J. G., Bigiel, F., Kennicutt, R. C., Thornley, M. D., & Leroy, A. 2008, AJ, 136, 2563
- Wang et al. (1996) Wang, S.-G., Su, D.-Q., Chu, Y.-Q., Cui, X., & Wang, Y.-N. 1996, Appl. Opt., 35, 5155
- Whitmore (1980) Whitmore, B. C. 1980, ApJ, 242, 53
- Wu et al. (2010a) Wu, X.-B., et al. 2010, Research in Astronomy and Astrophysics, 10, 737
- Wu et al. (2010b) Wu, X.-B., et al. 2010, Research in Astronomy and Astrophysics, 10, 745
- Xing et al. (1998) Xing, X., Zhai, C., Du, H., Li, W., Hu, H., Wang, R., & Shi, D. 1998, Proc. SPIE, 3352, 839
- Yan et al. (2000) Yan, H., et al. 2000, PASP, 112, 691
- Yuan et al. (2010) Yuan, H.-B., et al. 2010, Research in Astronomy and Astrophysics, 10, 599
- Zhou (1991) Zhou, X. 1991, A&A, 248, 367
- Zhou et al. (2001) Zhou, X., Jiang, Z.-J., Xue, S.-J., Wu, H., Ma, J., & Chen, J.-S. 2001, Chinese J. Astron. Astrophys., 1, 372