A hot molecular outflow driven by the ionized jet associated with IRAS 165623959
Abstract
We report molecular line observations in the CO J=32, 65 and 76 transitions, made using the Atacama Pathfinder Experiment Telescope (APEX), toward the massive and dense core IRAS 165623959. This core harbors a string of radio sources thought to be powered by a central collimated jet of ionized gas. The molecular observations show the presence of high velocity gas exhibiting a quadrupolar morphology, most likely produced by the presence of two collimated outflows. The southeast-northwest molecular outflow is aligned with the string of radio continuum sources, suggesting it is driven by the jet. We find that the excitation temperature of the gas in the SE-NW outflow is high, with values of 145 and 120 K for the blueshifted and redshifted lobes, respectively. This outflow has a total mass of 1.92 M⊙, a total momentum of M⊙ km s-1 and an averaged momentum rate of M⊙ km s-1 yr-1, values characteristics of flows driven by young massive stellar objects with high luminosities ( L). Complementary data taken with the Atacama Submillimeter Telescope Experiment (ASTE) in high density and shock tracers support the picture that IRAS 165623959 is an accreting young massive star associated with an ionized jet, which is the energy source of a molecular outflow.
1 INTRODUCTION
IRAS 165623959 (also G345.4938+01.4677) is a mid-infrared (MIR) source, with MSX (Midcourse Space Experiment) colors characteristics of massive young stellar objects (MYSOs) (Lumsden et al., 2002). Observations of dust continuum emission at 1.2 mm, made with SIMBA at the SEST telescope, show that IRAS 165623959 is associated with a massive () and dense ( cm-3) molecular core (López et al., 2011). Maser emission has been detected in transitions of OH (Caswell, 1998, 2004), giving further support to the hypothesis that IRAS 165623959 is a young high-mass star forming region.
Recently, Guzmán et al. (2010) reported the detection toward IRAS 165623959 of a string of radio continuum emission consisting of a bright compact central object and four outer lobes. They argue that the continuum emission from the central object corresponds to free-free emission from a thermal jet whereas the radio emission from the lobes correspond to thermal emission arising in shocks generated from the interaction of the collimated wind with the surrounding medium. Assuming that IRAS 165623959 is located at a distance of kpc ( km/s, Urquhart et al., 2008)111The near/far kinematic distance ambiguity was resolved in Faúndez et al. (2004), the total far-infrared luminosity, computed using the observed IRAS fluxes (see Casoli et al., 1986), is L. This implies that IRAS 165623959 harbors the most luminous MYSO known to date associated with an ionized jet.
Mid-infrared images taken from the Spitzer Space Telescope-GLIMPSE survey data (Benjamin et al., 2003) show bright emission associated with the jet in all IRAC bands. In particular, at 8.0 m there is extended emission roughly aligned with the jet axis. Further, there appears to be an excess of emission at 4.5m , which is thought to be indicative of shock activity (Cyganowski et al., 2008; Chambers et al., 2009). The GLIMPSE data also show that there is at least one more young stellar object (YSO) within the core, located about 15″ northeast of the jet, that is not detected at 2 m and hence likely to be deeply embedded.
In this paper we present molecular line observations toward IRAS 165623959 in the CO(), CO(), and CO() transitions, made using APEX, which have revealed the presence of two high velocity bipolar molecular outflows. Their observed and derived characteristics suggest that the driving sources are young, luminous protostellar objects. One of the outflows is aligned in the same direction as the string of radio sources strongly suggesting that it is being driven by the thermal radio jet.
2 OBSERVATIONS
The observations were made using the 12-m Atacama Pathfinder Experiment Telescope (APEX) located at Llano de Chajnantor, Chile. A detailed description of APEX and its performance are given by Güsten et al. (2006). The observed transitions and basic observational parameters are summarized in Table 1. Columns 1 and 2 give, respectively, the observed transition and line frequency. Columns 3, 4 and 5 give the telescope used, the half-power beam width and main beam efficiency at the observed frequency. Columns 6 to 9 give, respectively, the number of positions observed, the angular spacing, the channel width, and the resulting rms noise in antenna temperature, for each of the observed transitions.
The CO() observations were made during June, 2008 and July, 2009. The front-end consisted of a single pixel heterodyne SiS receiver operating in the 275-370 GHz band (Risacher et al., 2006). For the back-end we used the APEX Fast Fourier Transform Spectrometer (Klein et al., 2006) with a bandwidth of 1 GHz and 2048 frequency channels. The velocity coverage was km s-1 centered at km s-1 V with a channel width of 0.42 km s-1. In this transition the emission was mapped within a region of in size, with 20″ angular spacing (roughly full beam spacing), centered on the position of the radio source. System temperatures were typically 270 K. The pointing accuracy is ″ calibrated towards the source RT-Sco (03m32.6s, 55′14″) and the uncertainty in the absolute flux scale is . The observations were performed in position-switching mode under good atmospheric conditions () using 58m15s and 00′00″as off-position. The integration time on-source in each position was seconds, resulting in an rms noise of typically 0.1 K in antenna temperature per channel.
The CO() and CO() observations were made during August, 2009, under good weather conditions (0.35-0.45 mm of water vapor, corresponding to ) using an off-position located at . The pointing calibration source was NGC6334, attaining an accuracy of ″. The front-end consisted of a dual heterodyne SIS receiver array of 7 pixels operating in the 600-720 GHz and 750-950 GHz atmospheric windows, known as the CHAMP+ receiver (Güsten et al., 2008). In these two transitions we mapped the emission within a region of in size, with 4″ angular spacing. The back-ends were operated with 2.4 GHz total bandwidth with 2048 channels each.
We complement the above data with additional spectra taken toward the radio source position in the SiO(), HCO+() and C18O() lines. The SiO() observations were performed using APEX with the same APEX FFT spectrometer. The integration time was seconds giving an rms noise of 0.04 K.
The HCO+() and C18O() spectra were taken as part of a larger mapping of the core using the ASTE 10 m submillimeter telescope (Ezawa et al., 2004) during June-July, 2010, under good atmospheric conditions (). The front-end consisted in a heterodyne single pixel SiS receiver operating between 324 and 372 GHz. As back-end we used the MAC XF-type digital spectro-correlator with 1024 channels. For the C18O() line we used a total bandwidth of 512 MHz, giving a velocity resolution of about 0.43 km s-1, whereas for the HCO+() transition we used a 125 MHz bandwidth, giving a velocity resolution of km s-1. A detailed description of these observations will be given elsewhere.
3 RESULTS
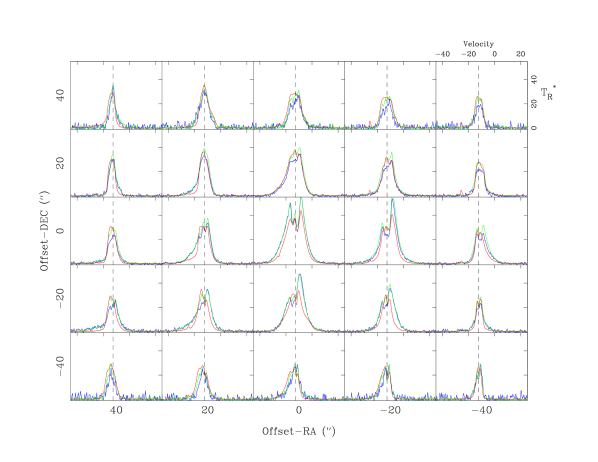
Figure 1 shows a grid of the CO spectra in the three observed transitions within a region of 100″ 100″ in size, with 20″ spacing. The spectra of the CO() and CO() transitions were convolved to match the angular resolution of the CO() spectra. Clearly seen in this figure is the presence of broad and strong wing emission across the molecular core.
Figure 2 shows the HCO+(), C18O() and SiO() spectra observed toward the peak position of IRAS 165623959. The HCO+() spectrum shows a double-peaked line profile, with a bright blue-shifted peak at km s-1 and a weaker red-shifted peak at km s-1. On the other hand, the C18O() line profile shows a symmetric single component with a peak line center velocity of km s-1. We also note that the HCO+() and the SiO() spectra show prominent high velocity wings.
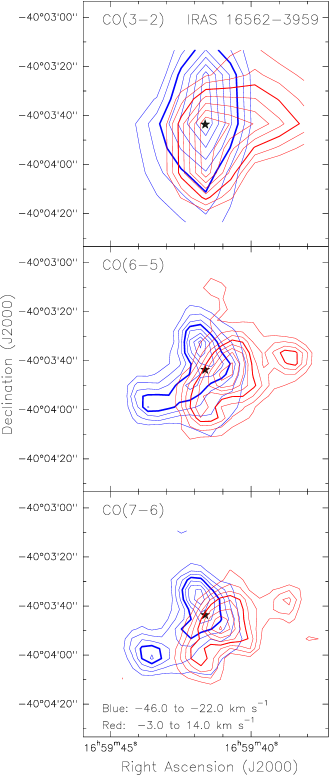
The 12CO profiles exhibit redshifted wing emission mainly towards the west and south, up to an LSR velocity of km s-1, whereas blueshifted wing emission is seen mainly towards the east and north, up to an LSR velocity of km s-1. The full velocity range of the wing emission observed is then km s-1. The radial flow velocity is defined as , where is the systemic velocity of the ambient gas. For the later we adopt a value of km s-1, corresponding to the peak velocity of the C18O() line profile observed toward the central position of the core. The maximum outflow velocity is then km s-1 towards the blue and km s-1 towards the red. Figure 3 shows contour maps of the wing emission in the three CO lines integrated over the velocity range km s-1 (blue contours) and km s-1 (red contours). The star marks the position of the radio jet (Guzmán et al., 2010). These velocity limits define the ranges in which emission from the high-velocity outflow gas is seen. We note that the blueshifted flow emission is slightly stronger and reaches higher radial flow velocities compared to the redshifted emission, hence the wider blueshifted velocity range. The inner limits of the ranges were selected as to leave out the contribution of the ambient cloud and chosen symmetrically respect to the ambient cloud velocity.
The spatial distribution of the blueshifted and redshifted emissions shows a quadrupolar morphology, with blueshifted emission seen mainly toward the east and north and redshifted emission seen toward the west and south. We propose that the quadrupolar morphology is produced by the superposition of two bipolar outflows, one along a southeast-northwest direction (hereafter the SE-NW flow) with a position angle of , and a second outflow aligned roughly in a north-south (N-S) direction. The collimation factors — length divided by width — of the molecular outflows are not high: for the blueshifted and redshifted lobes of the SE-NW outflow are and , respectively, whereas for the lobes of the N-S outflow we found values close to 1. These values are similar to those derived for massive outflows (Beuther et al., 2002). We note, however, that the highest velocity gas emission of the SE-NW outflow appears to be associated with more collimated structures.
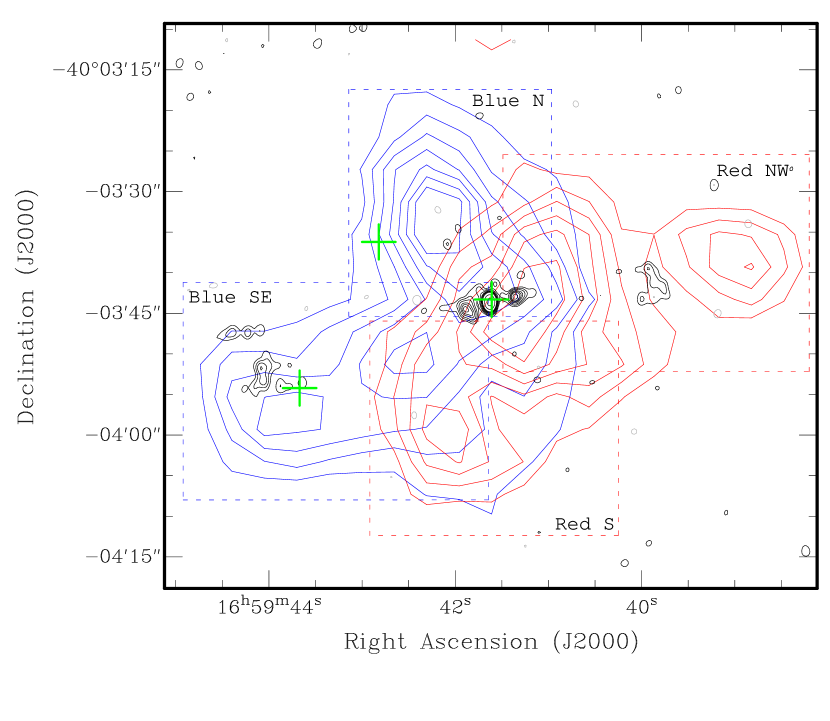
Figure 4 presents a contour map of the outflow emission in the CO() line overlayed with the 8.6 GHz radio continuum emission observed toward IRAS 165623959 (Guzmán et al., 2010). It appears that the SE-NW outflow is associated with the string of radio sources, the peak position of the blue-shifted and red-shifted lobes being symmetrically displaced from the bright central radio source. The SE blueshifted and NW redshifted lobes extend up to and from the central radio source, respectively. The symmetry axis of the SE-NW outflow is along a direction with a position angle of , roughly the same as the P.A. of the symmetry axis of the jet of . As noted in Guzmán et al. (2010), the radio lobes and the jet are not completely aligned, showing a small bending, which is also seen in the SE-NW outflow. Possible bending mechanisms of protostellar jets are discussed in Fendt & Zinnecker (1998), but with the available data we can not discern between the various alternatives.
The spectroscopic signatures of the HCO+() and C18O() transitions suggest that the bulk of the molecular gas toward IRAS 165623959 is undergoing large-scale inward motions (e.g. Sanhueza et al., 2010). Infalling motions traced by optically thick molecular lines are expected to produce line profiles showing blue asymmetry, whereas optically thin lines are expected to exhibit symmetrical profiles (Mardones et al., 1997).
4 ANALYSIS AND DISCUSSION
4.1 Ks-band evidence of shocked H2
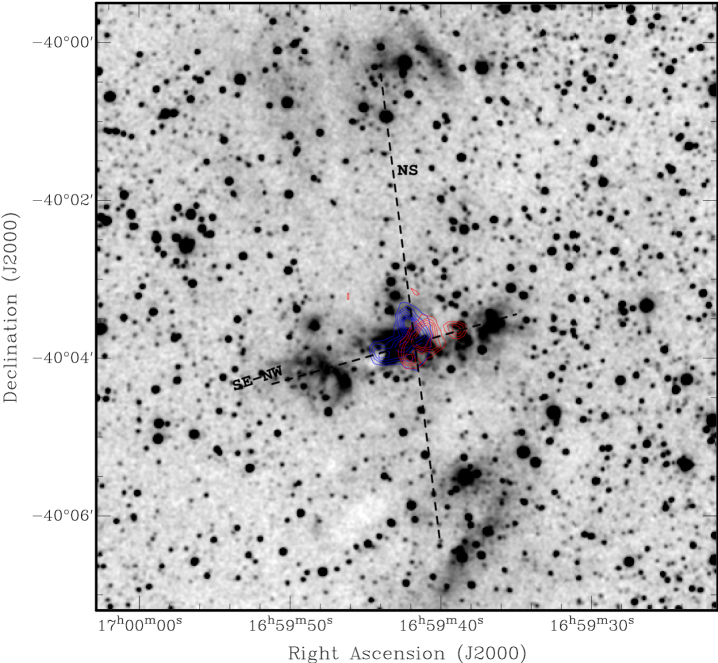
Figure 5 presents an image of the Two Micron All Sky Survey (2MASS, Skrutskie et al. 2006) -band emission across an region of the sky, centered near IRAS 165623959. Clearly seen toward the center is diffuse emission along the SE-NW direction extending by more than ′ on each side of the bright radio source. The position angle of this diffuse -band emission is , a value similar to that of the SE-NW molecular outflow. We suggest that the outer parts of this diffuse emission, which are at greater distances from the central jet than the molecular lobes, are tracing shocked H2-2.12 m gas produced by an older episode of mass ejection from the jet.
We note that the NIR (near infrared) emission detected close to the central jet comes mainly from a region associated with the SE blueshifted lobe. Much less emission is seen associated with the NW redshifted lobe (see also Fig. 4 from Guzmán et al. 2010). A similar situation has been observed in other bipolar outflows, for example in BHR 71 (Bourke, 2002). Most likely, the strong NIR emission from the eastern, closer to the jet, feature correspond to scattered light from the inner walls of the outflow cavity.
The second outflow detected toward IRAS 165623959 is roughly aligned in the north-south direction, having a symmetry axis with a position angle of . The blueshifted lobe extends up to to the north of the jet and the redshifted lobe up to to the south. Interestingly, Fig. 5 also shows the presence of diffuse -band emission roughly along the N-S direction but located about 3.4′ north and 2′ south from the NS molecular outflow. This emission exhibits a bow shock morphology, characteristic of HH objects, most likely produced by the interaction of a collimated flow with the ambient medium. However, as noted in Guzmán et al. (2010), this diffuse emission is bright in all mid-infrared MSX bands. In consequence, it is likely that this -band emission has an important NIR continuum component, in addition to the H2-2.12 m line.
We suggest that there is an independent source of energy driving the NS outflow, although from the available data we are not able to pinpoint its location. Guzmán et al. (2010) have already argued, on the basis that a re-orientation of the central jet in seems physically unfeasible, for the presence of two high-mass YSOs driving the outflows.
4.2 Parameters of the outflows
To compute physical parameters of the molecular outflows we followed the standard formalism described in Bourke et al. (1997), Garden et al. (1991) and Goldsmith & Langer (1999), assuming that the high velocity gas is optically thin and its excitational state can be described by a single excitation temperature. If the transitions are sub-thermally excited, then the derived excitation temperature would correspond to a lower limit of the kinetic temperature of the outflowing gas.
A general discussion of the sources of errors have been given by Margulis & Lada (1985) and Cabrit & Bertout (1990). The main sources of error arise from the difficulty in determining the contribution to the outflow in the velocity range of the ambient cloud, and not knowing the flow inclination. To be conservative we adopt as velocity boundary between the blue and red wing emission and the ambient emission the values of and km s-1, respectively.
4.2.1 Column densities and excitation temperatures
The column density of CO molecules in the velocity range is given by
| (1) |
where is the rotational excitation temperature in K, is the rotational quantum number of the lower state, is the energy of level , where is the rotational constant of the CO molecule. The frequency of the CO(+1) transition is , and is the opacity of the material moving at velocity (the latter measured in km s-1). Assuming a beam filling factor of 1, the observed main-beam brightness temperature is related to the opacity by
| (2) |
where is defined as
In the optically thin limit,
| (3) |
From the observations of the emission in the three transitions of CO it is possible to determine both the excitation temperature and column density of the outflowing gas using Eqs. (1) and (3), and taking K. Figure 6 presents plots of the velocity integrated emission versus the quantum number from the blueshifted and redshifted lobes of both outflows and from the ambient gas. The velocity intervals of integration for the blueshifted and redshifted emission are and km s-1, respectively. The areas over which the emission has been spatially integrated for the different outflow lobes are shown in Fig. 4. In the positions in which lobes overlap we assumed equal contributions from each lobe, except at offset position (″ ″) where we assumed that the contribution to the blueshifted emission from the NS and SE-NW outflows are in a 2:1 ratio. Dashed lines show the results of the best fit to the observed integrated emission assuming optically thin conditions and filling factors of 1. The derived CO column densities and excitation temperatures are given in Table 2. The parameters for the ambient cloud were derived using the spectra observed at offset position (, ), which does not show evidence of self-absorption nor high velocity gas.
One of the less well known physical parameter of the gas in molecular outflows is its kinetic temperature. Our observations of three lines of CO allowed us to determine the excitation temperature of both outflows, concluding that their kinetic temperatures are high. The derived excitation temperatures of the high-velocity gas are 145 and 120 K for the blueshifted and redshifted lobes of the SE-NW outflow, and 76 and 88 K for the blueshifted and redshifted lobes of the NS outflow. All these temperatures are considerably higher than the ambient cloud temperature, indicating that part of the energy used in accelerating the gas has also heated it.
4.2.2 Mass, momentum and momentum rates
The mass in the outflows can be computed from the derived column densities as,
| (4) |
where is given by Eq. (1), is the mean molecular mass per H2 molecule, [H2/12CO] the molecular hydrogen to carbon monoxide abundance ratio, the size of the emitting area in an individual position, and the sum is over all the observed positions.
The derived masses of the SE-NW and NS flows are given in Columns 2-4 of Table 3. Column 2 gives the mass of the outflows in the high-velocity (HV) ranges, computed using the column densities given in Table 2, , and . To estimate the contribution to the mass from the outflowing gas emitting in the same velocity range as the ambient cloud gas, referred as the low-velocity (LV) outflow gas, we followed the prescription of Margulis & Lada (1985). Using expression (A16) of Bourke et al. (1997), adopting as velocity boundary between the wing and ambient emissions values of km s-1 in the blue side and km s-1 in the red side, we estimate that the mass of the low velocity flow is 1.26 and 0.92 M⊙ for the SE-NW and NS flow, respectively. The total masses for the SE-NW and NS outflows are then 1.92 and 1.32 M⊙, respectively.
The momentum of the gas can be estimated from the first moment of the line emission. This procedure has the advantage of using the detailed information of the spectra. The derivation of flow kinematic and dynamical parameters by using moments of the spectrum has been described in detail by Calvet et al. (1983). For this purpose we used the CO() spectra since it has the best signal-to-noise ratio, but note that using any of the three transitions render consistent values within a 10%. In the low velocity range we selected km s-1, the ambient cloud velocity, as the limiting value between what we consider blue or red-shifted gas. The derived momentums are given in Columns 5-7 of Table 3. They were computed using the observed radial velocities, and thus correspond to strict lower limits. To correct for inclination they should be multiplied by a factor where is the angle between the flow and the line of sight.
The average momentum rates can be estimated from the second moment of the CO() spectra, from the expression
| (5) |
where is the term that multiplies the integral in the right hand side of Eq. (1), and we select as indicated previously. The opacity can be estimated from Eq. (3) in the optically thin limit. The characteristic radius of the flow, , is a sensitive parameter that regulates the size of the flow and the time scale (after dividing it by the flow velocity) over which the momentum has been deposited in the pre-stellar core. In Eq. (5), we consider as the projected radius, taken as the length subtended by 30″ (0.23 pc at 1.6 kpc) for the high-velocity flow; and as the length subtended by 20″ for the low-velocity gas. The momentum rates derived for the outflows, with no correction for inclination, are given in cols. 8-10 of Table 3. A correction for inclination will require to multiply by the factor .
Toward each of the lobes of the SE-NW flow we observe wing emission at both blueshifted and redshifted velocities. This allows us to make an estimate of its inclination using the expression (Cabrit & Bertout, 1990, 1986)
where is the ratio between maximum observed blueshifted and redshifted velocities toward a single lobe, and is half of the total aperture angle of the outflow. We estimate the later from the 2-MASS -band image, obtaining a value of . Using this and the observed values of R, we derive an inclination angle for the SE-NW outflow of 80. Correction factors for the momentum and momentum rate are then 5.8 and 33, respectively. The inclination-corrected momentum of the SE-NW flow is and the inclination-corrected momentum rate (calculated with Eq. 5) is yr-1.
One of the principal problems of the previous estimation is that one assumes that the momentum has been injected into the molecular gas continuously, despite the molecular high velocity gas and the radio images evidence that the emission comes from discrete episodes of mass ejection. Therefore, the momentum rates calculated are time-averaged over the history of mass ejections from the protostar, that probably includes long periods of inactivity.
The momentum flux of the ionized jet reported by Guzmán et al. (2010) —corrected for 80 inclination— is M⊙ km s-1 yr-1, while that of the associated SE-NW molecular flow ( yr-1) is approximately 70 times greater. Also, the observed momentum of the flow could not have been deposited in the ambient gas by such a jet in less than 105 yr, a time larger than the estimated life of the YSO. A possible solution to this inadequacy of the jet as the driving source of the molecular outflow could be that the protostellar jet is only partially ionized, being its mass and momentum loads greater than the estimated ones.
4.3 Further tracers of shocks
In addition to the high-velocity CO gas and its high excitation temperature, further evidence for the presence of shocks is provided by the detection of SiO emission. SiO is thought to be generated when strong shocks pass through dense molecular gas disrupting dust grains (Hartquist et al., 1980; Caselli et al., 1997). Therefore, we expect that SiO emission should be associated with the outflowing gas. This suggestion is strongly supported by the almost identical shape of the profile of the high velocity outflowing gas emission observed in the HCO+() line and the SiO() profile (see next section and bottom panel of Fig. 2).
The observed velocity integrated SiO emission is K km s-1. Assuming the SiO line is emitted in optically thin conditions with an excitation temperature of 75 K, we derive a column density of SiO of 7.8 cm-2. Assuming K only changes this value by 3%. The critical density for the SiO() transition is cm-3, considerable larger than the ambient density, indicating that thermal collisions with ambient H2 is not the main mechanism for excitation to this rotational state. The good correlation between the SiO emission and the high velocity component suggests that this mechanism is shock excitation of the gas.
There are three OH masers reported in the literature toward the region (Caswell, 1998, 2004). Figure 4 shows their positions with green crosses. The closest to the peak of the SE blue-shifted lobe corresponds to a 1720 MHz OH maser, which has an LSR velocity of km s-1. The 1720 MHz OH masers are usually associated with shocked gas (Brogan, 2007), and the location and velocity of this particular one is consistent with it being pumped by the shock produced by the high velocity blueshifted flow. Caswell (2004) reported Zeeman splitting on this maser implying a mG magnetic field, the latter probably enhanced through shock compression. We also note that the excitation temperature of the outflowing gas —derived in §4.2.1— is above the minimum temperature required to pump this maser collisionally ( K, Elitzur, 1976; Hoffman et al., 2003). We conclude that this maser is associated with the IRAS 165623959 core and to the shocked gas in the SE-NW outflow, and not located farther away at kpc as previously suggested by Caswell (2004).
The other two masers correspond to 1665/1667 MHz OH masers: one is coincident with the central jet source (km s-1) and the other, located about 15.6″ NE from the jet ( km s-1), is associated with a mid infrared source in the field, unseen in 2MASS but conspicuous in Spitzer 8.0m band (see Fig. 4 from Guzmán et al. 2010).
4.4 Infall of molecular core
To derive infall parameters we modeled the HCO+() profile using the simple analytic model of contracting clouds of Myers et al. (1996). We first subtracted a broad Gaussian profile, shown as a dash-dotted line in the upper panel of Fig. 2, to take into account the contribution of the high velocity outflow. We note that the shape of the subtracted Gaussian is very similar to the profile of the SiO() emission which is expected to come mainly from the outflowing gas. This is illustrated in the bottom panel of Fig. 2, which shows the SiO() spectrum and superimposed the broad Gaussian profile fitted to the HCO+() emission (scaled by a factor of 1/14).
The simple model can very well fit the observed profile (see top panel of Fig. 2). The parameters of the best fitting collapse model are: an infall velocity () of 0.35 km s-1, a velocity dispersion () of 1.54 km s-1, an optical depth () of , a kinetic temperature of K, and a rest-frame velocity of the collapsing envelope of km s-1. This velocity is about 1 km s-1 greater than the ambient cloud velocity adopted here, but we note that Bronfman et al. (1996) also reported a velocity of km s-1 in the CS(21) transition detected towards this source.
In order to estimate the envelope accretion rate we consider the mass distribution model for the parent cloud derived from dust emission in Guzmán et al. (2010). Assuming that the extent of the contracting gas along the line of sight is comparable to the size of the cloud of about 0.7 pc FWHM (1.5 ′ at 1.6 Kpc) and using the derived values of the infall speed, molecular density, and core size, we obtain a mass infall rate of M⊙ yr-1, a value one order of magnitude below the estimation from the SED fitting reported by Guzmán et al. (2010). The value derived for the infall velocity is also about one order of magnitude below the free-fall velocity expected for the entire cloud, suggesting a retarded collapse.
5 SUMMARY
We undertook molecular line observations toward the IRAS 165623959 massive and dense core in three CO transitions: CO(32), CO(65), and CO(76), using APEX, with angular resolutions ranging from 8″ to 17″. Additionally, HCO+(), C18O() and SiO() observations were performed towards the center of the core. The main results and conclusions presented in this paper are summarized as follows:
-
1.
High velocity molecular gas was detected in the three CO transitions, spanning a range in radial velocity of .
-
2.
The morphology of the high velocity emission, best shown in the CO() and CO() lines, is quadrupolar. We conclude that this morphology is due to the presence of two collimated bipolar outflows, one lying in the SE-NW direction and another in the N-S direction. The more extended bipolar flow is in the SE-NW direction, consistent with being excited by the ionized jet detected toward this MYSO (Guzmán et al., 2010). Extended -band emission probably tracing excited H2-2.12 m is also associated with the SE-NW flow.
-
3.
From an analysis of the emission in the three CO lines we derive that the excitation temperature of the high-velocity gas, assumed optically thin, is high, with values of in the lobes of the SE-NW outflow and in the lobes of the N-S outflow. This suggests that the excitation of the gas is related with the acceleration mechanism, namely, shock-induced acceleration.
-
4.
The total mass in the SE-NW and NS outflows are, respectively, 1.9 and 1.3 M⊙. The momentum and momentum rates derived for the SE-NW outflow, corrected for an inclination angle of 80, are 89 M⊙ km s-1 yr-1 and M⊙ km s-1 yr-1, respectively. These values are characteristics of flows driven by young massive stellar objects with high luminosities.
-
5.
The molecular core in which the outflow is embedded presents evidence of being in gravitational contraction as shown by the blue asymmetric peak seen in the HCO+() transition observations. The derived mass infall rate is of the order of a few times M⊙ yr-1 and the infall velocity is km s-1, which is a factor of below the velocity expected from a free-fall collapse. This implies that the collapse has been retarded and not gravitationally dominated.
| Line | Frequency | Tel. | Beam | Map | Spacing | Noise | ||
|---|---|---|---|---|---|---|---|---|
| [GHz] | [″] | [″] | [km s-1] | [K] | ||||
| CO() | 345.796 | APEX | 20″ | |||||
| CO() | 691.627 | APEX | 4″ | |||||
| CO() | 806.898 | APEX | 4″ | |||||
| SiO() | 347.331 | APEX | 20″ | |||||
| HCO+() | 356.734 | ASTE | Central Pos. | — | 0.11 | 0.1 | ||
| C18O() | 329.331 | ASTE | Central Pos. | — | 0.43 | 0.05 |
| Lobe | V range | N | T |
|---|---|---|---|
| (km s-1) | (1016 cm-2) | (K) | |
| Blue SE | 8.72 | 145 | |
| Red NW | 6.06 | 120 | |
| Blue N | 5.70 | 76 | |
| Red S | 3.37 | 88 | |
| Ambient | 11.30 | 54 |
| Mass | MomentumbbNot corrected for inclination. | Momentum ratebbNot corrected for inclination. | |||||||
|---|---|---|---|---|---|---|---|---|---|
| Outflow | ( M⊙) | ( M⊙ km s-1) | () | ||||||
| HV | LV | Total | HV | LV | Total | HV | LV | Total | |
| SE-NW outflow | |||||||||
| Blue SE | 0.39 | 0.61 | 1.00 | 5.8 | 2.9 | 9.7 | 4.3 | 1.2 | 5.5 |
| Red NW | 0.27 | 0.65 | 0.92 | 3.5 | 3.1 | 6.6 | 2.2 | 1.3 | 3.5 |
| Total | 0.66 | 1.26 | 1.92 | 9.3 | 6.0 | 15.3 | 6.5 | 2.5 | 9.0 |
| NS outflow | |||||||||
| Blue N | 0.25 | 0.49 | 0.74 | 3.4 | 2.4 | 5.8 | 3.3 | 1.0 | 4.3 |
| Red S | 0.15 | 0.43 | 0.58 | 1.9 | 2.0 | 3.9 | 1.7 | 0.8 | 2.5 |
| Total | 0.40 | 0.92 | 1.32 | 5.3 | 4.4 | 9.7 | 5.0 | 1.8 | 6.8 |
References
- Benjamin et al. (2003) Benjamin, R. A., et al. 2003, PASP, 115, 953
- Beuther et al. (2002) Beuther, H., Schilke, P., Sridharan, T. K., Menten, K. M., Walmsley, C. M., & Wyrowski, F. 2002, A&A, 383, 892
- Bourke (2002) Bourke, T. L. 2002, in The Origin of Stars and Planets: The VLT View, ed. J. F. Alves & M. J. McCaughrean, 247
- Bourke et al. (1997) Bourke, T. L., et al. 1997, ApJ, 476, 781
- Brogan (2007) Brogan, C. L. 2007, in IAU Symposium, Vol. 242, IAU Symposium, ed. J. M. Chapman & W. A. Baan, 299–306
- Bronfman et al. (1996) Bronfman, L., Nyman, L.-A., & May, J. 1996, A&AS, 115, 81
- Cabrit & Bertout (1986) Cabrit, S., & Bertout, C. 1986, ApJ, 307, 313
- Cabrit & Bertout (1990) —. 1990, ApJ, 348, 530
- Calvet et al. (1983) Calvet, N., Canto, J., & Rodriguez, L. F. 1983, ApJ, 268, 739
- Caselli et al. (1997) Caselli, P., Hartquist, T. W., & Havnes, O. 1997, A&A, 322, 296
- Casoli et al. (1986) Casoli, F., Combes, F., Dupraz, C., Gerin, M., & Boulanger, F. 1986, A&A, 169, 281
- Caswell (1998) Caswell, J. L. 1998, MNRAS, 297, 215
- Caswell (2004) —. 2004, MNRAS, 349, 99
- Chambers et al. (2009) Chambers, E. T., Jackson, J. M., Rathborne, J. M., & Simon, R. 2009, ApJS, 181, 360
- Cyganowski et al. (2008) Cyganowski, C. J., et al. 2008, AJ, 136, 2391
- Elitzur (1976) Elitzur, M. 1976, ApJ, 203, 124
- Ezawa et al. (2004) Ezawa, H., Kawabe, R., Kohno, K., & Yamamoto, S. 2004, in Society of Photo-Optical Instrumentation Engineers (SPIE) Conference Series, Vol. 5489, Society of Photo-Optical Instrumentation Engineers (SPIE) Conference Series, ed. J. M. Oschmann Jr., 763–772
- Faúndez et al. (2004) Faúndez, S., Bronfman, L., Garay, G., Chini, R., Nyman, L.-Å., & May, J. 2004, A&A, 426, 97
- Fendt & Zinnecker (1998) Fendt, C., & Zinnecker, H. 1998, A&A, 334, 750
- Garden et al. (1991) Garden, R. P., Hayashi, M., Hasegawa, T., Gatley, I., & Kaifu, N. 1991, ApJ, 374, 540
- Goldsmith & Langer (1999) Goldsmith, P. F., & Langer, W. D. 1999, ApJ, 517, 209
- Güsten et al. (2006) Güsten, R., Nyman, L. Å., Schilke, P., Menten, K., Cesarsky, C., & Booth, R. 2006, A&A, 454, L13
- Güsten et al. (2008) Güsten, R., et al. 2008, in Society of Photo-Optical Instrumentation Engineers (SPIE) Conference Series, Vol. 7020
- Guzmán et al. (2010) Guzmán, A. E., Garay, G., & Brooks, K. J. 2010, ApJ, 725, 734
- Hartquist et al. (1980) Hartquist, T. W., Dalgarno, A., & Oppenheimer, M. 1980, ApJ, 236, 182
- Hoffman et al. (2003) Hoffman, I. M., Goss, W. M., Brogan, C. L., Claussen, M. J., & Richards, A. M. S. 2003, ApJ, 583, 272
- Klein et al. (2006) Klein, B., Philipp, S. D., Krämer, I., Kasemann, C., Güsten, R., & Menten, K. M. 2006, A&A, 454, L29
- López et al. (2011) López, C., Bronfman, L., May, J., Nyman, L.-A., & Garay, G. 2011, A&A in press
- Lumsden et al. (2002) Lumsden, S. L., Hoare, M. G., Oudmaijer, R. D., & Richards, D. 2002, MNRAS, 336, 621
- Mardones et al. (1997) Mardones, D., Myers, P. C., Tafalla, M., Wilner, D. J., Bachiller, R., & Garay, G. 1997, ApJ, 489, 719
- Margulis & Lada (1985) Margulis, M., & Lada, C. J. 1985, ApJ, 299, 925
- Myers et al. (1996) Myers, P. C., Mardones, D., Tafalla, M., Williams, J. P., & Wilner, D. J. 1996, ApJ, 465, L133
- Risacher et al. (2006) Risacher, C., et al. 2006, A&A, 454, L17
- Sanhueza et al. (2010) Sanhueza, P., Garay, G., Bronfman, L., Mardones, D., May, J., & Saito, M. 2010, ApJ, 715, 18
- Skrutskie et al. (2006) Skrutskie, M. F., et al. 2006, AJ, 131, 1163
- Urquhart et al. (2008) Urquhart, J. S., et al. 2008, A&A, 487, 253