Adjusted closing prices
Vic Norton
Department of Mathematics and Statistics
Bowling Green State University
21–May–2010
ABSTRACT
Historical returns depend on historical closing prices and distributions. We describe how to compute adjusted closing prices from closing price/distribution data with an emphasis on spreadsheet implementation. Then the growth of a security from one date to another (1 + total return) is just the ratio of the corresponding adjusted closing prices.
1 The Growth Ratio
If and are the closing prices of a given security on two successive business days, then the value of the security grows by (decimal, percent) over the second business day, where . Here we assume that the second business day is not an ex-day corresponding to a declared distribution or split.
If day two is an ex-dividend day for a distribution of dollars per share, then the security starts from an effective price of at the end of the first day and grows to the price over the course of day two. In this case the growth ratio should be defined as
| (1d) |
with the percentage growth again being . Of course equation (1d) can apply to a non-ex-day as well. Just set equal to zero. After an : 1 split the effective starting price is , and the growth ratio is
| (1s) |
Splits can be also thought of as distributions. An : 1 split corresponds to a distribution.
2 Adjusted Closing Prices
Start with sequences of successive closing prices and distributions of a given security. Define the corresponding growth ratios by
| (1) |
We will refer to any sequence of positive numbers as adjusted closing prices for the security if
| (2) |
Then the growth ratio of the security for the duration under consideration is
| (3) |
and the percentage growth or total return is .
See Investopedia for a less abstract description of how to compute the adjusted closing price of a stock.
3 Dividend Reinvestment
If one buys shares of a security at closing price , then the value of the investment is . Suppose that dividends are reinvested automatically and that the number of shares and the closing prices over the next business days are and , respectively. Then the growth ratio of the investment over the -th business day should clearly be the ratio of the value of the investment at the close of day to its value at the close of day :
| (4) |
By equating the of (1) with the of (4) we see that
| (5) |
Thus the new shares are precisely what can be purchased with the dividend at the “ex-closing-price” .
4 Spreadsheet Considerations
Suppose successive closing prices , distributions , and growth ratios (as computed by (1)) are recorded as three columns of a spreadsheet. The formulas
| (FILL+) | ||||
| (FILL –) |
then allow one to fill in adjusted closing prices from an arbitrary base adjusted closing price on any given business day. If the time direction is up, enter the right-hand formula of the (FILL+) equation in the cell above the base price (now ) and “Fill Up” from there, and enter the right-hand formula of the (FILL –) equation in the cell below the base price (now ) and “Fill Down” from this cell. In this way all adjusted closing prices can be in filled in, up or down, from the base adjusted closing price. (If the time direction is down, one should “Fill Down” with FILL+ and “Fill Up” with FILL –.)
The following spreadsheet image illustrates the procedure. The adjusted closing price of iShares Barclays 1-3Yr Tearsury Bond Fund (SHY) is arbitrarily set at 100.000 on December 14, 2007. All other adjusted closing prices are filled up or down from this base price using (FILL+) or (FILL –), respectively. (The empty distribution cells are computed as zero.)
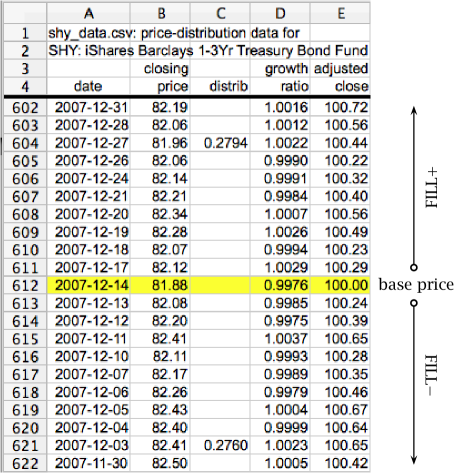
The growth of SHY in December 2007 is measured by the ratio of its 2007-12-31 adjusted closing price to its 2007-11-30 price,
Thus SHY gained 0.3% in December 2007. The ratio, 1.003, is also the product of the December growth ratios: .
5 Data
Here are two comma-separated-value (spreadsheet) files, shy_data.csv and eem_data.csv, with closing price, distribution, and adjusted closing price data for
| SHY: | iShares Barclays 1-3Yr Treasury Bond Fund |
| EEM: | iShares MSCI Emerging Markets Index Fund |
respectively. The graphs of these adjusted closing price data are shown in Figure 2.
with base price on 2006-12-29
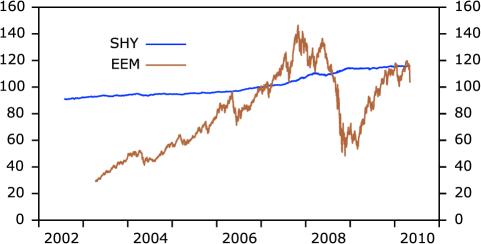
We have chosen the bond fund SHY because has lots distributions to work with, generally one per month. On the other hand the equity fund EEM illustrates how splits are handled; the shares of EEM split 3 for 1 in 2005 and again in 2008.
One can get historical closing prices for any security at
Yahoo! FINANCE
or more specifically, for our funds, at
http://finance.yahoo.com/q/hp?s=SHY+Historical+Prices
http://finance.yahoo.com/q/hp?s=EEM+Historical+Prices
Dividends and splits can be found here as well, but unfortunately some dividends
may be missing. For example Yahoo! FINANCE
is missing the 27-Dec-2007 SHY
dividend of $0.2794 per share shown in Figure 1.
Yahoo! FINANCE also gives adjusted closing prices, but, because of missing dividends, these prices may be inaccurate. Consider SHY for example. The Yahoo’s 2007-12-31 adjusted closing price is less than its 2007-11-30 adjusted closing price. Thus Yahoo! FINANCE would have you believe that SHY lost money in December 2007, when, in fact, SHY gained 0.3% in this month—as we have just seen.
The best place to get iShares distribution data is from the horse’s mouth: go to
http://us.ishares.com/product_info/fund/
click on the desired fund and then on the Distributions tab. In our case
http://us.ishares.com/product_info/fund/distributions/SHY.htm
http://us.ishares.com/product_info/fund/distributions/EEM.htm
will get you all distributions of SHY and EEM, respectively.
6 Closing Remarks
All of this material probably appears elsewhere. We just don’t know where.
References
- [1] Investopedia. How do I calculate the adjusted closing price for a stock? http://www.investopedia.com/ask/answers/06/adjustedclosingprice.asp.