Hierarchical formation of bulgeless galaxies II: Redistribution of angular momentum via galactic fountains
Abstract
Within a fully cosmological hydrodynamical simulation, we form a galaxy which rotates at 140 kms-1, and is characterised by two loose spiral arms and a bar, indicative of a Hubble Type SBc/d galaxy. We show that our simulated galaxy has no classical bulge, with a pure disc profile at z=1, well after the major merging activity has ended. A long-lived bar subsequently forms, resulting in the formation of a secularly-formed “pseudo” bulge, with the final bulge-to-total light ratio B/T=0.21. We show that the majority of gas which loses angular momentum and falls to the central region of the galaxy during the merging epoch is blown back into the hot halo, with much of it returning later to form stars in the disc. We propose that this mechanism of redistribution of angular momentum via a galactic fountain, when coupled with the results from our previous study which showed why gas outflows are biased to have low angular momentum, can solve the angular momentum/bulgeless disc problem of the cold dark matter paradigm.
keywords:
galaxies: evolution–galaxies: formation–galaxies: bulges galaxies: spiral1 Introduction
The cold dark matter paradigm successfully explains many properties of large scale structure observed in the Universe (Blumenthal et al., 1984). On galactic scales, however, some problems exist which cast doubt on the properties of dark matter, and the assumption that it is non-relativistic (cold), not the least of which is the “angular momentum problem”.
The angular momentum of disc galaxies is imparted by torques from large scale structure on dark matter and gas at the time at which they begin to collapse under gravity (Peebles, 1969; Barnes & Efstathiou, 1987). Disc galaxies will form, under the assumption that the angular momentum of the gas is conserved as it cools to the centre of the dark matter halo in which it resides (Fall & Efstathiou, 1980; White, 1984). Problems with this picture of disc galaxy angular momentum acquisition were highlighted in hydrodynamical cosmological simulations, which showed that when gas cools to the centre of dark matter halos and forms stars, subsequent merging of the resultant proto-galaxies results in the catastrophic loss of angular momentum (Navarro & White, 1994). This resulted in galaxies dominated by spheroidal components which were deficient in angular momentum when compared to their observed counterparts (Navarro & Steinmetz, 2000). A closely related issue is that bulges form during mergers, as gas loses angular momentum and rapidly cools to form stars in the centre of the galaxy (Barnes & Hernquist, 1996). These aspects of the angular momentum problem have significantly improved with better modelling and resolution of feedback processes, thus preventing stars from rapidly forming in the central regions of the early collapsing dark matter halos (Thacker & Couchman, 2001; Brook et al., 2004; Governato et al., 2007). This is reflected in recent simulations showing improved matches to the Tully-Fisher relation (Governato et al. 2007; Agertz et al. 2010; Guedes et al. 2011, see also Section 3 in this paper).
Another manifestation of the problem is that the angular momentum distribution of simulated dark matter halos differs markedly from that of observed galaxies. This is in conflict with the assumption that the distribution of the angular momentum of gas and dark matter are the same, an assumption which holds in non-radiative hydro-dynamical simulations (van den Bosch et al., 2002; Sharma & Steinmetz, 2005). In particular, dark matter halos have a significant amount of low angular momentum material (Bullock et al., 2001), and in models of galaxy formation the corresponding low angular momentum baryons are expected to form a bulge component (van den Bosch, 2001).
By contrast, many observed disc galaxies do not have bulge components (e.g. Allen et al. 2006; Kautsch 2009; Cameron et al. 2009), and have angular momentum distributions that lack the significant amounts of low angular momentum that is found in dark matter halos (van den Bosch et al., 2001). The situation is worsened considerably when one considers that many bulges have characteristics that indicate that they were formed secularly by processes within the disc itself, rather than being related to merging or cold dark matter structure formation (Kormendy & Kennicutt, 2004; Kormendy et al., 2010).
The most recent simulations of massive disc galaxies continue to form classical bulges, (B/T=0.19 in Agertz et al. 2010, and B/T=0.25 in Guedes et al. 2011, see also Scannapieco et al. 2010; Stinson et al. 2010; Brooks et al. 2011). We note that in the Guedes et al. (2011) paper, the authors claim that their bulge is secular in nature, based on the low Sérsic index of the bulge in their two component bulge+disc decomposition. However, they also state that their B/T has doubled since , indicating that their bulge is at least partially classical. These latest simulations have nevertheless formed significantly improved realisations of L∗ disc galaxies. Yet the angular momentum problem, and the associated problem of forming disc galaxies which do not have classical bulges, remains a serious challenge for the cold dark matter paradigm.
Assuming the verity of the cold dark matter paradigm, it would seem that the resolution of the angular momentum problem requires either the ejection or redistribution of low angular momentum material. Ejection of low angular momentum material has certainly been proposed (Binney et al., 2001; Maller & Dekel, 2002; Dutton & van den Bosch, 2009). Indeed, the ejection of low angular momentum gas by supernova explosions was shown to be key to the success of the first simulated bulgeless dwarf galaxies, which share many characteristics with observed dwarf galaxies (Governato et al., 2010; Oh et al., 2011). The processes which result in the ejection of low angular momentum gas from low mass galaxies, and the key role this has in suppressing bulge formation, were outlined in Brook et al. (2011, Paper I).
The large scale ejection of low angular momentum gas meshes well with the need to enrich the IGM (Mac Low & Ferrara, 1999; Oppenheimer & Davé, 2006; Shen et al., 2010), and also with the observed low baryonic mass fraction of low mass galaxies (e.g. Klypin et al. 1999; Mandelbaum et al. 2006; Koposov et al. 2008; Guo et al. 2010; Moster et al. 2010). However, in the absence of AGN feedback, more massive galaxies with larger potential wells will have greater difficulty ejecting their gas. This is reflected in the strength of the relationship between total mass and the baryonic mass fraction; higher mass disc galaxies have significantly higher baryonic mass fractions, retaining a far larger proportion of the cosmic baryon fraction. This means that the large scale outflow of low angular momentum gas is not likely to explain the fact that many massive disc galaxies do not have classical bulges (Kormendy et al., 2010).
Thus, processes which redistribute low angular momentum material may be necessary in higher mass disc galaxies. In this paper, we propose that galactic fountains are an effective mechanism for such redistribution. It is generally accepted that supernova-powered bubbles drive gas out of the galactic disc and through the halo. The expelled gas eventually falls back onto the disc, a mechanism known as a galactic fountain (Shapiro & Field, 1976; Bregman, 1980). Here, we examine galactic fountains on larger scales, both spatially and temporally, by examining the fate of gas expelled from the inner regions of galaxies as they are assembling their mass at high redshift. It is well established that supernova-driven winds can result in gas outflows (Mathews & Baker, 1971; Veilleux et al., 2005) and that starbursts trigger strong outflows from the central regions, particularly during merger events (Chevalier & Clegg, 1985; Heckman et al., 1990; Strickland & Heckman, 2007; Tremonti et al., 2007). Outflows are expected, and indeed observed to be more common at high redshift where star formation is more active, and potential wells shallower (Madau et al., 1996; Pettini et al., 1998, 2000; Simcoe et al., 2002; Shapley et al., 2003; Adelberger et al., 2005). The bipolar structure at the Galactic centre (Bland-Hawthorn & Cohen, 2003; Su et al., 2010) lends support for galactic scale outflows from the central regions, even locally. The fate of such outflowing gas is not well constrained. As explained above, there is reason to believe that large amounts of the gas will be lost from low mass galaxies, but it is likely that some or even most of the outflowing gas will cool back to the star forming region of higher mass galaxies.
Our model is based on analysis of our fully hydrodynamical cosmological galaxy formation simulations. Our simulation programme is running disc galaxies which span four orders of magnitude in stellar mass, from dwarf to , all using the same resolution and input physics. We note that this input physics is similar to that which simulated the first bulgeless dwarf galaxies (Governato et al., 2010), and that we reproduce all the features of those successful simulations in our dwarfs. The simulation presented here also has similar input physics and resolution to the recent simulation of Guedes et al. (2011), which formed a much improved realisation of an L∗ galaxy. Here we examine a simulated disc galaxy in an intermediate mass range, where the majority of observed isolated galaxies are dominated by their disc components.
The paper proceeds by providing details of the simulation (Section 2), and then describes the properties of the simulated galaxy (Section 3), and in particular we show that the simulated galaxy has no classical bulge. In Section 4, we identify gas which is blown from the bulge region and returns via the galactic fountain to form stars at later times, and show that this re-accreted gas has gained angular momentum before it forms stars. In Section 5 we discuss our modelling of feedback from supernovae and its effect on the ISM, central energy sources and angular momentum transport. We conclude (Section 6) that galactic fountains are effective in redistributing the angular momentum of gas, and propose that this mechanism plays a crucial role in reconciling observed massive disc galaxies which do not have classical bulges with the CDM paradigm.
2 The Simulation
The simulation described here is a cosmological zoom simulation derived from the McMaster Unbiased Galaxy Simulations (MUG S). See Stinson et al. (2010) for a complete description of how those galaxies were selected and their initial conditions were created. Here, those initial conditions are scaled down, so that rather than residing in a 68 Mpc cube, it is inside a cube with 34 Mpc sides. This resizing allows us to compare galaxies with exactly the same merger histories at a variety of masses. We selected a MUGs galaxy (15784) which had a prominent disk component for this study. The virial mass of the simulated galaxy in this study is M⊙
The simulation is evolved with the smoothed particle hydrodynamics (SPH) code gasoline (Wadsley et al., 2004). gasoline employs cooling due to H, He, and a variety of metal lines, and is described in detail in Shen et al. (2010). The metal cooling grid is constructed using CLOUDY (version 07.02, Ferland et al. 1998), assuming ionisation equi- librium. A uniform ultraviolet ionising background, Haardt & Madau (1996) is used in order to calculate the metal cooling rates self-consistently.
Two mechanisms are used to prevent gas from collapsing to higher densities than SPH can physically resolve: (i) to ensure that gas resolves the Jeans mass and does not artificially fragment, pressure is added to the gas according to Robertson & Kravtsov (2008), (ii) a maximum density limit is imposed by setting a minimum SPH smoothing length of 0.25 times that of the gravitational softening length of 155pc. We have 9 million resolution elements (1.1 gas+5.3 dark matter+2.3 star) within the virial radius at , with mean stellar particle mass of 6400 M⊙.
2.1 Star Formation and Feedback
When gas reaches cool temperatures ( K) in a dense environment ( cm-3), it becomes eligible to form stars. This value for is the maximum density gas can reach using gravity, . Such gas is converted to stars according to the equation
| (1) |
Here, is the mass of the star particle formed, is the timestep between star formation events, 0.8 Myrs in these simulations, is the mass of the gas particle and is the gas particle’s dynamical time. is the efficiency of star formation, in other words, the fraction of gas that will be converted into stars during .
Stars feed energy back into the interstellar medium gas where they formed. Two types of energetic feedback are considered in these simulations, supernovae and stellar radiation. Supernova feedback is implemented using the blastwave formalism described in Stinson et al. (2006) and deposit erg of energy into the surrounding medium. Since this gas is dense, the energy would be quickly radiated away due to the efficient cooling. For this reason, cooling is disabled for particles inside the blast region and for the length of time given in McKee & Ostriker (1977). Here, erg, is the ambient hydrogen density, and where is the ambient pressure and k is the Boltzmann constant. Both and are calculated using the SPH kernel for the gas particles surrounding the star.
Metals are ejected from type II supernovae (SNII), type Ia supernovae (SNIa), and the stellar winds driven from asymptotic giant branch (AGB) stars. Ejected mass and metals are distributed to the nearest neighbour gas particles using the smoothing kernal. Details of the manner in which metals are incorporated into the code are found in Stinson et al. (2006). The prescribed SNII and SNIa yields have been updated in this study. The SNII oxygen and iron use fits to Woosley & Weaver (1995). For SNIa, we use the W7 yields from Table 1 in Nomoto et al. (1997). Metal diffusion is also included, such that unresolved turbulent mixing is treated as a shear-dependent diffusion term, as described in Shen et al. (2010). The allows proximate gas particles to mix their metals. Metal cooling is calculated based on the diffused metals.
The effects of stellar radiation have only recently begun to be considered in galaxy simulations (Hopkins et al., 2011). Here, we model the luminosity of stars using the Bressan et al. (1993) mass-luminosity relationship. Typically, this relationship leads to ergs of energy being released from the high mass stars over the course of the 0.8Myr between star formation calculations. These photons do not couple efficiently with the surrounding ISM (Freyer et al., 2006). We thus do not want to couple all of this energy to the surrounding gas in the simulation. To mimic this highly inefficient energy coupling, we inject 10% of the energy as thermal energy in the surrounding gas, and cooling is not turned off for this form of energy input. It is well established that such thermal energy injection is highly inefficient at the spatial and temporal resolution of the type of cosmological simulations used here (Katz, 1992). This is primarily due to the characteristic cooling timescales in the star forming regions being lower than the step time of the simulations. The dynamical effect of this feedback is negligible, as is the overall coupling of energy to the ISM, but high mass star radiation feedback does reduce star formation in the region immediately surrounding a recently formed star particle (full details of this radiative feedback will be presented in a separate paper, Stinson et al. in prep).
3 The Simulated Galaxy: Properties
The simulated galaxy has a total stellar mass of , an HI mass of and a total gas mass (within Rvir) of . The value fits right in the middle of the relation for observed galaxies Verheijen et al (2010). The disc has a metallicity which peaks at , while the cold gas has . The simulated galaxy’s merger history is referred to in the analysis which follows. The interaction of the last major merger (mass ratio 2:1) begins at , with coalescence finished by and is followed rapidly by 2 other significant merger events (mass ratios of 10:1 and 20:1). We identify the period between and as the galaxy’s “merger epoch”. Since , several dark matter merger events occur, but these are too low in mass to contain baryons.
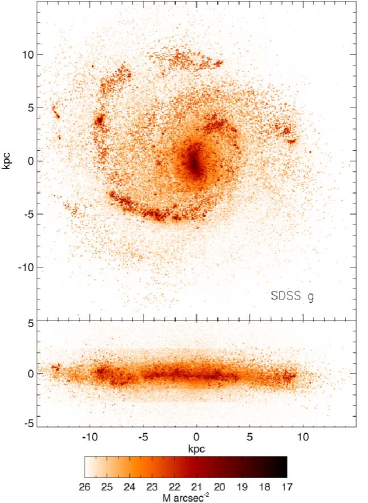
In Figure 1, we plot the surface brightness profile at in the SDSS g-band, shown face-on and edge-on. The loose spiral arms are indicative of a late type galaxy. The existence of a bar is also evident, and we contend that the simulated galaxy would be classified as SBc/d. These surface profile maps were created with Sunrise (Jonsson, 2006) which allows us to measure the dust reprocessed spectral energy distribution (SED) of every resolution element of our simulated galaxies from the far UV to the far IR with a full 3D treatment of radiative transfer. We assume a simple relationship between metallicity of gas, which is traced in the simulations, and dust by using a constant dust-to metals ratio of 0.4 Dwek (1998). Filters mimicking those on major telescopes are used to create mock observations. Sunrise uses Monte Carlo techniques to calculate radiation transfer through astronomical dust, including such effects in the determination of SEDs.
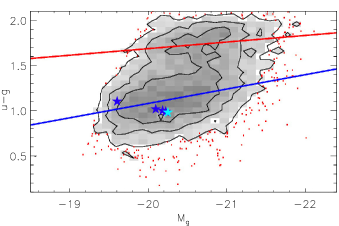
The galaxy sits in the blue cloud in the Mg, - colour magnitude diagram of SDSS galaxies, reproduced from Blanton (2006) in Figure 2, with the trend lines of the blue and red clouds indicated. The simulated galaxy is shown as star symbols; the light blue star shows the face-on values, while the dark blue stars show various angles of inclination (0∘, 30∘, 45∘, 60∘ and 90∘), with greater inclination resulting in redder colours and lower magnitudes. The inclusion of the effects of dust reprocessing explains the significantly lower luminosity and redder colour of the simulation when seen edge-on.
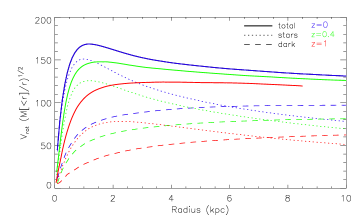
The rotation curve (V) of the simulation is shown in Fig. 3 at (blue line), (green) and (red). Also shown are the contributions from stars (dotted lines) and dark matter (dashed) at those times. The flat curve at reflects the success of our simulation in preventing excessive star formation in the central regions during the merger epoch. The curve is not perfectly flat, and perhaps indicates that the secular processes which build the bulge may be too efficient, and also indicates that, despite significant improvements, our simulations do not yet exactly reproduce the mass distribution of real galaxies.
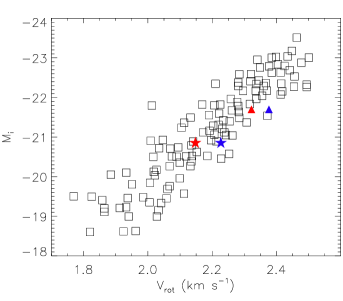
We plot the observed Tully-Fisher relation using data from Pizagno et al. (2007) who plot the SDSS i-band magnitudes against V80, the rotation velocity at the radius which encompass 80 of the i-band flux (open squares). Our simulated galaxy is overplotted using star symbols, where we show V80 (red star) to mimic the observations, as well as Vmax (blue star), to show that the degree of the inner peak in our rotation curve is not “catasptrophic”. Also overplotted as triangles is the recent “Eris” simulation (Guedes et al., 2011), with colours again indicating V80 (red triangle) and Vmax (blue triangle). Using similar inputs physics and resolution to our simulation, “Eris” also has a good fit to the Tully-Fisher relation which does not depend on the radius at which the measurement is made.
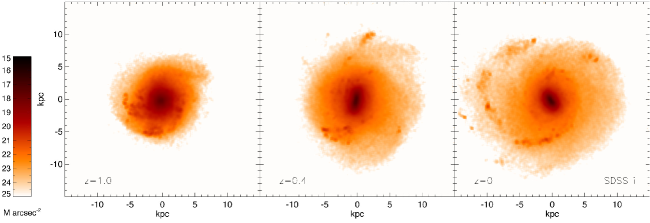
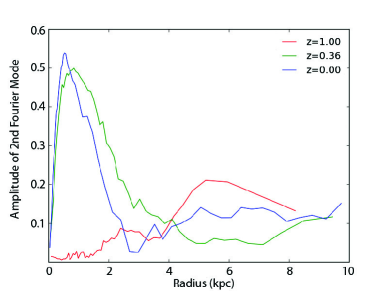
The SDSS i-band surface brightness maps of the simulation at redshit (left), (middle) and (right) are shown in Fig 5, with the surface brightness range indicated in the colour bar. Note the inside out growth of the disc and the strong bar which has developed by . The 2nd mode of the Fourier harmonics of the simulations is shown in Fig 6, confirming that no bar exists at , but a strong bar with has formed by (where is the bar length and is the disc scale length). The bar weakens somewhat by .
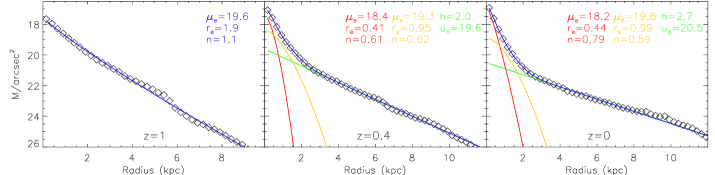
In the three panels of Fig 7, we show the decompositions of the SDSS i-band surface brightness maps from Fig 5. Note that all these one dimensional profile fits were cross-checked GALFIT (Peng et al., 2010), producing similar results. At (left panel), the simulation has formed a pure disc galaxy, best fit by a single Sérsic profile having Sérsic index . Recall that this is 2 Gyrs since the last significant merger event. At (middle panel) and (right panel) we fit a bulge+bar+disc. Also shown in the panels are the fit parameters, i.e. disc scale-length (h) and central surface brightness (uo), and the three Sérsic parameters for the bulge and bar, i.e. the effective brightness (ue), effective radius (re) and Sérsic index (n). In our decompositions, we derive very low Sérsic indices for the bulge component. We caution that this quantity is not reliable, due to gravitational softening which will “expand” the inner mass distribution, with an effect out to softening lengths ( in our simulation), which will lower the Sérsic index. The amount of light/mass in the derived component should not be affected, so the derived B/T results are reliable (B/T at respectively).
Further, we note that other properties of secularly formed “pseudo” bulges are not definitive (Kormendy & Kennicutt, 2004), but more “indicative”. So, although our bulge is also flat ( ranges between 0.55 and 0.9 depending on viewing angle in relation to the bar, where is the elliptcity) and is an oblate rotator (V, , again depending on viewing angle), by far the safest evidence that our simulated galaxy’s bulge formed secularly is in the surface brightness profile evolution and its relation to merger events, from which we can determine that the bulge did not form from gas which lost its angular momentum due to interactions during the merger epoch, but rather it formed via secular processes during the life of the disc.
4 Redistributing Angular Momentum
In this section, we identify and trace all gas which has lost angular momentum and cooled to the bulge region of the simulated galaxy during the galaxy’s “merging epoch”. Specifically, we identify any cold gas (TK) within 2 kpc of the centre of the galaxy at any time between and . This gas generally leads to classical bulge formation. In what follows we refer to this gas as “bulge gas” (BG). There is of such bulge gas, which is of the mass of stars in the galaxy at . Note that time resolution in our output steps means that it is possible that we miss some of the cold gas which is in the bulge region during the merger epoch, so M⊙ is a lower bound. But there is no bias in our selection; the bulge gas that we trace, and from which our conclusions are drawn, is a representative sample of cold gas in the bulge region during the merger epoch.
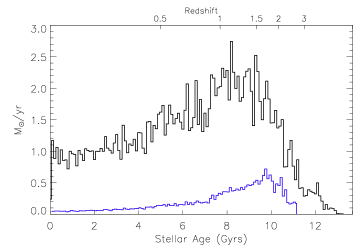
By , 71% () of the bulge gas has formed stars. Of the 29% () remaining as gas at , 14% () has been blown entirely out of the galaxy, 75% () is in the hot halo, while 11% () has subsequently cooled back down to form HI and is feeding star formation in the disc. In Fig 8 we plot the star formation history of all stars in the simulated galaxy at (black line). The blue line shows all stars which form from the bulge gas. Redshifts are included on the upper x-axis. Note the extended star formation history of the stars formed from bulge gas. Although 71% of bulge gas forms stars by , only 9% of it forms stars rapidly after it was first identified as being in the bulge during the merger epoch. The star burst from the 9% bulge gas which forms stars during the merger epoch ejects the remaining 91% of the bulge gas from the bulge region, much of which returns to the galaxy and forms stars at a later time. We note that these large scale outflows also act to prevent gas from falling to the central region during this merger epoch, enhancing their effectiveness at preventing bulge formation.
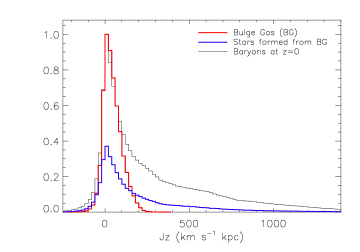
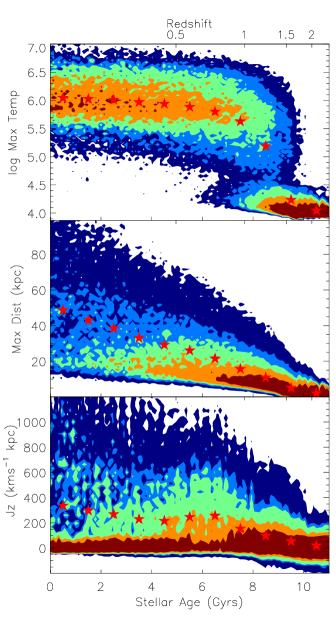
Figure 9 shows the angular momentum distribution of bulge gas (BG, red line) at the time that it was identified. The blue line shows the angular momentum distribution of the stars which form from the BG. These two lines are normalised so that the area under the curves indicates the mass. Also shown for perspective (black line) is the angular momentum distribution of observable “baryons” at , where baryons = stars + HI gas. The baryons distribution is normalised to have a peak at the same hight as the bulge gas. The median (mean) values for the BG, stars formed from BG, and baryons are 35.7 (43.9), 92 (205) and 164 (305) kms-1 kpc respectively.The shape of the distribution of stars formed from BG (blue line) closely resembles the baryon distribution, while the BG (red line) has universally low angular momentum. The angular momentum of the bulge gas has been dramatically redistributed during the process of being blown out of the central region and cooling back to the disc via the galactic fountain. Rather than form bulge stars, the re-accreted gas now primarily forms disc stars.
In Fig. 10, we trace the history of the 71% of the bulge gas which forms stars, and refer to this as “star forming bulge gas” (BGs). Redshifts are shown on the upper x-axis. In the top panel, the log of the Maximum Temperature that BGs reaches subsequent to the time that it was identified (i.e. after they were measured as being in the inner 2 kpc with T K) is plotted against the age of the stars which form from BGs. In the middle panel, the maximum distance that BGs reaches from the centre of the galaxy subsequent to the time that they were identified, is plotted against the age of BGs stars. In the bottom panel, the mean angular momentum of BGs stars is plotted against their age. 9% of the BG forms stars in the bulge region shortly after the time that it is first identified, before it is blown out of the central region, and consequently forms these stars with the low angular momentum it had when identifed (Fig 9). Supernova feedback heats gas which has low angular momentum and removes it from the inner central region of the galaxy, with the hottest gas travelling the furthest from the centre. The ejected gas mixes with the corona gas, as well as later accreting gas, and returns to the disk with a significantly altered angular momentum distribution. In particular, gas that is re-accreted from the galactic fountain at later times has a significanlty less negative and low angular momentum baryons, a far greater amount of high angular momentum material, a higher median angular momentum, and forms stars in the disc rather than bulge.
5 Discussion
5.1 Transition from Ejection to Redistribution
In Paper I and in this study, we have shown that in our simulations, there are two ways in which galaxies can alter the angular momentum distribution of their baryons: ejection in large scale outflows and redstribution of low angular momentum material in galactic fountains. Ejection was shown to be a crucial process in simulated dwarf galaxies, and this meshes well with the low baryonic mass fractions, while redistribution was shown to be a crucial process in the more massive simulated galaxy considered in this study. Both processes occur at both mass scales in our simulations. Lower than universal baryon fractions indicating that ejection may play a central role at all galaxy mass scales.
We caution that the relative significance of ejection to redistribution is probably not precisely reproduced in current simulations. This is due to the uncertainty involving the inclusion of feedback and the manner in which it couples to the ISM, a problem which is inherent to all galaxy formation models. In a semi-analytic study which assumes the ejection of low angular momentum gas, Dutton & van den Bosch (2009) found that it was necessary to couple 25% of SNe energy to outflows to produce realistic disc galaxy populations. Current estimates of the relationship between stellar mass and halo mass (Mandelbaum et al., 2006; Koposov et al., 2008; Guo et al., 2010; Moster et al., 2010; Dutton et al., 2010; More et al., 2011; Avila-Reese et al., 2011) indicate that the current simulation has a factor too many stars, implying that the role of ejection of low angular momentum gas was most likely underestimated for a galaxy of the mass considered in this study. We note that the key observable for detecting ejection is in fact baryon rather than stellar mass fraction, but the fact that our simulation has a reasonable value of HI/LR means that we can assume that we have a similar over-abundance of baryons for our halo mass. What we do expect is the relative importance of redstribution compared to ejection to increase in more massive disk galaxies, compared to their low mass counterparts, and that the ejection fraction due to SNe would be the lowest for L∗ galaxies where the ratio of stellar mass (Guo et al., 2010; Moster et al., 2010) and baryonic mass (Bell et al., 2003) to dark halo mass are both at their highest. More massive systems, even groups and clusters of galaxies, also have a baryon fraction that is less than universal (McCarthy et al., 2007; Giodini et al., 2009; Dai et al., 2010) but this is widely attributed to the affects of Active Galactic Nuclei which are not included in these simulations.
5.2 Additional Central Energy Sources
Our simulations do not include all possible energy sources, and any extra central heating, for example from black holes, nuclear star clusters (McLaughlin et al., 2006; Rodríguez-González et al., 2011) or a top heavy IMF in the bulge (Ballero et al., 2007), would add to the efficacy of our model. We again note that the outflows due to starbursts triggered during merger events actually prevent gas flowing to the central regions, enhancing their effectiveness (it was shown in Paper I that it is preferentially low angular momentum gas above and below the plane that is prevented from being accreted).
5.3 Angular Momentum Transfer
In a previous study of angular momentum transfer in similar galaxy formation simulations, Roškar et al. (2010), showed that outer disc warps result from torquing of the cold gas by a massive (misaligned) hot gas halo. Due to this torquing in the outer halo, the cold gas aligns with the spin of the hot gas halo by the time it reaches the central region. In those simulations, all the gas (clumpy, shocked, cold flow, recycled from disc) ended up with the same angular momentum distribution, due to this torquing, coupled with hydrodynamical drag. These processes are what is also occurring in our simulations.
On the scale of local galactic fountains, significantly higher resolution simulations can be employed than can be achieved in fully cosmological studies such as ours. Hydrodynamical simulations of these local galactic fountains have shown that both drag and accretion into clouds can efficiently transfer angular momentum between the galactic corona and gas outflows (Fraternali & Binney, 2008; Marinacci et al., 2011). Although there are many differences between the temperatures, times scales and velocities of the interactions of the galactic fountains in those studies and in ours, this is encouraging. Certainly, there is a need for significant theoretical and observation work to constrain the transport of angular momentum between gas with different origins and phases, particularly in the corona where hot halo gas mixes with newly accreted gas and gas blown from the star forming regions of the galaxy.
We also note that disc viscosity and gas pressure within the disc due to supernovae and stellar winds (Valenzuela et al., 2007) may play a role in angular momentum transport, but some angular momentum must be imparted to the gas prior to re-accretion for it to fall at large enough radii to form part of the disc.
6 Summary
We have formed a simulated, late type disc galaxy which has no classical bulge. The gas which is driven to the bulge region during the merger epoch, and thus has low angular momentum, is blown out by supernova powered winds which follow the star bursts that are triggered by the mergers. A significant fraction of the blown out gas is re-accreted at later times and forms disc stars. We show that this redistribution of angular momentum via large scale galactic fountains can lead to the formation of massive disc galaxies which do not have classical bulges. In Paper I, we showed that galactic outflows will result in the ejection of low angular momentum material and hence the formation of bulgeless dwarf galaxies. The processes outlined in Paper I which relate to ejection of gas remain relevant to biases toward low angular momentum outflows from more massive galaxies, whether or not such gas is re-accreted, and the two papers should be read in conjunction.
We have shown that our self-consistent model for the ejection and redistribution of low angular momentum gas, with the latter increasing in significance in higher mass galaxies, can explain the existence of bulgeless disc galaxies that form hierarchically within a cold dark matter universe. Our model has the implicit assumptions that (i) energy from supernova during merger triggered starbursts couples effectively to the ISM and (ii) angular momentum can be transported between between ejected gas and newly accreted and hot halo gas. These processes require significant theoretical and observational work to be better constrained, which will provide crucial tests of our model.
Acknowledgments
CB and BKG acknowledge the support of the UK s Science & Technology Facilities Council (STFC Grant ST/F002432/1). TQ was supported by NSF ITR grant PHY- 0205413. We acknowledge the computational support provided by the UK s National Cosmology Supercomputer, COSMOS.
References
- Adelberger et al. (2005) Adelberger K. L., Shapley A. E., Steidel C. C., Pettini M., Erb D. K., Reddy N. A., 2005, ApJ, 629, 636
- Agertz et al. (2010) Agertz O., Teyssier R., Moore B., 2010, ArXiv e-prints
- Allen et al. (2006) Allen P. D., Driver S. P., Graham A. W., Cameron E., Liske J., de Propris R., 2006, MNRAS, 371, 2
- Avila-Reese et al. (2011) Avila-Reese V., Colín P., González-Samaniego A., Valenzuela O., Firmani C., Velázquez H., Ceverino D., 2011, ArXiv e-prints
- Ballero et al. (2007) Ballero S. K., Kroupa P., Matteucci F., 2007, AAP, 467, 117
- Barnes & Efstathiou (1987) Barnes J., Efstathiou G., 1987, ApJ, 319, 575
- Barnes & Hernquist (1996) Barnes J. E., Hernquist L., 1996, ApJ, 471, 115
- Bell et al. (2003) Bell E. F., McIntosh D. H., Katz N., Weinberg M. D., 2003, ApJL, 585, L117
- Binney et al. (2001) Binney J., Gerhard O., Silk J., 2001, MNRAS, 321, 471
- Bland-Hawthorn & Cohen (2003) Bland-Hawthorn J., Cohen M., 2003, ApJ, 582, 246
- Blanton (2006) Blanton M. R., 2006, ApJ, 648, 268
- Blumenthal et al. (1984) Blumenthal G. R., Faber S. M., Primack J. R., Rees M. J., 1984, Nature, 311, 517
- Bregman (1980) Bregman J. N., 1980, ApJ, 236, 577
- Bressan et al. (1993) Bressan A., Fagotto F., Bertelli G., Chiosi C., 1993, A&ASS, 100, 647
- Brook et al. (2004) Brook C. B., Kawata D., Gibson B. K., Freeman K. C., 2004, ApJ, 612, 894
- Brooks et al. (2011) Brooks A. M., Solomon A. R., Governato F., McCleary J., MacArthur L. A., Brook C. B. A., Jonsson P., Quinn T. R., Wadsley J., 2011, ApJ, 728, 51
- Bullock et al. (2001) Bullock J. S., Kolatt T. S., Sigad Y., Somerville R. S., Kravtsov A. V., Klypin A. A., Primack J. R., Dekel A., 2001, MNRAS, 321, 559
- Cameron et al. (2009) Cameron E., Driver S. P., Graham A. W., Liske J., 2009, ApJ, 699, 105
- Chevalier & Clegg (1985) Chevalier R. A., Clegg A. W., 1985, Nature, 317, 44
- Dai et al. (2010) Dai X., Bregman J. N., Kochanek C. S., Rasia E., 2010, ApJ, 719, 119
- Dutton et al. (2010) Dutton A. A., Conroy C., van den Bosch F. C., Prada F., More S., 2010, MNRAS, 407, 2
- Dutton & van den Bosch (2009) Dutton A. A., van den Bosch F. C., 2009, MNRAS, 396, 141
- Dwek (1998) Dwek E., 1998, ApJ, 501, 643
- Fall & Efstathiou (1980) Fall S. M., Efstathiou G., 1980, MNRAS, 193, 189
- Ferland et al. (1998) Ferland G. J., Korista K. T., Verner D. A., Ferguson J. W., Kingdon J. B., Verner E. M., 1998, PASP, 110, 761
- Fraternali & Binney (2008) Fraternali F., Binney J. J., 2008, MNRAS, 386, 935
- Freyer et al. (2006) Freyer T., Hensler G., Yorke H. W., 2006, ApJ, 638, 262
- Giodini et al. (2009) Giodini S., Pierini D., Finoguenov A., Pratt G. W., Boehringer H., Leauthaud A., Guzzo L., Aussel H., Bolzonella M., Capak P., Elvis M., Hasinger G., the COSMOS Collaboration 2009, ApJ, 703, 982
- Governato et al. (2010) Governato F., Brook C., Mayer L., Brooks A., Rhee G., Wadsley J., Jonsson P., Willman B., Stinson G., Quinn T., Madau P., 2010, Nature, 463, 203
- Governato et al. (2007) Governato F., Willman B., Mayer L., Brooks A., Stinson G., Valenzuela O., Wadsley J., Quinn T., 2007, MNRAS, 374, 1479
- Guedes et al. (2011) Guedes J., Callegari S., Madau P., Mayer L., 2011, ArXiv e-prints
- Guo et al. (2010) Guo Q., White S., Li C., Boylan-Kolchin M., 2010, MNRAS, 404, 1111
- Haardt & Madau (1996) Haardt F., Madau P., 1996, ApJ, 461, 20
- Heckman et al. (1990) Heckman T. M., Armus L., Miley G. K., 1990, ApJS, 74, 833
- Hopkins et al. (2011) Hopkins P. F., Quataert E., Murray N., 2011, ArXiv e-prints
- Jonsson (2006) Jonsson P., 2006, MNRAS, 372, 2
- Katz (1992) Katz N., 1992, ApJ, 391, 502
- Kautsch (2009) Kautsch S. J., 2009, PASP, 121, 1297
- Klypin et al. (1999) Klypin A., Kravtsov A. V., Valenzuela O., Prada F., 1999, ApJ, 522, 82
- Koposov et al. (2008) Koposov S., Belokurov V., Evans N. W., Hewett P. C., Irwin M. J., Gilmore G., Zucker D. B., Rix H., Fellhauer M., Bell E. F., Glushkova E. V., 2008, ApJ, 686, 279
- Kormendy et al. (2010) Kormendy J., Drory N., Bender R., Cornell M. E., 2010, ApJ, 723, 54
- Kormendy & Kennicutt (2004) Kormendy J., Kennicutt R. C., 2004, ARAA, 42, 603
- Mac Low & Ferrara (1999) Mac Low M., Ferrara A., 1999, ApJ, 513, 142
- Madau et al. (1996) Madau P., Ferguson H. C., Dickinson M. E., Giavalisco M., Steidel C. C., Fruchter A., 1996, MNRAS, 283, 1388
- Maller & Dekel (2002) Maller A. H., Dekel A., 2002, MNRAS, 335, 487
- Mandelbaum et al. (2006) Mandelbaum R., Seljak U., Kauffmann G., Hirata C. M., Brinkmann J., 2006, MNRAS, 368, 715
- Marinacci et al. (2011) Marinacci F., Fraternali F., Nipoti C., Binney J., Ciotti L., Londrillo P., 2011, ArXiv e-prints
- Mathews & Baker (1971) Mathews W. G., Baker J. C., 1971, ApJ, 170, 241
- McCarthy et al. (2007) McCarthy I. G., Bower R. G., Balogh M. L., 2007, MNRAS, 377, 1457
- McKee & Ostriker (1977) McKee C. F., Ostriker J. P., 1977, ApJ, 218, 148
- McLaughlin et al. (2006) McLaughlin D. E., King A. R., Nayakshin S., 2006, ApJL, 650, L37
- More et al. (2011) More S., van den Bosch F. C., Cacciato M., Skibba R., Mo H. J., Yang X., 2011, MNRAS, 410, 210
- Moster et al. (2010) Moster B. P., Somerville R. S., Maulbetsch C., van den Bosch F. C., Macciò A. V., Naab T., Oser L., 2010, ApJ, 710, 903
- Navarro & Steinmetz (2000) Navarro J. F., Steinmetz M., 2000, ApJ, 538, 477
- Navarro & White (1994) Navarro J. F., White S. D. M., 1994, MNRAS, 267, 401
- Nomoto et al. (1997) Nomoto K., Iwamoto K., Nakasato N., Thielemann F.-K., Brachwitz F., Tsujimoto T., Kubo Y., Kishimoto N., 1997, Nuclear Physics A, 621, 467
- Oh et al. (2011) Oh S., Brook C., Governato F., Brinks E., Mayer L., de Blok W. J. G., Brooks A., Walter F., 2011, ArXiv e-prints
- Oppenheimer & Davé (2006) Oppenheimer B. D., Davé R., 2006, MNRAS, 373, 1265
- Peebles (1969) Peebles P. J. E., 1969, ApJ, 155, 393
- Peng et al. (2010) Peng C. Y., Ho L. C., Impey C. D., Rix H., 2010, AJ, 139, 2097
- Pettini et al. (1998) Pettini M., Kellogg M., Steidel C. C., Dickinson M., Adelberger K. L., Giavalisco M., 1998, ApJ, 508, 539
- Pettini et al. (2000) Pettini M., Steidel C. C., Adelberger K. L., Dickinson M., Giavalisco M., 2000, ApJ, 528, 96
- Pizagno et al. (2007) Pizagno J., Prada F., Weinberg D. H., Rix H., Pogge R. W., Grebel E. K., Harbeck D., Blanton M., Brinkmann J., Gunn J. E., 2007, AJ, 134, 945
- Robertson & Kravtsov (2008) Robertson B. E., Kravtsov A. V., 2008, ApJ, 680, 1083
- Rodríguez-González et al. (2011) Rodríguez-González A., Esquivel A., Raga A. C., Colín P., 2011, RMXAA, 47, 113
- Roškar et al. (2010) Roškar R., Debattista V. P., Brooks A. M., Quinn T. R., Brook C. B., Governato F., Dalcanton J. J., Wadsley J., 2010, ArXiv e-prints
- Scannapieco et al. (2010) Scannapieco C., Gadotti D. A., Jonsson P., White S. D. M., 2010, MNRAS, 407, L41
- Shapiro & Field (1976) Shapiro P. R., Field G. B., 1976, ApJ, 205, 762
- Shapley et al. (2003) Shapley A. E., Steidel C. C., Pettini M., Adelberger K. L., 2003, ApJ, 588, 65
- Sharma & Steinmetz (2005) Sharma S., Steinmetz M., 2005, ApJ, 628, 21
- Shen et al. (2010) Shen S., Wadsley J., Stinson G., 2010, MNRAS, 407, 1581
- Simcoe et al. (2002) Simcoe R. A., Sargent W. L. W., Rauch M., 2002, ApJ, 578, 737
- Stinson et al. (2006) Stinson G., Seth A., Katz N., Wadsley J., Governato F., Quinn T., 2006, MNRAS, 373, 1074
- Stinson et al. (2010) Stinson G. S., Bailin J., Couchman H., Wadsley J., Shen S., Nickerson S., Brook C., Quinn T., 2010, MNRAS, 408, 812
- Strickland & Heckman (2007) Strickland D. K., Heckman T. M., 2007, ApJ, 658, 258
- Su et al. (2010) Su M., Slatyer T. R., Finkbeiner D. P., 2010, ApJ, 724, 1044
- Thacker & Couchman (2001) Thacker R. J., Couchman H. M. P., 2001, ApJL, 555, L17
- Tremonti et al. (2007) Tremonti C. A., Moustakas J., Diamond-Stanic A. M., 2007, ApJL, 663, L77
- Valenzuela et al. (2007) Valenzuela O., Rhee G., Klypin A., Governato F., Stinson G., Quinn T., Wadsley J., 2007, ApJ, 657, 773
- van den Bosch (2001) van den Bosch F. C., 2001, MNRAS, 327, 1334
- van den Bosch et al. (2002) van den Bosch F. C., Abel T., Croft R. A. C., Hernquist L., White S. D. M., 2002, ApJ, 576, 21
- van den Bosch et al. (2001) van den Bosch F. C., Burkert A., Swaters R. A., 2001, MNRAS, 326, 1205
- Veilleux et al. (2005) Veilleux S., Cecil G., Bland-Hawthorn J., 2005, ARAA, 43, 769
- Wadsley et al. (2004) Wadsley J. W., Stadel J., Quinn T., 2004, New Astronomy, 9, 137
- White (1984) White S. D. M., 1984, ApJ, 286, 38
- Woosley & Weaver (1995) Woosley S. E., Weaver T. A., 1995, ApJS, 101, 181