The HIRES Collaboration
Upper limits for a narrow resonance in the reaction
Abstract
The reaction has been measured at GeV and with a high missing-mass resolution in order to study the final state interaction. Narrow resonances predicted by bag model calculations are not visible in the missing-mass spectrum. Small structures observed in a previous experiment are not confirmed. Upper limits for the production cross section of a narrow resonance are deduced for missing-masses between 2058 and 2105 MeV.
pacs:
12.39.Ba+13.75.Ev+14.20.Pt+21.30.Fe+24.10.-i+25.40.-hI Introduction
A high-resolution study of the reaction has been performed by the HIRES Collaboration bud10 ; bud10a using the proton beam of the Cooler Synchrotron COSY mai97 and the magnetic spectrograph BIG KARL dro98 ; bojo02 at the Research Center Jülich. The aim of the experiment was to study the final state interaction (FSI) and to search for narrow strangeness resonances. Concerning the FSI, first results have been published bud10 . The present paper deals with the search for a narrow strangeness resonance. We use only the missing-mass data measured at 1.953 GeV beam energy bud10 and ignore a small portion of data below the threshold taken at some higher beam energy bud10a .
Predictions of strange dibaryons are summarized in a recent review by Gal gal10 . A confined six-quark state with , the so called H-dibaryon (from Hexaquark), has been predicted to be the lowest-lying dibaryon state jaf77 . It has been of prime interest both theoretically and experimentally. In the strangeness -1 sector narrow dibaryon resonances and are predicted to be located at about 55 MeV and 95 MeV above the threshold aer84 ; aer85 ; mul79 ; mul80 . The width of the lowest resonance is estimated to be less than about 1 MeV.
Experimentally, the inclusive reaction was first studied with a rather low missing-mass resolution fhint:mel65 ; fhint:ree68 ; fhint:hog68 . There were also exclusive measurements of the reaction by the COSY-TOF Collaboration bil98 ; abd06 ; abd10 and total cross section measurements by the COSY-11 bal98 and COSY-ANKE Collaboration val07 ; val10 . The first high-resolution measurement of has been performed at SATURNE II with proton beam energies of 2.3 and 2.7 GeV using the spectrometer SPES4 fhint:sie94 . The outgoing kaons were detected at forward angles with a high momentum resolution in the focal plane of the SPES4 spectrometer. The missing-mass spectra show characteristic enhancements near the p and N thresholds. At 2.3 GeV and , a sharp peak has been observed in the missing-mass spectrum at MeV above the background which is due to the p continuum. The peak amounts to about 3.5 standard deviations. A similar peak corresponding to a missing-mass of MeV has been observed at 2.7 GeV beam energy and . The statistical accuracies were not high enough to exclude an accidental statistical fluctuation, however, the peak has been observed twice under different experimental and kinematical conditions and the peak energies coincide within the experimental error. It is also interesting to note that the observed peaks were located near the predicted mass of the lowest S = -1 dibaryon aer84 ; aer85 . Therefore, the reaction has been studied with an especially high accuracy in the missing-mass range between 2090 and 2110 MeV.
In Sec. II we give a short description of the experiment. In Sec. III we sketch the predictions of narrow dibaryon resonances. The effect of the lowest dibaryon in the total cross section of the free scattering is discussed in Sec. IV. The formalism to describe a narrow resonance embedded in the continuum of the reaction is presented in Sec. V. In Sec. VI we deduce upper limits for the production cross section of the predicted resonance . Conclusion and discussion follow in Sec. VII.
II Experiment
Here, we give a short description of the experiment which was already reported in bud10 . The reaction was measured at using the proton beam from the cooler synchrotron COSY, the magnetic spectrograph BIG KARL bojo02 and a 1.0 cm thick liquid hydrogen target (see Fig. 1). The momentum of the incoming proton beam was 2.735 GeV/c corresponding to a kinetic energy of 1.953 GeV. The scattered particles in the momentum range 930 - 1110 MeV/ were detected in the focal plane using two stacks of multiwire drift chambers, two threshold Cherenkov detectors siu08 , and two scintillator hodoscopes. The absolute beam momentum was found by measuring simultaneously the tracks of particles and deuterons from the reactions and at fixed BIG KARL momentum 1070 MeV/ and fitting the kinematic parameters. The absolute precision of the beam momentum was 0.15 MeV/. The ratio of beam momentum to scattered particle momentum allowed for a measurement at . In the first dipole magnet of BIG KARL the beam was magnetically separated from the scattered particles and guided through the side exit of the outer yoke into the beam dump.
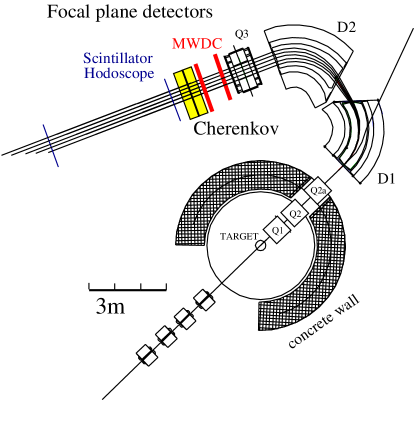
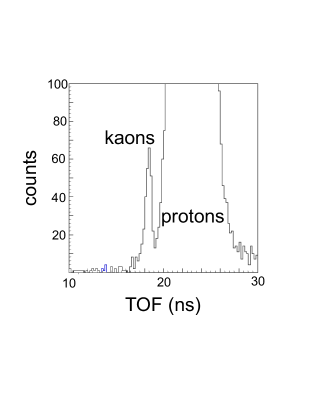
Thus, the huge background from dumping the beam within the spectrometer was avoided. Particle identification was performed using the energy loss () and time of flight (TOF) information from the scintillator hodoscopes. In addition two threshold Cherenkov detectors siu08 were used in order to achieve a very high pion suppression factor of . The momentum of the kaon was measured and the missing-mass of the system was deduced. In order to cover the missing-mass range 2050 – 2110 MeV the data were taken using three overlapping settings of the spectrograph (mean momenta: 1070, 1010 and 960 MeV/). The incoming beam was not changed during those measurements. The relative precision of the momenta of the three settings was 0.1 MeV/.
Acceptance corrections with respect to solid angle and momentum were taken from Monte Carlo calculations. The acceptance correction functions contained the magnetic spectrograph momentum acceptance around with cuts on the horizontal emission angle and the vertical emission angle with and transversal momentum components and the longitudinal component. The cuts for a given missing-mass bin corresponded to the measured solid angle . They contained also the detector efficiency corrections. The detector efficiency included efficiency of scintillator detectors which determined trigger and particle identification and magnetic spectrograph efficiency with field inhomogeneity at the edges of the acceptance. Acceptance corrections as determined by Monte Carlo simulations were checked by use of experimental distributions of simultaneously measured pions. They are shown in Fig. 2. The acceptance correction function of the 960 MeV/ setting looks different due to a slightly different and cut.


The kaon decay along flight path was taken into account for each individual trajectory. Path lengths were obtained from calculations of tracks in the magnetic field with the Turtle code Turtle . They were checked by experimentally deduced values from time of flight measurements of pions and protons. The cross section error due to survival probability is less than 1 %. The final kaon survival probability averaged for a given missing-mass bin is presented in the bottom panel of Fig. 2.
The relative normalizations of the three different spectrograph settings were deduced from luminosity monitors located in the target area which were independent of the spectrograph settings. The relative normalization errors due to the luminosity measurement were negligibly small. The relative normalization errors due to the acceptance corrections were estimated to be less than 2 %.
The absolute cross section normalization was determined by measuring the luminosity as described in bojo02 . At the beginning of each beam period we calibrated two luminosity monitors counting the left and right scattered particles from the target as function of the number of beam particles. To this end, the beam current was highly reduced in order to count the beam particles individually with a fast scintillator hodoscope in the beam dump. For the calibration, the dependence of the luminosity signal on the beam intensity was fitted by a linear function. The resulting beam intensity error amounted to about 5 %. The density of the bubble-free liquid hydrogen target ( g/cm3) with 1 m thick mylar foil windows was kept constant by stabilizing the temperature to K using a high-precision temperature control kilian02 .
The target thickness, i.e. the distance between entrance and exit window (nominal 1 cm) was precisely measured with a calibrated optical telescope. The target thickness error was about 5 %. The overall systematic normalization error was estimated to be 10 %. The missing-mass spectrum is shown in Fig. 4.
In view of the predicted narrow dibaryon resonances in the system a high missing-mass resolution was required. The missing-mass resolution depends on the spread of the beam momentum, the beam spot size at the target, the target thickness, the momentum resolution of the magnetic spectrograph and the 1 MeV bin width. The effective resolution function has been deduced in bud10 by a least-square fit to the sharply rising double differential cross section near the threshold, see Fig. 4. It can be represented by a Gaussian density distribution with a standard deviation of MeV. It should be noted that the width depends mainly on the spread of the beam momentum and the 1 MeV bin width. The contributions from the target thickness, the beam spot size at the target (3 mm) and the momentum resolution of the magnetic spectrograph are negligibly small. Since the COSY beam has not been changed during the measurements the resolution function is constant in the full range of missing-masses.
III Predictions of narrow dibaryon resonances in the system
Concerning the predictions of narrow dibaryon resonances in the system we refer to calculations of Aerts and Dover aer84 ; aer85 . They studied the decay width of strangeness six-quark bag states predicted by the Nijmegen group mul79 ; mul80 on the basis of the MIT bag model. The predicted H-dibaryon with quark structure is the strongest bound dibaryon state jaf77 . In case of states the color-magnetic force is less strong and hence the lowest state is predicted to be about 120 MeV above the threshold mul80 .
The lowest-lying resonances exhibit a quark cluster structure . The singlet state (1P1) is located at about 55 MeV above the threshold, and the triplet states (3P0,1,2) are located at about 95 MeV above the threshold. This corresponds for the lowest-lying dibaryon to an invariant mass of 2109 MeV which is located between the -proton and -nucleon thresholds. The resonance is a singlet state of a four quark-two quark cluster configuration with angular momentum , spin , total angular momentum and parity . The isospin is . The only particle-decay channel is the wave of the system. This decay is hindered by the relative -wave centrifugal barrier between the two clusters and the stability of the configuration against dissociation into two color singlet () clusters. In other words, the channel represents only a small piece of the wave function. As a consequence, the total width of is predicted to be less than about 1 MeV aer84 ; aer85 . In addition, the predicted width depends on the resonance mass , see Fig. 2 of aer84 . We note that there is a rather large uncertainty of the predicted resonance masses . Therefore, the production of the dibaryon has been studied theoretically in the invariant mass range between 2.06 and 2.10 GeV/c2 aer85 . In the present paper, we consider the invariant mass range between 2.058 and 2.105 GeV/c2 which corresponds to resonance energies between 4 MeV and 51 MeV.
We deduce from Fig. 2 of aer84 keV for MeV ( MeV). Extrapolating to MeV ( MeV) yields keV. We note that these total widths are lower limits. The decay width calculation involves an integration of the dibaryon wave function over the radial distance . Such integrals are dominated by the contributions from small radii which give a lower limit of . Including the larger radii gives an upper limit. Then, the lower limit has to be multiplied by 64/3 to obtain an upper limit. In addition, the width increases by about a factor of 2 if Hulthèn rather then oscillator wave functions are used. Thus, an upper limit is obtained if the lower limit is multiplied by a factor 128/3 aer84 . We get the following ranges for the predicted total width: keV for MeV ( MeV) and keV for MeV ( MeV). As one can see, the predicted widths depend strongly on the invariant mass of the dibaryon.
We emphasize that a possible resonance below the threshold (2128.935 MeV) can only decay into . Therefore, the elastic width can be assumed to be equal to the total width , i.e. .
IV Simulation of a narrow resonance in the total cross section of scattering
We first discuss the effect of a single isolated narrow resonance in the total cross section of the scattering and we compare it with existing data from bubble chamber experiments gro63 ; pie64 ; fhint:ale68 ; fhint:sec68 ; kad69 ; hau77 . We start with the ansatz
| (1) |
Here, is the nonresonant part and the resonant part of the total cross section. Assuming S-waves and taking the effective range approximation the nonresonant part of the total cross section may be written gold64
| (2) |
Here, and are the singlet and triplet scattering lengths, and are the singlet and triplet effective ranges and is the wave number corresponding to the c.m. momentum . We take the effective range parameters fm, fm, fm, fm as determined in bud10 .

The resonant part of the total cross section can be approximated by the Breit-Wigner resonance formula,
| (3) |
Here, is the total kinetic energy in the c.m. system, is the wave number corresponding to the c.m. momentum and we assume . We take the narrow resonance as an example. The resonance is predicted to occur in the partial wave . Therefore, we assume . As resonance energy we take MeV corresponding to MeV of the peak seen by Siebert et al. fhint:sie94 . At this energy, the nonresonant potential scattering is dominated by the partial waves and and the nonresonant contributions of the waves can be neglected in Eq. (2). The same holds true for a possible interference between the resonant and nonresonant amplitude in Eq. (3). The Jülich hyperon-nucleon model haid05 yields for instance phase shift predictions with for and .
In Fig. 3 we show the effect of the resonance with and MeV for keV without taking the effect of a finite energy resolution into account. We take keV as an example. A resonance with keV would appear as a sharp needle in Fig. 3. The maximum of the resonance signal at is very large, . Such a resonance could be easily observed provided the effective energy resolution would be sufficiently high. Unfortunately, the bubble chamber experiments suffer from low-energy resolution as well as from low statistical accuracy. For instance data points near the resonance exhibit bin widths of 50 MeV/ ( MeV) and 100 MeV/ ( MeV). These bin widths are so large that the effect of a narrow resonance is completely diluted.
V Narrow resonance embedded in the continuum of
The reaction can be described by factorizing the reaction amplitude in terms of a production amplitude and a final state enhancement factor. The method of parametrizing the FSI enhancement factor by the inverse Jost function gold64 is described in bud10 ; hint04 . Taking the spin statistical weights into account the nonresonant double differential cross section may be written as
| (4) |
Here, and are the singlet and triplet production matrix elements squared, the internal c.m.-momentum of the system, , , , the singlet and triplet potential parameters, and the ratio of the three-body phase space distribution and the incident flux factor. The potential parameters and can be used to establish phase-equivalent Bargmann potentials bar49b . They are related to the scattering lengths , and effective ranges of the low-energy wave scattering, , . Thus, the shape of the missing-mass spectrum (4) depends on , and the effective range parameters , , and . These parameters have been deduced by a combined fit of the data and the total cross section data bud10 . In principle one could equally well take a fit with three spin-averaged parameters , and (see bud10 ) or another three-parameter description of the missing-mass spectrum as in e.g. gasp04 .
A narrow resonance embedded in the continuum of the reaction can be described using the following equation
| (5) |
This equation corresponds to a formula derived by Pilkuhn pil79 in order to describe the reaction where is a narrow resonance decaying into particles 1 and 2, . Here, represents the differential cross section for the production of the resonance , the resonance mass, the total width and the invariant mass of the system. The relativistic Breit-Wigner form in (5) can be approximated by the corresponding nonrelativistic Breit-Wigner form,
| (6) |
In passing, we note that the integral over the Breit-Wigner distribution is normalized to one,
| (7) |
The double differential cross section including a possible narrow resonance in the system may be written by combining (4) and (5),
| (8) |
We mention again that possible wave contributions in the interaction are negligibly small at low c.m. energies haid05 . Therefore, the effect of an interference with the nonresonant decay channel can be neglected. The relative contribution of a narrow resonance to the double differential cross section depends on the production cross section for . In the present paper, we deduce upper limits for the production cross section.

VI Upper limits for a narrow resonance
A narrow resonance as predicted by aer84 ; aer85 is not visible in the data (see Fig. 4). There may be two reasons for it. (i) The predicted narrow resonance does not exist at all in the invariant mass region below 2110 MeV. (ii) The production cross section is too small. In the following, we deduce upper limits for the production cross section in the given invariant mass range.
VI.1 Effective resolution function
We note that the theoretical expression for the double differential cross section (8) must be folded with the effective resolution function before comparing with the data. The effective resolution function is represented by a Gaussian density distribution with a standard deviation of MeV. It was deduced in bud10 by a least-square fit to the sharply rising double differential cross section near the threshold, see Fig. 4. As discussed in Sec. II the effective resolution function is constant in the full missing-mass range between 2050 MeV and 2110 MeV.

VI.2 test
The compatibility of the experimental data with the hypothesis of a narrow resonance in the invariant mass region below 2110 MeV has been studied using a test. Using this method we determine the upper limits of the production cross section in the invariant mass range between 2058 and 2105 MeV, see Fig. 5. We only include the data measured within MeV around the assumed resonance mass . The data are binned in 1 MeV wide bins; thus nine data points are used for the test. Including more data would dilute the information, since an excursion with a width of about MeV is negligibly small for MeV, see Fig. 4.
The obtained from a comparison of the hypothesis to the data is subject to a standard test pdg10 . We assume that the is statistically distributed according to a probability density function with the appropriate number of degrees of freedom, . Thus, we can calculate the confidence level (CL) with which we can support or falsify the hypothesis. If the hypothesis is true, the probability to obtain a larger than the observed one in an infinite repetition of the experiment is given by
| (9) |
If is very small, either the hypothesis is wrong or the current measurement suffers from a very unlikely statistical fluctuation. The CL for excluding the hypothesis of a narrow resonance with a certain production cross section is given by . Thus, we have % for a confidence level of 99 %, i.e. the probability to observe a larger when repeating the experiment is only 1 %.
We use the number of data points within the invariant mass interval MeV as the number of degrees of freedom, . Thus, we neglect the degrees of freedom introduced by fitting the missing-mass spectrum. Three fit parameters, i.e. the spin-averaged parameters , and , are sufficient in order to reproduce the measured missing-mass spectrum. They cannot be considered as free parameters in the present hypothesis test. We mention that there is no significant effect on the deduced upper limits due to the errors of those parameters. Thus, we have and for %.
VI.3 Upper limits for the production cross section
The upper limits for the production cross section are shown in Fig. 5 for keV (dotted line), keV (dashed-dotted line), and MeV (solid line). We note that the upper limits depend slightly on the total width . For very small total widths, i.e. keV one can take the upper limits for keV. The differences between the upper limits for keV and keV are negligible.
The upper limits exhibit rather strong fluctuations due to the statistical fluctuations of the data. In the lower part of the missing-mass spectrum between 2058 and 2080 MeV, the upper limit varies between 43 and 77 nb/sr for keV, 50 and 86 nb/sr for keV, and 50 and 97 nb/sr for MeV. In the region between 2080 and 2105 MeV the upper limits are roughly a factor of 2 smaller. This is because four data points between 2080 and 2090 MeV are below the fit curve and that the missing-mass region between 2090 and 2105 MeV has been measured with a much higher statistical accuracy. There, the upper limit varies between 21 and 37 nb/sr for keV, 23 and 42 nb/sr for keV and 26 and 47 nb/sr for MeV.
VII Conclusion and Discussion
The effect of a single isolated narrow resonance in the total cross section of the free scattering has been studied (see Fig. 3). A narrow strangeness resonance in the channel is predicted to be characterized by a rather large resonance signal. Therefore, the free scattering would be ideal to search for a narrow resonance. However, the effective resolution and the statistical accuracy of existing scattering data are too low for a stringent upper limit search.
The reaction has been measured at GeV and with a high missing-mass resolution. A narrow strangeness resonance as predicted by aer84 ; aer85 is not visible in the data (see Fig. 4). The missing-mass range between 2090 and 2110 MeV has been studied with an especially high statistical accuracy. The apparent small enhancement near 2096.5 MeV (see Fig. 4) corresponds to an excursion of only 1.5 standard deviations. Upper limits of the production cross section are deduced for resonance energies between 2058 and 2105 MeV, see Fig. 5. In the missing-mass region between 2090 and 2105 MeV the upper limit varies between 21 and 37 nb/sr for keV, 23 and 42 nb/sr for keV and 26 and 47 nb/sr for MeV.
Unfortunately, there are no theoretical predictions of the production cross section . Aerts and Dover gave estimates of production cross sections of strangeness dibaryon states for the reactions and aer85 . Differential cross sections of order 1 b/sr were predicted.
The transition from the entrance channel requires orbital angular momentum transfer and 2. Thus, the production cross section should peak at the scattering angle . The reaction has been measured at , i.e. at the maximum of the angular distribution. Therefore, one expects maximum sensitivity when searching for a narrow strangeness resonance with the reaction .
It is interesting to note that the upper limit of the production cross section is nearly independent of the total width as long as . This is due to the fact that the integral over the Breit-Wigner distribution (6) is constant (equal to one), that means it does not depend on . Thus, folding a narrow Breit-Wigner distribution (6) with a wider Gaussian distribution yields a resonance signal which depends only on the production cross section and the effective resolution width but not on . This is a great advantage when searching for an extremely narrow resonance. The sensitivity in the search for a narrow resonance can be increased substantially by increasing the missing-mass resolution, i.e. by decreasing the resolution width . Another less efficient way is to increase the statistical and systematic accuracy.
In contrast to previous experiments, the present experiment exhibits a rather high missing-mass resolution. In previous experiments, the missing-mass resolution has been very much lower. Hogan et al. fhint:hog68 studied the reaction at bombarding energies between 2.5 and 3.0 GeV and scattering angles , and . The momentum resolution of the detected kaons () ranged from 1.5 % at to 3 % at . The number of data points per MeV/ and the effective missing-mass resolution was so low that they were not able to see the marked FSI enhancement near the threshold. Reed et al. fhint:ree68 studied the reaction at 2.40 and 2.85 GeV and , and . The momentum resolution of the outgoing kaons at corresponded to %. This resolution was also too low to search for a narrow resonance with MeV. The same holds true for the exclusive measurements of the reaction by the COSY-TOF Collaboration bil98 ; abd06 ; abd10 .
As mentioned in the introduction, Siebert et al. fhint:sie94 performed the first high-resolution study of the reaction . Sharp peaks in the missing-mass spectra seen there have not been confirmed by the present experiment. In this context we note that the reaction has been studied fhint:sie94 at MeV at four scattering angles, 6∘, 8.3∘, 10.3∘, and 12∘. The peak near appeared only in the missing-mass spectrum measured at but not at 6∘, 8.3∘ and 12∘. At MeV, the interesting missing-mass range has been studied at two scattering angles, 12.6∘ and 20∘. The peak near appeared only at but not at 20∘. We therefore conclude that the peaks near and MeV must be attributed to a statistical fluctuation of the nonresonant cross section.
Summarizing, the reaction has been measured with a high missing-mass resolution at GeV and . A narrow strangeness resonance is not visible in the missing-mass spectrum. Upper limits for the production cross section of have been deduced.
ACKNOWLEDGEMENT
We acknowledge helpful discussions with J. Haidenbauer and C. Hanhart.
References
- (1) HIRES Collaboration, A. Budzanowski et al., Phys. Lett. B 687, 31 (2010).
- (2) HIRES Collaboration, A. Budzanowski et al., Phys. Lett. B 692, 10 (2010).
- (3) R. Maier, Nucl. Instr. and Meth. A 390, 1 (1997).
- (4) GEM Collaboration, M. Drochner et al., Nucl. Phys. A 643, 55 (1998).
- (5) J. Bojowald, et al., Nucl. Instr. and Meth. A 487, 314 (2002).
- (6) A. Gal, Gerry Brown’s 85th birthday Festschrift, arXiv:1011.6322v2 [nucl-th] (2010).
- (7) R.L. Jaffe, Phys. Rev. Lett. 38, 195 (1977).
- (8) A.T.M. Aerts and C.B. Dover, Phys. Lett. 146B, 95 (1984).
- (9) A.T.M. Aerts and C.B. Dover, Nucl. Phys. B 253, 116 (1985).
- (10) P.J.G. Mulders, A.T.M. Aerts and J.J. de Swart, Phys. Rev. D 19, 2635 (1979).
- (11) P.J.G. Mulders, A.T.M. Aerts and J.J. de Swart, Phys. Rev. D 21, 2653 (1980).
- (12) A.C. Melissinos et al., Phys. Rev. Lett. 14, 604 (1965).
- (13) J.T. Reed et al., Phys. Rev. 168, 1495 (1968).
- (14) W.J. Hogan, P.A. Piroué and A.J.S. Smith, Phys. Rev. 166, 1472 (1968).
- (15) R. Bilger et al., Phys. Lett. B 420, 217 (1998).
- (16) COSY-TOF Collaboration, S. Abd El-Samad et al., Phys. Lett. B 632, 27 (2006).
- (17) COSY-TOF Collaboration, S. Abd El-Samad et al., Phys. Lett. B 688, 142 (2010).
- (18) J.T. Balewski et al., Phys. Lett. B 420, 211 (1998)
- (19) Y. Valdau et al., Phys. Lett. B 652, 245 (2007).
- (20) Y. Valdau et al., Phys. Rev. C 81, 045208 (2010).
- (21) R. Siebert et al., Nucl. Phys. A 567, 819 (1994).
- (22) R. Siudak, et al., Nucl. Instr. and Meth. A 596 (2008) 311.
- (23) D.C. Carey and C. Iselin, TURTLE, A computer program for beam transport simulations including decay, CERN Program Library W151 (1984).
- (24) S. Abdel-Samad, M. Abdel-Bary and K. Kilian Nucl. Instr. and Meth. A 495 (2002) 1.
- (25) Th.H. Groves, Phys. Rev. 129, 1372 (1963).
- (26) L. Piepenbrock et al., Phys. Rev. Lett. 12, 625 (1964).
- (27) G. Alexander et al., Phys. Rev. 173, 1452 (1968).
- (28) B. Sechi-Zorn et al., Phys. Rev. 175, 1735 (1968).
- (29) J.A. Kadyk et al., Nucl. Phys. B 27, 13 (1969).
- (30) J.M. Hauptmann et al., Nucl. Phys. B 125, 29 (1977).
- (31) M.L. Goldberger and K.M. Watson, Collision Theory (J. Wiley, New York, 1964) p. 549.
- (32) J. Haidenbauer and Ulf-G. Meißner, Phys, Rev. C 72, 044005 (2005).
- (33) F. Hinterberger and A. Sibirtsev, Eur. Phys. J. A 21, 313 (2004).
- (34) V. Bargmann, Rev. Mod. Phys. 21, 488 (1949).
- (35) A. Gasparyan, J. Haidenbauer, C. Hanhart and J. Speth, Phys. Rev. C 69, 034006 (2004).
- (36) H.M. Pilkuhn, Relativistic Particle Physics (Springer-Verlag, New York, Heidelberg, Berlin, 1979) p. 166.
- (37) K. Nakamura et al. (Particle Data Group), J. Phys. G 37, 075021 (2010).